Fight Zone
- 指标
- Tiago Viger Ortiz
- 版本: 1.0
- 激活: 5
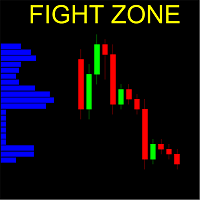
Vertical bar chart of candles!
What is it
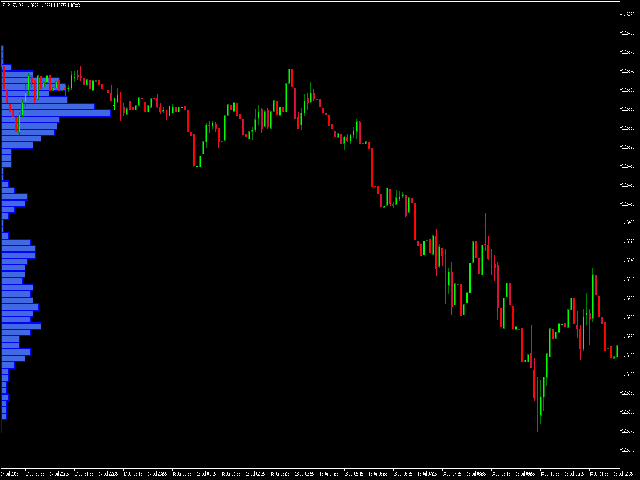
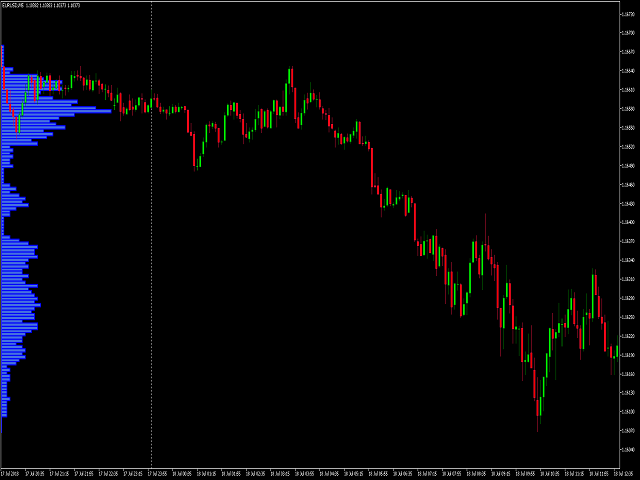
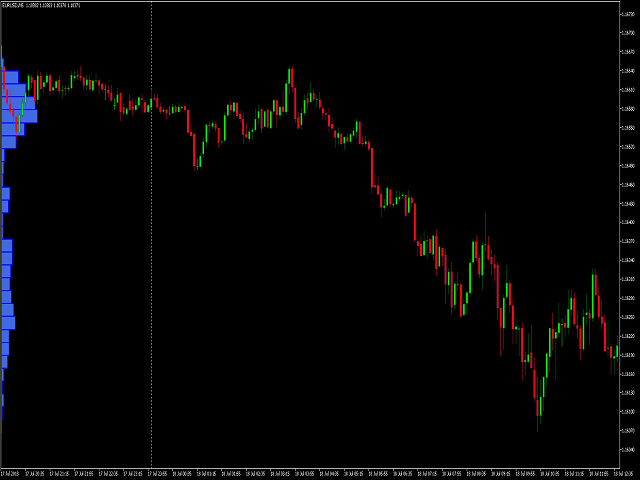
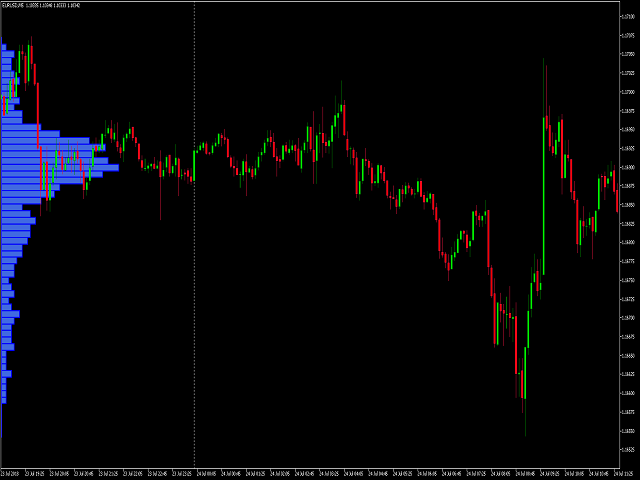
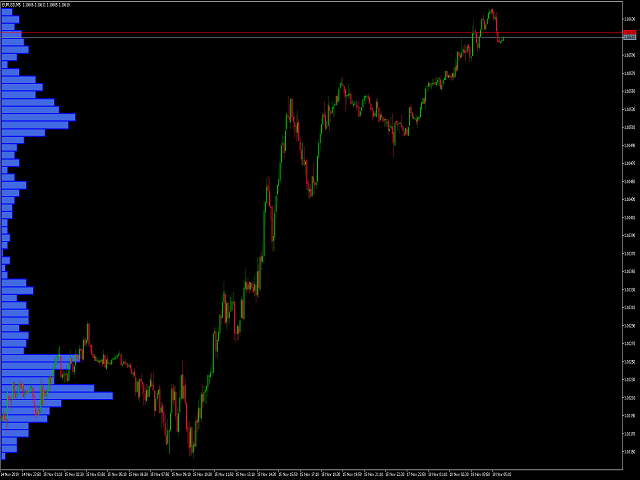
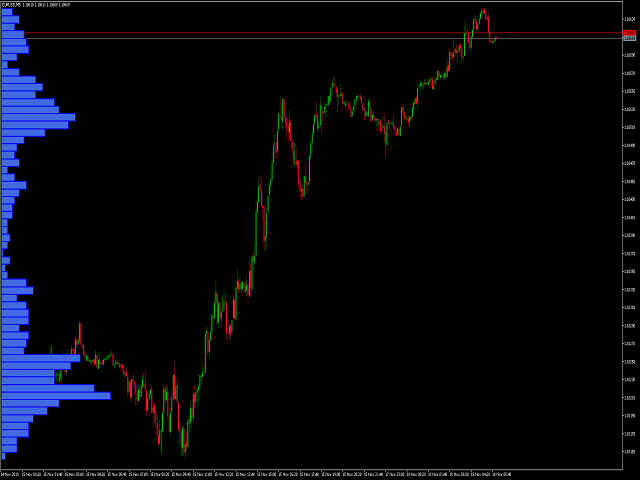
This indicator creates a vertical bar chart of all visible candles corresponding to the amount of candles that the bars cross.
The goal of this indicator is to easily check the places or regions where the candles concentrate.
Those regions are a good place to place positions because they have a increased chance of staying more time there again.
It's hard to explain in words the exactly working of this indicator, we suggest you watch the video, it is only 45 seconds long!
Advantages
# With this indicator is possible to easily locate the places where the candles concentrate.
# This indicator works on the visible candles, so when the chart is moved or more candles added, the bars will update automatically.
# Finding the fighting zones, you will have more chances of executing your order.
How to use it
For the first time: just add it to the MetaTrader and it will run!!!
The indicator checks the visible candles each 100 ms (configurable). On old computers, it may get a bit slow, so you can increase this number at will.
You can change how many bars will have on the screen.
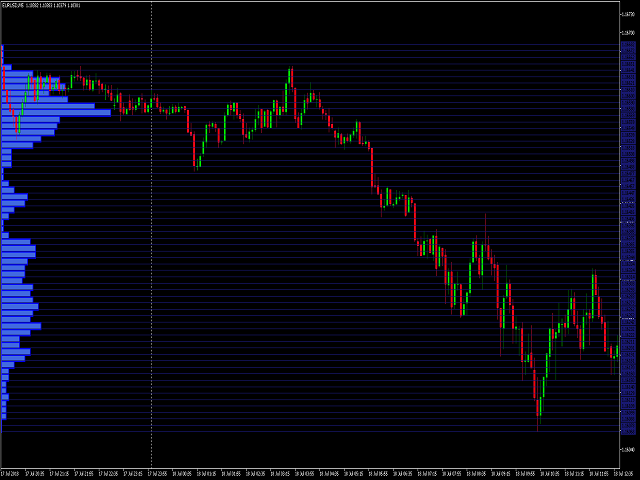
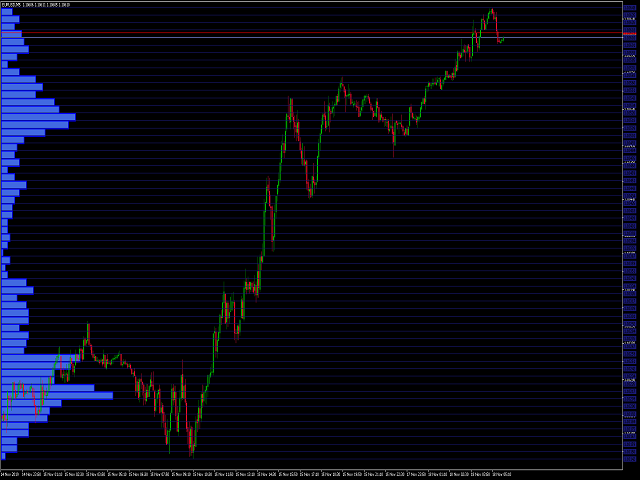
Lines crossing the whole chart are optional. They sometimes help but when there are too many bars, they disturb the vision.
All the colors can be changed! Including the lines, bar's border and bar's background, which can be invisible too.
The bars can be above or below the candles, we recommend below so all candles continue to be visible.
There are 2 ways that the bars can be drawn:
1 - For every candle that a bar crosses, it will grow X pixels for the right. So when zoom out, it's possible that the bars will grown over the border of MetaTrader. (the X can be changed in the parameters)
2 - The biggest bar will take a fixed percentage of the available screen, the others will have the length based on this bar. We recommend this! (The percentage of the screen can also be changed in the parameters)
Parameters
- Amount of bars - Number of bars that will be drawn (default: 60).
- Draw Lines? - Should lines be drawn as well.
- Draw bars behind candles? - The bars are going to be on top or behind the candles (default: behind).
- Time to refresh - Time (in ms) that the bars will look for changes and be redrawn if necessary (default: 100 ms).
- Display Type (Percentage or Pixel Fixed) - Draw bars by fixed pixels or screen percentage.
- Each bar crossed will expand X pixels - Fixed pixels distance to grow for each candle crossed (only works when mode 1 is selected - default: 5 px).
- Percentage of the screen to use - Percentage to use on the biggest bar (only works when mode 2 is selected - default: 20% of the screen).
- Border color - color of the bar's border.
- Background color - color of the bar's background.
- Line color - color of the line (if enabled).
Developer
TVO TECHNOLOGIES - Professional developers at your service!
