• 概述
  • 评论 (3)
  • 评论 (4)

Candle Pattern Scanner


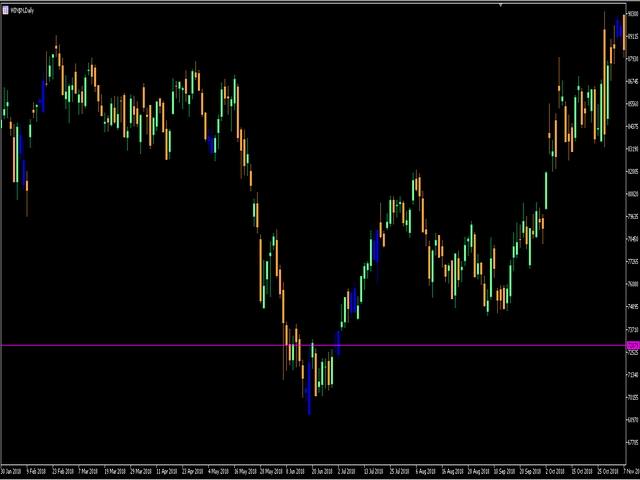
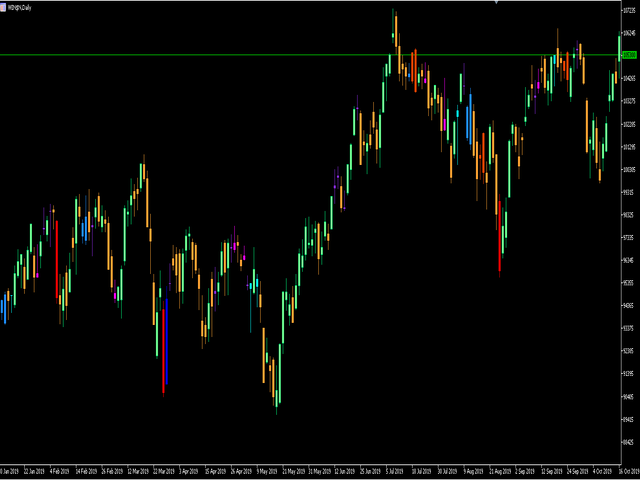
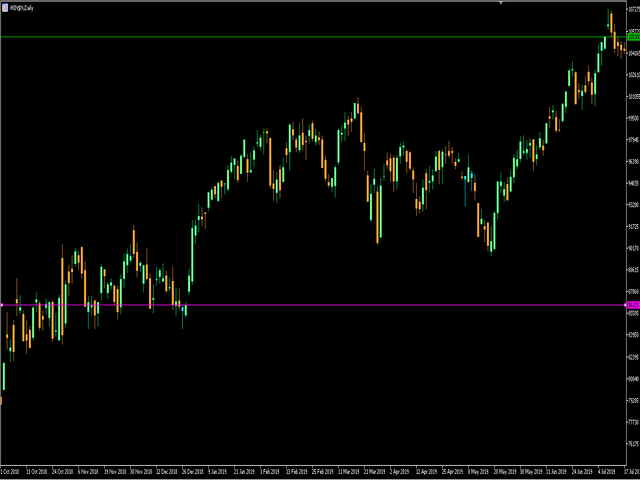
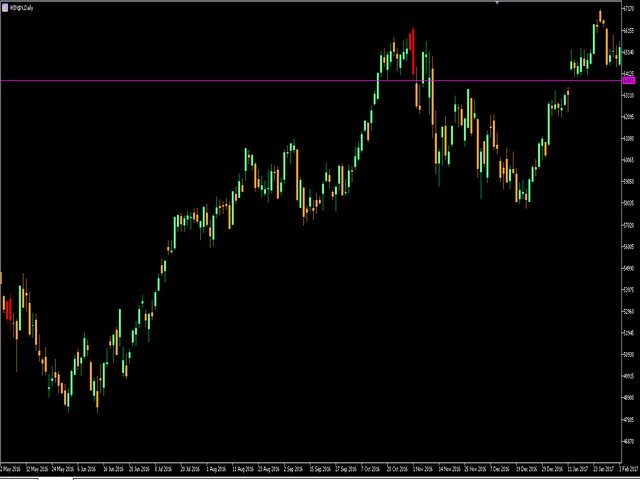
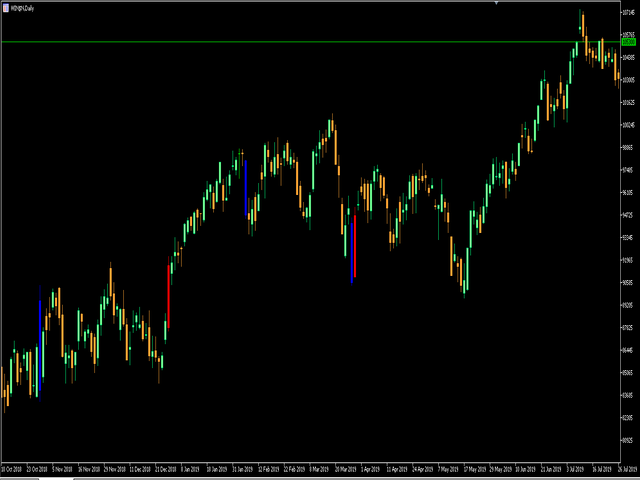
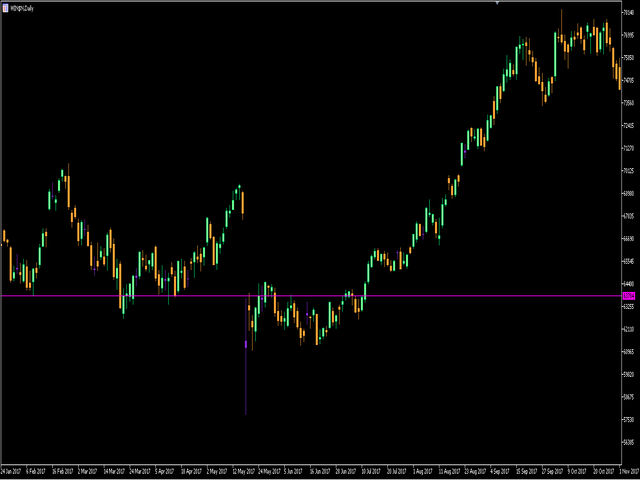
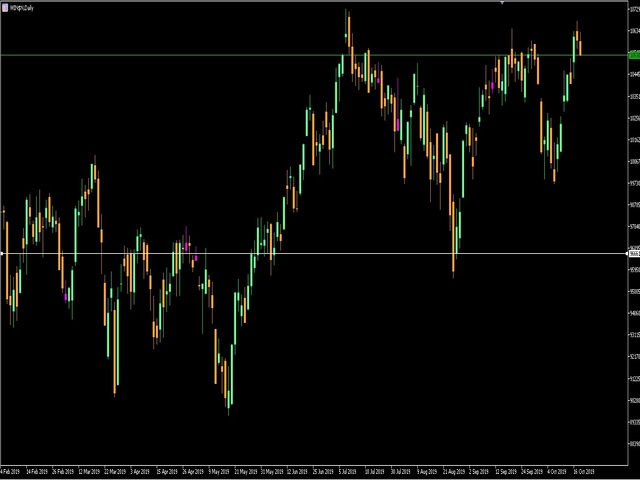
Candlestick patterns

The candlestick Pattern Indicator and Scanner is designed to be a complete aid tool for discretionary traders to find and analyze charts from powerful candle patterns.

Recognized Patterns:

Hammer

Shooting star

Bearish Engulfing

Bullish Engulfing

Doji

Marubozu


Scanner

Imagine if you could look at all the market assets in all timeframes looking for candlestick signals.

推荐产品
Candlestick Pattern Teller
Flavio Javier Jarabeck
5 (1)
Minions Labs' Candlestick Pattern Teller It shows on your chart the names of the famous Candlesticks Patterns formations as soon as they are created and confirmed. No repainting. That way beginners and also professional traders who have difficulties in visually identifying candlestick patterns will have their analysis in a much easier format. Did you know that in general there are 3 types of individuals: Visual, Auditory, and Kinesthetic? Don't be ashamed if you cannot easily recognize Candlest
The Candlestick Patterns indicator for MT5 includes 12 types of candlestick signales in only one indicator. - DoubleTopsAndBottoms - SmallerGettingBars - BiggerGettingBars - ThreeBarsPlay - TwoBarsStrike - Hammers - InsideBars - OutsideBars - LongCandles - TwoGreenTwoRed Candles - ThreeGreenThreeRed Candles The indicator creats a arrow above or under the signal candle and a little character inside the candle to display the type of the signal. For long candles the indicator can display the exac
CandleStick Pattern Indicator MT5
Driller Capital Management UG
5 (2)
This is a simple Candle Stick Pattern Indicator, which shows in the current time period all standardisized Patterns in the chart. All Patterns will be calculatet automatically based on standard conditions. Following Candle Stick Patterns are included: Bullish Hammer | Bearish Hammer Bullish Inverted Hammer | Bearish Inverted Hammer Bullish Engulfing | Bearish Engulfing Piercing | Dark Cloud Cover Bullish 3 Inside | Bearish 3 Inside There are only a few settings at the begining to take. Every Pat
FREE
Three Inside Up GA
Osama Echchakery
The   Three Inside Up   candlestick pattern is formed by three candles. Here’s how to identify the Three Inside Up candlestick pattern: The first candle must be bearish The second candle must be bullish The close of the second candle should ideally be above the 50% level of the body of the first one The third candle should close above the first one This 3-candle bullish candlestick pattern is a reversal pattern, meaning that it’s used to find bottoms. For this reason, we want to see this pattern
Candlestick Patterns MT5  is a simple and convenient indicator able to define 29 candle patterns. Advantages Defines and highlights 29 candle patterns; Estimated trading direction is shown as an arrow; Each candlestick pattern can be disabled in the settings; The indicator can be used as an arrow indicator in EAs. Parameters TextSize  - chart text size; TextColor  - chart text color; Alert  - enable/disable alerts; ---------- Candlestick Patterns -------------  - settings separator; AdvanceB
50+ Candlestick Patterns, Simulated Trading Results, Top Five Performers Candle Analysis extends Candlesticks Pattern Analysis by not only identifying Patterns but also recording the Past Performance of the Patterns. What it Does:- Identifies and plots results on chart Displays Top Patterns for both Bullish and Bearish type.  Log can be printed in experts tab to see Simulated Trading results Displays All or Selected Patterns Alerts on Pattern formation More detailed information in   Blog
This indicator accurately identifies and informs market reversals and continuation patterns by analyzing and signaling the Three White Soldiers / Three Black Crows pattern. It also offers a  "real-time backtesting"  panel in the indicator itself in a way that every change made on the indicator parameters will immediately show the user how many signals are occurred, how many take profits and stop losses were hit and, by having these informations, the Win Rate and the Profit Factor of the setup b
Candle Formula
Sergei Kiriakov
Indicator for research and finding candle bars patterns real time. Options: Alerts - Enabling alerts Push - Enable push notifications BarInd - On which bar to look for patterns for notifications (1 - formed, 0 - forming) ID - Identifier. Appended to the names of graphic objects and to the message Formula - Formula. In the bar price formula: open1, high1, low1, close1, etc. (open0, high25... any number, 0 is also possible - low0, open0...). Counting bars from right to left from zero. You can use
PZ Sandwich Bars MT5
PZ TRADING SLU
5 (2)
This indicator detects Sandwich Bars of several ranges, an extremely reliable breakout pattern. A sandwich setup consists on a single bar that engulfs several past bars, breaking and rejecting the complete price range. [ Installation Guide | Update Guide | Troubleshooting | FAQ | All Products ] Easy and effective usage Customizable bar ranges Customizable color selections The indicator implements visual/mail/push/sound alerts The indicator does not repaint or backpaint The indicator could not b
FREE
Price Action Full
Bogdan Kupinsky
This indicator looks for 3 rather strong patterns: Spinning Top pattern Hammer or Hanging Man Inverted Hammer or Shooting Star These patterns may indicate a trend continuation or its reversal, depending on the location of the patterns. Input parameters Zero - consider candles without a body Multiplier for hammerhigh - multiplier for the larger shadow of the Hammer Multiplier for hammerlow - multiplier for the smaller shadow of the Hammer Multiplier for wolf - multiplier for the shadows of the
Volume Doji
Ricardo Almeida Branco
Hey guys. This indicator will show you, in the volume histogram, if the candle was a Doji, a bullish candle, or a bearish candle. The construction of this indicator was requested by a trader who uses other indicators from my catalog, and I decided to release it free to help traders who think that the indicator can contribute to their operations. The parameters are: Volume Type: Real Volume or Tick Volume. Color if the candle is bearish: select the color. Color if the candle is high:
FREE
LevelPAttern MT5 is a technical indicator based on the daily levels and Price Action patterns. The indicator is based on the standard ZigZag indicator + reversal candlestick pattens, such as Star, Hammer (also knows as Pin bar), Engulfing and others. The indicator generates audio and text notifications when a pattern is formed and a level is touched. It also supports sending email and push notifications. Indicator operation features It is suitable for working with any CFD and FOREX trading ins
KT Inside Bar MT5
KEENBASE SOFTWARE SOLUTIONS
KT Inside Bar plots the famous inside bar pattern in which the bar carries a lower high and higher low compared to the previous bar. The last bar is also known as the mother bar. On smaller time-frames, the inside bar sometimes appears similar to a triangle pattern. Features Also plots entry, stop-loss, and take-profit levels with the inside bar pattern. No complex inputs and settings. Erase unwanted levels when the price reaches the entry line in either direction. All Metatrader alerts incl
Dragonfly Doji GA
Osama Echchakery
The Dragonfly Doji candlestick pattern is formed by one single candle. Here’s how to identify the Dragonfly Doji candlestick pattern: The candle has no body The wick at the bottom must be big At the top, it should have no wick, or be very small This 1-candle bullish candlestick pattern is a reversal pattern, meaning that it’s used to find bottoms. For this reason, we want to see this pattern after a move to the downside, showing that bulls are starting to take control. When a Dragonfly Doji cand
A machine translation from the English product description was used. We apologize for possible imprecisions. 使用了英文 产 品描述的机器翻 译。 我 们对可能的不准确表示歉意 。 最喜 欢的烛台价格行为模式的可视化系统 。 附加后,指 标将自动在图表上标记下一个模式 : 匹 诺曹酒吧  - 带有长 “ 鼻子 ” 的小型条形杆,非常著名的反向模式; 内柱  -  一个柱,其范 围位于前一个柱的范围内。   它代表市 场的不确定性 ; 外柱  -  其范 围超出前一个柱的范围的柱。   它代表市 场的不确定性 ; 导轨图案  - 两个随之而来的 对立柱,具有几乎相等的、较大的实体。 反向模式, 实际上与更高时间框架的匹诺曹柱线模式相吻合 ; 主蜡 烛形态  -  蜡 烛的第五根,其中四个后续蜡烛的范围 在第五根蜡 烛的范围内   -   主蜡 烛。   这种模式代表市场整合,尤其是在较短的时间范围内 。 差距  -  后 续柱的收盘价和开盘价之间的差距,不应忽视 。 该指标的开发考
ACPD – «Auto Candlestick Patterns Detected» - The indicator for automatic detection of candlestick patterns. The Indicator of Candlestick Patterns ACPD is Capable of: Determining 40 reversal candlestick patterns . Each signal is displayed with an arrow, direction of the arrow indicates the forecast direction of movement of the chart. Each caption of a pattern indicates: its name , the strength of the "S" signal (calculated in percentage terms using an empirical formula) that shows how close is t
这   看涨吞噬烛台形态   由两根蜡烛组成。 识别看涨吞噬烛台形态的方法如下: 第一根蜡烛必须是看跌的 第二根蜡烛必须是看涨的 第二根蜡烛的主体必须覆盖第一根蜡烛的主体 这种 2 根蜡烛看涨蜡烛图形态是一种反转形态,也就是说,它用于寻找底部。 因此,我们希望在价格下跌后看到这种形态,表明多头开始占据主导地位。 当看涨吞噬烛台形态出现在正确位置时,它可能会显示: 下降趋势的结束和上升趋势的开始 回调结束,恢复上升趋势 $38   (剩余 1 份) 下一价格 $138 EA Hammer GA 适用于各种符号:货币对、指数、金属、商品、加密货币等。 Guardian Angel EAs 频道:   点击此处 当您购买 GA EA 时,您可以获得我的任何其他 GA 专家作为奖励。 *(通过邮件从交易终端绑定名称,而不是通过 MQL,包含所有未来更新)-> 欲了解详情,请     通过 MQL 联系我   或电邮 订单完成后,     如果您想添加自定义过滤器,请告诉我。     或者,     删除过滤器可以加快您的 EA 测试。 最低要求和建议 经纪商:任何具有低点差的经纪商。 最低
Mosaic Candle Pattern Finder
Francisco De Biaso Neto
An indicator for finding patterns of candles. Through this indicator it is possible to recognize several patterns of candlesticks: hammer, inverted hammer, doji, maximum swallow, minimum swallow and inside bar. The patterns can be found by modifying the values of the indicator parameters. In this way it becomes possible to recognize an infinity of patterns. How to use: Add the indicator to the chart. Parameters: [doji -> max body size] represents the maximum body size of the doji (difference
My Candle
Francisco Gomes Da Silva
定义您自己的烛台图案,当该图案出现时,该指标将显示在屏幕上 您可以在 Strategy Tester 中免费测试它,看看您的 K 线形态在您选择的资产上出现了多少次 你也可以画你的图案的所有蜡烛或只画一个 该指标对烛台分析很有用,可用于价格行为和裸交易策略。 它是一个指示器,显示您选择的运动 dìngyì nín zìjǐ de zhútái tú'àn, dāng gāi tú'àn chūxiàn shí, gāi zhǐbiāo jiāng xiǎnshì zài píngmù shàng nín kěyǐ zài Strategy Tester zhōng miǎnfèi cèshì tā, kàn kàn nín de K xiàn xíngtài zài nín xuǎnzé de zīchǎn shàng chūxiànle duōshǎo cì nǐ yě kěyǐ huà nǐ de tú'àn de suǒyǒu làzhú huò zhǐ huà yīgè gāi zhǐbiāo duì zhútái fēnxī hěn yǒuyòng, kěyòng y
该指标最多绘制 6 个级别,可以根据交易者的要求启用/禁用以使图表更清晰 这 6 个级别分为 2 组:高和低 对于每组,可以选择不同的时间范围 它基于先前高低反转的策略,因为它认为当价格达到每日、每周或每月高低时,价格通常会在更小的时间范围内(如 5 分钟)显示拒绝 特征 : - 在单个图表中跟踪多达 6 个时间帧高低点 - 在这些级别设置警报,邮件、推送或终端警报,当价格触及这些级别时,您将立即收到警报 - 自定义关卡样式,包括线条样式、宽度、颜色等 - 班次:想要跟踪或研究第 2 天或第 3 天的高低?您可以将 shift 设置为 2 用于 2nd Bar 的 High Low 或 3 设置为 3rd Bar 的 High Low 等等。 该指标最多绘制 6 个级别,可以根据交易者的要求启用/禁用以使图表更清晰 这 6 个级别分为 2 组:高和低 对于每组,可以选择不同的时间范围 它基于先前高低反转的策略,因为它认为当价格达到每日、每周或每月高低时,价格通常会在更小的时间范围内(如 5 分钟)显示拒绝 特征 : - 在单个图
An “inside bar” pattern is a two-bar price action trading strategy in which the inside bar is smaller and within the high to low range of the prior bar, i.e. the high is lower than the previous bar’s high, and the low is higher than the previous bar’s low. Its relative position can be at the top, the middle or the bottom of the prior bar. The prior bar, the bar before the inside bar, is often referred to as the “mother bar”. You will sometimes see an inside bar referred to as an “ib” and its
FREE
Soldiers Crows
Alexey Topounov
5 (1)
The indicator displays the "Three white soldiers and Three black crows" candlestick model on a chart. Three white soldiers are color in blue. Three black crows are colored in red. Input parameters: Max Bars - maximum number of bars calculated on the chart. Make Signal Alert - use alert. Type of pattern rules - use a strict model of determining the pattern (short lower shadows for the three soldiers, short upper shadows for the three crows), or a simplified model. Max Shadow Ratio - coefficient o
这个多时间框架和多品种指标识别高概率的突破模式。它通过识别强大的、对称的三角旗和三角形来做到这一点。这个图案   在更高的时间范围内 不会经常出现。 但是当它发生时,这是一个非常高概率的设置。该指标还包括一个内柱扫描仪。例如,它可用于检测由主蜡烛 (MC) 和 4 个内部蜡烛形成的特殊类型的内线形态(请参阅下面的策略说明)。   可在此处 找到此策略的单独指标。结合您自己的规则和技术,该指标将允许您创建(或增强)您自己的强大系统。 特征 可以同时监控您的市场报价窗口中可见的所有交易品种。仅将指标应用于一张图表并立即监控整个市场。 可以监控从 M1 到 MN 的每个时间范围,并在识别出三角旗、三角形或内部柱形时向您发送实时警报,     或者当地层发生突破时。支持所有 Metatrader 原生警报类型。 该指示器包括一个交互式面板。请参阅下面的屏幕截图#4。 可以配置为显示买入/卖出线和 TP/SL 线(基于 ATR 乘数)。这些线将显示在您通过单击面板中的信号打开的图表上。请参阅下面的屏幕截图 #5。 指标可以将信号写入一个文件,EA 可以使用该文件进行自动交易。比如 这个产品 。
Japan CandleStick Patterns
Nguyen Duc Quy
4.33 (6)
Japanese candlestick analysis has been in existence for hundreds of years and is a valid form of technical analysis. Candlestick charting has its roots in the militaristic culture that was prevalent in Japan in the 1700s. One sees many terms throughout the Japanese literature on this topic that reference military analogies, such as the Three White Soldiers pattern Unlike more conventional charting methods, candlestick charting gives a deeper look into the mind-set of investors, helping to establ
FREE
Supply Demand Ranger
Krzysztof Janusz Stankiewic
5 (2)
The indicator draws supply and demand zones. The zone timeframe can be set independently of the chart timeframe. For instance, it is possible to set M5 zones on an H4 chart. The importance of zones can be adjusted using the zone strength parameter. Demand zones are displayed if at least one candle in the range of the zone is entirely above the zone. Similarly, supply zones are displayed if at least one candle within the zone is entirely below the zone.
TheStrat Patterns MT5
Robert Gerald Wood
This indicator will draw patterns based on   Rob Smith's   The Strat   as they emerge in real time on your chart. As price evolves,   TheStrat   offers 18 distinct price action patterns that can help you get good entries in the market. Each pattern involves two or three candles, and this indicator will draw a bounding box around the candles and name the pattern. The indicator also shows when a potential setup is forming, known by stratters as an Actionable signal. Candles Each candle is de
Pips On Candles
Giuseppe Nittoli
Pips on Candles shows the number of pips involved in each candle on the chart. It is possible to set 3 different ranges for counting on each single candle via the RangeType parameter: With "HighLow" you count the pips present between the minimum and the maximum. The number is shown under each candlestick on the chart. With "OpenClose" you count the pips present between the opening and closing price of the candle. The number is shown under each candlestick on the chart. With "HighDistAndLowDist"
ZigZag with Fibonacci
Rafael Caetano Pinto
This indicator uses the metaquotes ZigZag indicator as base to plot fibonacci extension and fibonacci retracement based in the Elliot waves. A fibonacci retracement will be plotted on every wave draw by the ZigZag. A fibonacci extension will be plotted only after the 2nd wave. Both fibonacci will be updated over the same wave tendency. Supporting until 9 consecutive elliot waves. Parameters: Depth: How much the algorithm will iterate to find the lowest and highest candles Deviation: Amoun
Chaikin Money Flow
Jose Miguel Soriano
This indicator incorporates the volume to inform the market trend. A warning system (chart, SMS and e-mail) is incorporated for warning when a certain level is exceeded. Developed by Marc Chaikin, Chaikin Money Flow (CMF) measures the amount of Money Flow Volume (MFV) over a specific period. Money Flow Volume forms the basis for the Accumulation Distribution Line. Instead of a cumulative total of Money Flow Volume, Chaikin Money Flow simply sums Money Flow Volume for a specific look-back period.
Basing Candles
Abdelkhabir Yassine Alaoui
Basing Candles indicator is an automatic indicator that detects and marks basing candles on the chart. A basing candle is a candle with body length less than 50% of its high-low range. A basing candle or basing candlestick is a trading indicator whose body length is less than half of its range between the highs and lows. That's less than 50% of its range. The indicator highlights the basing candles using custom candles directly in the main chart of the platform. The percentage criterion can be
FREE
该产品的买家也购买
Atomic Analyst MT5
Issam Kassas
5 (14)
首先值得强调的是,该交易指标是非重绘、非延迟的指标,这使其成为手动和机器人交易的理想选择。 用户手册:设置、输入和策略。 Atomic Analyst是一种PA价格行动指标,利用价格的力量和动量来寻找市场上更好的机会。配备了高级过滤器,可帮助去除噪音和假信号,并提高交易潜力。使用多层复杂的指标,Atomic Analyst扫描图表,并将复杂的数学计算转化为任何初学者都能理解并用来做出一致交易决策的简单信号和颜色。 “Atomic Analyst”是专为新手和经验丰富的交易者量身定制的综合交易解决方案。它将高级指标和一流功能融合为一体的交易策略,使其成为所有类型交易者的多功能选择。 日内交易和剥头皮策略:专为快速准确的日内交易和短期交易而设计。 日内和摆动交易策略:可用作追求价格大幅波动的日内和摆动交易者的可靠工具。 多货币和市场:凭借其可靠的精度,在不同的工具和市场上运作。 多个时间框架:可在多个时间框架上使用,性能良好。 稳定性:所有指标均不重绘、不重绘和不滞后,确保可靠的信号。 信号清晰度:提供箭头信号,用于清晰的入场和出场点。 实时警报:通过交易入场、SL和TP警报通知交
首先,值得强调的是,这个交易系统是一个非重绘、非重画和非滞后的指标,这使得它非常适合手动和机器人交易。 在线课程,手册和下载预设。 “智能趋势交易系统 MT5”是专为新手和经验丰富的交易者量身定制的综合交易解决方案。它结合了超过 10 个优质指标,具有 7 多个强大的交易策略,使其成为适用于各种市场条件的多功能选择。 趋势跟随策略:提供精确的入场和止损管理,以有效地跟随趋势。 反转策略:识别潜在的趋势反转,使交易者能够利用区域市场的机会。 剃头策略:专为快速准确的日内交易和短期交易而设计。 稳定性:所有指标都不会重绘、不会重画和不会滞后,确保可靠的信号。 定制:支持自定义策略,以满足个人交易偏好。超过 7 种策略和组合可帮助您找到最佳策略。 信号清晰度:提供箭头信号,以指示清晰的入场和退出点。 实时警报:通过交易进出警报使交易者保持了解。 深入分析:提供更高时间框架的趋势分析和实时交易监控。 自适应颜色编码:利用蜡烛颜色编码来显示成交量、趋势和反转蜡烛信号。通过蜡烛颜色分析市场方向。 “智能趋势交易系统 MT5”赋予交易者必要的工具,以便在各种市场条件下做出明智和战略性的交易决策。无论
Quantum Trend Sniper
Bogdan Ion Puscasu
4.91 (43)
介绍   量子趋势狙击指标 ,突破性的 MQL5 指标,正在改变您识别和交易趋势反转的方式!由拥有超过13年交易经验的资深交易员团队开发,     量子趋势狙击指标   旨在通过其创新的方式以极高的准确度识别趋势反转,将您的交易之旅推向新的高度。 ***购买量子趋势狙击指标,即可免费获得量子突破指标!*** 当量子突破指标识别出趋势反转时,它会向您发出警报和信号箭头,并建议您三个止盈水平。 它既适合新手交易者,也适合专业交易者。 量子 EA 通道:       点击这里 MT4版本:       点击这里 建议: 时间范围: 所有时间范围。为了获得最佳结果,我们建议在 M15、M30 和 H1 时间范围内使用它。 货币对:欧元兑美元、英镑兑美元、澳元兑美元、欧元兑英镑、, EURAUD,  XAUUSD 账户类型:ECN、Raw 或 Razor,点差极低 经纪时间:任意 经纪商:IC Markets、Pepperstone with Raw 和 Razor 的点差最低 建议止损:50 点 建议止盈水平:20 点、50 点和
FX Power MT5 NG
Daniel Stein
5 (5)
通过 mql5 和 Telegram 上 的晨间简报获取每日市场更新,包括详细信息和屏幕截图 ! FX Power MT5 NG 是我们长期以来非常受欢迎的货币强度计算器 FX Power 的下一代产品。 这款下一代强度计算器能提供什么?您所喜爱的原版 FX Power 的所有功能 附加功能 黄金/XAU 强度分析 更精确的计算结果 可单独配置的分析周期 可自定义计算限制,以获得更好的性能 为希望查看更多信息的用户提供特殊的多实例设置 无尽的图形设置,可在每个图表中设置您最喜欢的颜色 无数的通知选项,让您再也不会错过任何重要信息 采用 Windows 11 和 macOS 风格的全新圆角设计 神奇的移动指标面板 FX Power 主要功能 所有主要货币的完整强势历史 所有时间框架内的货币强弱历史 所有经纪商和图表的计算结果完全相同 100% 可靠的实时计算 -> 无重绘 可通过下拉列表选择分析时段 通过自定义模式单独配置分析时段 可在一个图表中使用多个实例 可移动 FX Power 显示屏(通过拖放) 适用于高分辨率 QHD、UHD 和 4K 显示器 自动终端配置 针对平板电脑
TPSpro RFI Levels MT5
Roman Podpora
5 (8)
Reversal First Impulse levels (RFI)      INSTRUCTIONS        RUS       -       ENG              R ecommended to use with an indicator   -   TREND PRO -  Version MT4                 A key element in trading is zones or levels from which decisions to buy or sell a trading instrument are made. Despite attempts by major players to conceal their presence in the market, they inevitably leave traces. Our task was to learn how to identify these traces and interpret them correctly. Main functions:: Di
Trend Screener Pro MT5
STE S.S.COMPANY
4.88 (64)
使用趋势筛选指标释放趋势交易的力量:由模糊逻辑和多货币系统提供支持的终极趋势交易解决方案! 使用趋势筛选器(由模糊逻辑提供支持的革命性趋势指标)提升您的趋势交易。 它是一个强大的趋势跟踪指标,结合了超过 13 种高级工具和功能以及 3 种交易策略,使其成为使您的 Metatrader 成为趋势分析器的多功能选择。 限时优惠:趋势筛选指标终身仅需 50 美元。 ( 原价 125$ ) (优惠延长) 体验趋势筛选器 100% 无需重新绘制的准确性,确保您的交易决策不受过去价格变化的影响。 释放多时间框架和多货币功能的多功能性,使您能够以无与伦比的信心在外汇、商品、加密货币和指数领域进行交易。 利用 Trend Screener 的综合策略套件增强您的交易: - 趋势跟踪策略和趋势延续策略 :趋势筛选器的趋势跟踪策略提供清晰的趋势延续信号,让您有效捕捉趋势走势并管理风险。 - 反转策略和早期入场点策略 :趋势筛选器的反转策略可检测市场方向的潜在变化,使您能够预测趋势反转并利用疲弱的市场趋势。通过早期入场点,您可以在潜在的趋势变化之前定位自己 获取可观的利润。 - 倒卖策略: 趋势筛选器的倒卖
首先,值得强调的是,这个交易工具是非重绘、非重画和非滞后的指标,非常适合专业交易。 在线课程,用户手册和演示。 智能价格行动概念指标是一个非常强大的工具,既适用于新手,也适用于经验丰富的交易者。它将超过20个有用的指标合并到一个指标中,结合了高级交易思想,如内圈交易员分析和智能资金概念交易策略。该指标侧重于智能资金概念,提供有关大型机构交易方式的见解,帮助预测它们的动向。 它在流动性分析方面尤其擅长,有助于理解机构的交易方式。它擅长预测市场趋势,并仔细分析价格波动。通过将您的交易与机构策略对齐,您可以更准确地预测市场走向。该指标多才多艺,擅长分析市场结构,识别重要的订单区块,并识别各种模式。 它擅长识别BOS和CHoCH等模式,理解动量的转变,并突出显示供需强劲的关键区域。它还擅长发现强大的不平衡,并分析价格创造更高高点或更低低点的模式。如果您使用斐波那契回撤工具,该指标可以满足您的需求。它还可以识别相等的高点和低点,分析不同的时间框架,并通过仪表板显示数据。 对于使用更高级策略的交易者,该指标提供了工具,如公平价值差指标和优惠和折扣区域的识别。它特别关注高时间框架订单
FX Volume MT5
Daniel Stein
4.94 (17)
通过 mql5 和 Telegram 上 的 " 晨间简报 "获取每日市场更新,包括详细信息和屏幕截图 ! 外汇交易量(FX Volume)是第一个也是唯一一个从经纪商角度真正洞察市场情绪的交易量指标。 直接在您的图表上看到这些信息是真正改变游戏规则和突破性的交易解决方案。 受益于独特的市场数据洞察,如 比率(Ratios )显示货币多头和空头头寸的比率(百分比 比率变化 显示所选时间段内的多头比率及其百分比变化 总交易量 显示货币的总交易量(多头和空头),以手为单位 多头 交易量显示货币所有多头头寸的交易量 空头 交易量显示所有货币空头头寸的交易量 净多头 显示净多头交易量,即所有多头头寸减去所有空头头寸(以手为单位)。 净多头百分比 显示货币净多头交易量的变化 请阅读我们的基本教程 -> "如何使用外汇交易量进行交易 " 获取更多信息,如常见问题、交易技巧和教程视频,请访问我们的 外汇交易量公共信息频道 请 安装并运行 SI Connect 以建立与我们数据中心的持续连接 背景信息 我们都知道,外汇是一个分散的市场。这就是为什么我们必须打破常规思维,开发一个独
Entry Points Pro for MT5
Yury Orlov
4.55 (159)
这款指标用于 MT5,可提供准确的入场交易信号,且无重绘。 它可应用在任何金融资产:外汇、加密货币、贵金属、股票、指数。 它将提供极其精准的评估,并告诉您何时开仓和平仓的最佳时机。 观看 视频 (6:22),其中包含一个仅处理单一信号的示例,该信号即可值回指标购价! 大多数交易者在 Entry Points Pro 指标的帮助下,在第一个交易周内即改善了他们的交易结果。 订阅我们的 Telegram 群 ! Entry Points Pro 指标的益处。 入场信号无重绘 如果信号出现,并得到确认,则它不会再消失;不像是重绘指标,它会导致重大的财产损失,因为它们可以在显示信号后再将其删除。 无差错开仓 指标算法可令您找到入场交易(买入或卖出资产)的理想时机,从而提高每位交易者的成功率。 Entry Points Pro 可操作任何资产 它允许您在 MT5 平台上交易任何经纪商的加密货币、股票、贵金属、指数、大宗商品和货币。 提供任何方向的信号 Entry Points Pro 指标提供针对任意价格走势的入场交易信号 - 上涨、下跌或横盘(横向)。
FxaccurateLS
Shiv Raj Kumawat
WHY IS OUR FXACCCURATE LS MT5 THE PROFITABLE ? PROTECT YOUR CAPITAL WITH RISK MANAGEMENT Gives entry, stop and target levels from time to time. It finds Trading opportunities by analyzing what the price is doing during established trends. POWERFUL INDICATOR FOR A RELIABLE STRATEGIES We have made these indicators with a lot of years of hard work. It is made at a very advanced level. Established trends provide dozens of trading opportunities, but most trend indicators completely ignore them!
AW Trend Predictor MT5
AW Trading Software Limited
4.78 (58)
一个系统中趋势和故障水平的组合。先进的指标算法过滤市场噪音,确定趋势、进入点以及可能的退出水平。指标信号记录在统计模块中,您可以选择最合适的工具,显示信号历史的有效性。该指标计算获利和止损标记。 手册和说明 ->   这里 / MT4 版本 ->   这里 如何使用指标进行交易: 使用趋势预测器进行交易只需三个简单的步骤: 第 1 步 - 开仓 收到买入信号,成功率超过 70% 第 2 步 - 确定止损 通过相反的信号选择中继线 第 3 步 - 定义止盈策略 策略一:达到 TP1 时平仓 策略 2:达到 TP1 时平仓 50%,达到 TP2 时平仓剩余 50% 策略三:在趋势反转时平仓 好处: 从不重绘结果,信号严格位于蜡烛收盘时 它可以在顾问中使用 获利和止损标记 对交易策略或独立策略的重要补充 市场噪音过滤算法 适用于任何工具 统计模块: 为了更好地选择配对,请使用内置的统计计算。 计算交易 - 给出统计数据的信号总数 成功评级 - 达到 TP1 的信号百分比,或反转那些正获利的信号时的百分比 TakeProfit1 Hit - 达到 TP1 的信号百分比 TakeProfit2
ICT, SMC, SMART MONEY CONCEPTS, SMART MONEY, Smart Money Concept, Support and Resistance, Trend Analysis, Price Action, Market Structure, Order Blocks, BOS/CHoCH,   Breaker Blocks ,  Momentum Shift,   Supply&Demand Zone/Order Blocks , Strong Imbalance,   HH/LL/HL/LH,    Fair Value Gap, FVG,  Premium  &   Discount   Zones, Fibonacci Retracement, OTE, Buy Side Liquidity, Sell Side Liquidity, BSL/SSL Taken, Equal Highs & Lows, MTF Dashboard, Multiple Time Frame, BigBar, HTF OB, HTF Market Structure
Bill Williams Advanced
Siarhei Vashchylka
5 (5)
Bill Williams Advanced is designed for automatic chart analysis using Bill Williams' "Profitunity" system. The indicator analyzes four timeframes at once. Manual (Be sure to read before purchasing) Advantages 1. Automatically analyzes the chart using the "Profitunity" system of Bill Williams. The found signals are placed in a table in the corner of the screen. 2. Equipped with a trend filter based on the Alligator indicator. Most of the system signals are recommended to be used only accordi
成為突破者,隨著價格反轉,市場結構會改變利潤。 訂單突破者指示器可以識別趨勢或價格走勢何時接近枯竭並準備好逆轉。它會提醒您市場結構的變化,通常會在發生逆轉或重大回調時發生。 該指標使用專有計算來確定突破和價格動能。每當在可能的耗盡點附近形成新的高點時,指標就會繪製最後一個生成該高點的順序塊。然後,它將隨價格移動隨價格跟隨定單。然後,當價格轉向相反方向並突破該訂單塊時,它會提醒您,從而創建新的市場結構並開始趨勢或重大回調的可能逆轉。 訂單塊是在創建高/低之前的最後一個相反的彩色蠟燭,並且當價格跌破這些關鍵區域以下時,這表明趨勢可能會發生短期或長期反轉。 特徵 提醒您關鍵耗盡點的市場結構變化 價格接近耗盡水平時自動提取訂單塊 在一個方向繼續移動時,在價格後面跟踪定單,以提醒您最佳的反轉輸入 將顏色更改為純色塊,以顯示何時發生市場結構中斷。 適用於所有交易品種和時間範圍 內置集成的彈出窗口和電子郵件警報 策略和如何與定單破壞者指標進行交易 當斷路器塊發生時,您有兩個選擇。 看左邊!我們正在尋求供應/需求或支撐/阻力位嗎?市場結構轉變(逆轉)通常發生在價格重新測試舊水平或
Volume by Price MT5
Brian Collard
5 (4)
The Volume by Price Indicator for MetaTrader 5 features Volume Profile and Market Profile TPO (Time Price Opportunity). Volume and TPO histogram bar and line charts. Volume Footprint charts. TPO letter and block marker collapsed and split structure charts. Session filtering and grouping. Static, dynamic and flexible range segmentation and compositing methods with relative and absolute visualizations. Graphical layering, positioning and styling options to suit the user's analytic and aesthetic n
Easy Buy Sell Signal Alert
Franck Martin
4.86 (7)
Easy By Sell is a market indicator for opening and closing positions. It becomes easy to track market entries with alerts. It indicates trend reversal points when a price reaches extreme values ​​and the most favorable time to enter the market. it is as effective as a Fibonacci to find a level but it uses different tools such as an algorithm based on ATR indicators and Stochastic Oscillator. You can modify these two parameters as you wish to adapt the settings to the desired period. My othe
Legacy of Gann for MT5
Pavel Zamoshnikov
5 (6)
The indicator very accurately determines the levels of the possible end of the trend and profit fixing. The method of determining levels is based on the ideas of W.D.Gann, using an algorithm developed by his follower Kirill Borovsky. Extremely high reliability of reaching levels (according to K. Borovsky  - 80-90%) Indispensable for any trading strategy – every trader needs to determine the exit point from the market! Precisely determines targets on any timeframes and any instruments (forex, met
"Piranha" - an autonomous trading system that determines overbought and oversold levels on the chart. Red and blue zones represent overbought and oversold levels respectively. Entry points are marked with arrows: a downward arrow in the red zone for "sell" and an upward arrow in the blue zone for "buy". The Take profit level is indicated by the green moving average. Key features: Adjusting the Take profit level as the green moving average changes position. Averaging ability when a new market e
Quantum Heiken Ashi PRO MT5
Bogdan Ion Puscasu
4.5 (8)
Quantum Heiken Ashi PRO 简介 Heiken Ashi 蜡烛旨在提供对市场趋势的清晰洞察,以其过滤噪音和消除虚假信号的能力而闻名。告别令人困惑的价格波动,迎接更流畅、更可靠的图表表示。 Quantum Heiken Ashi PRO 的真正独特之处在于其创新公式,它将传统烛台数据转换为易于阅读的彩色条。红色和绿色条分别优雅地突出了看跌和看涨趋势,让您能够以非凡的精度发现潜在的进入和退出点。 量子 EA 通道:       点击这里 MT4版本:       点击这里 这一卓越的指标具有以下几个关键优势: 增强清晰度:通过平滑价格波动,Heiken Ashi 金条可以更清晰地反映市场趋势,使您更容易识别有利的交易机会。 减少噪音:告别经常导致错误信号的不稳定价格变动。 Quantum Heiken Ashi 指标可过滤噪音,使您能够做出更明智的交易决策 无缝集成:Heiken Ashi 指标专为 MetaTrader 开发,可无缝集成到您的交易平台中。它用户友好、高度可定制,并且与您的其他交易指标和过滤器兼容 无论您是寻求新优势的经验丰富的交易者,
Advanced Supply Demand MT5
Bernhard Schweigert
4.53 (15)
任何新手或专业交易者的最佳解决方案! 该指标是一款独特、高质量、且价格合理的交易工具,因为我们已经整合了许多专有功能和新公式。 依据此更新,您将能够显示双重时间帧区域。 您不仅可以显示一个较高的时间帧,还可以同时显示图表时间帧,加上更高的时间帧:显示嵌套时区。 供需双方所有交易者都会喜欢它。 :) 重要信息披露 高级供需的最大潜力,请访问 https://www.mql5.com/zh/blogs/post/720245   想象您的交易如何得以改善,是因为您能够精准定位入场或目标位吗? 构建于新的底层算法,它可以更轻松地识别出买卖双方之间的潜在失衡。 这是因为它以图形方式展示供需最强劲区域,及其过去的表现(显示旧区域)。 这些功能旨在帮助您更轻松地发现最佳入场区域和价位。 现在您可以针对您的交易品种和时间帧来优化和编辑区域强度! 高级供需指标适用于所有产品和时间帧。 它是一个新的公式,非常新的功能是两个区域强度函数可由用户输入进行调整! 这在交易中是一大优势。 当您学习如何使用专有功能,例如带有价格游离最小 X 因子的区域强度时,您能够判断该区域强劲与否。 供需区域用作警报触发器
IX Power MT5
Daniel Stein
5 (3)
IX Power 终于将 FX Power 的无与伦比的精确性带到了非外汇交易符号中。 它能准确判断您喜爱的指数、股票、商品、ETF 甚至加密货币的短期、中期和长期趋势强度。 您可以 分析 终端提供的 一切 。试试吧,体验一下您在交易时如何把握 时机 。 IX Power 主要功能 100% 精确的非重绘计算结果 - 适用于您终端中的所有交易符号 下拉式选择预配置以及可单独配置的强度分析周期 通过电子邮件、消息和手机通知的无数种通知选项 可访问的 EA 请求缓冲区 可自定义计算限制,以获得更好的性能 为希望查看更多信息的用户提供特殊的多实例设置 无尽的图形设置,让您在每个图表中都能找到最喜欢的颜色 采用 Windows 11 和 macOS 风格的圆角新面板设计 神奇的移动指标面板,可在子窗口和主图表之间无缝移动 适用于高分辨率 QHD、UHD 和 4K 显示器,并针对平板电脑和触摸屏进行了优化 IX Power 参数 最重要的参数不言自明,但我们很快会在另一篇文章中为您提供所有 IX Power 参数的完整说明。 使用别名 "参数可为技术交易符号
ADR 反轉指標一目了然地顯示當前價格相對於其正常平均每日範圍的交易位置。當價格超過您選擇的平均範圍和高於它的水平時,您將通過彈出窗口、電子郵件或推送獲得即時警報,以便您可以快速跳入回調和反轉。該指標在圖表上在平均每日範圍極值處繪製水平線,並在這些水平之上延伸,這些水平附加了價格超過它們的數學概率。下面的更多細節...... ADR 警報儀表板補充指標並監控所有配對也可在此處獲得: https://www.mql5.com/en/market/product/66316 MT4 版本也可在此處獲得: https://www.mql5.com/en/market/product/62757 大約 60% 的時間價格在其正常的平均每日範圍 (ADR) 內交易並推高這些水平通常是價格急劇波動的指標,通常會出現回調(獲利了結)走勢。您可以通過交易從每日範圍的頂部或底部回落到最近的支撐位或阻力位來利用這些急劇波動。 收集了超過 20 年的歷史數據,以找出主要外匯對和一系列交叉盤的價格超出特定 ADR 水平的平均百分比。該數據表明價格僅在 3% 的時間內超過其 ADR 的 200%,
Gartley Hunter Multi
Siarhei Vashchylka
5 (7)
Gartley Hunter Multi - An indicator for searching for harmonic patterns simultaneously on dozens of trading instruments and on all possible timeframes. Manual (Be sure to read before purchasing) | Version for MT4 Advantages 1. Patterns: Gartley, Butterfly, Shark, Crab. Bat, Alternate Bat, Deep Crab, Cypher 2. Simultaneous search for patterns on dozens of trading instruments and on all possible timeframes 3. Search for patterns of all possible sizes. From the smallest to the largest 4. A
TPA True Price Action indicator reveals the true price action of the market makers through 100% non-repainting signals strictly at the close of a candle! TPA shows entries and re-entries, every time the bulls are definitely stronger than the bears and vice versa. Not to confuse with red/green candles. The shift of power gets confirmed at the earliest stage and is ONE exit strategy of several. There are available now two free parts of the TPA User Guide for our customers. The first "The Basics"
The 1 2 3 Pattern Scanner MT5
Reza Aghajanpour
5 (14)
** All Symbols x All Timeframes scan just by pressing scanner button ** ***Contact me after purchase to send you instructions and add you in "123 scanner group" for sharing or seeing experiences with other users. After 17 years of experience in the markets and programming, Winner indicator is ready. I would like to share with you! Introduction The 123 Pattern Scanner indicator with a special enhanced algorithm is a very repetitive common pattern finder with a high success rate . Interestingly,
Advanced Currency Strength28 MT5
Bernhard Schweigert
5 (1)
任何新手或专家交易者的最佳解决方案! 这个指标是一个独特的、高质量的、可负担得起的交易工具,因为我们纳入了一些专有的功能和一个新的公式。只需一个图表,你就可以读出28个外汇对的货币强度!想象一下,你的交易将如何得到改善,因为你的交易是在你的手中进行的。想象一下,你的交易将如何改善,因为你能够准确地确定新趋势或剥头皮机会的触发点? 用户手册:点击这里  https://www.mql5.com/en/blogs/post/697384 这是第一本,原版的! 不要买一个毫无价值的崇拜者的克隆品。 特别的 子窗口中的箭头显示强劲的货币势头GAP将指导你的交易! 当基础货币或报价货币处于超卖/超买区域(外盘斐波那契水平)时,在个人图表的主窗口中出现警告信号。 当货币力量从外围区间回落时,回撤/反转警报。 十字星模式的特别警报 可选择多个时间框架,以快速查看趋势! 货币强度线在所有的时间框架中都非常平稳,当使用较高的时间框架来识别总体趋势,然后使用较短的时间框架来确定精确的入口时,效果非常好。你可以根据自己的意愿选择任何时间框架。每个时间框架都由其自身进行了优化。 建立在
Trend Reversal Scanner MT5
Reza Aghajanpour
5 (3)
**   All Symbols   x   All Timeframes   scan just by pressing scanner button ** *** Contact me after the purchase to send you instructions and add you in "Trend Reversal group" for sharing or seeing experiences with other users. Introduction: Trendlines are the most famous technical analysis in trading . Trendlines continually form on the charts of markets across all the different timeframes providing huge opportunities for traders to jump in and profit on the action. In the other hand,  The tre
该仪表盘显示所选符号的最新可用谐波形态,因此您可以节省时间并提高效率 /  MT4 版本 。 免费指标:  Basic Harmonic Pattern 指标列 Symbol:   显示所选符号 Trend:     看涨或看跌 Pattern:    形态类型(Gartley、蝴蝶、蝙蝠、螃蟹、鲨鱼、Cypher 或 ABCD) Entry:     入口价格 SL: 止损价 TP1: 第一止盈价 TP2: 第二次获利价格 TP3: 第三次获利价格 Current price:    当前价格 Age (in bars):   最后绘制的模式的年龄 主要输入 Symbols :   从 "28 种主要货币对 "或 "选定符号 "中选择。 Selected Symbols :   希望监控的符号,用逗号分隔("EURUSD,GBPUSD,XAUUSD")。如果您的经纪商为货币对设置了后缀或前缀,您必须在以下两个参数中添加(货币对前缀或货币对后缀)。 Max Iteration:   调整模式的最大迭代次数(如果该值越小,则模式越少,性能越快;如果该值越大,则模式越多,性能
MTF Supply Demand Zones MT5
Georgios Kalomoiropoulos
下一代自动化供需区。适用于任何图表的创新算法。所有区域都是根据市场的价格行为动态创建的。 两种类型的警报 --> 1) 当价格触及区域时 2) 当新区域形成时 你不会再得到一个无用的指标。您将获得一个完整的交易策略和经过验证的结果。     新的功能:     价格触及供需区时发出警报     创建新的供应/需求区时发出警报     推送通知警报     以点为单位的区域宽度标签     关于 MTF 的又一个时间表。因此,现在您将能够看到高于当前 3 个时间帧,而不是高于当前 2 个时间帧     启用/禁用警报/区域/MTF 功能的按钮 您获得的优势:     消除交易中的情绪。     客观化您的交易条目。     通过高概率设置提高您的利润。     节省绘图区域的时间。     像专业人士一样交易金融市场。     任何市场的即时多时间框架分析。 你在图表上看到了什么?     蓝色和红色矩形是当前时间范围的供需区。     虚线
作者的更多信息
Relative Strength Levy Classic
Bruno Goncalves Mascarenhas
Classic RSL This is the classic indicator "Relative Strength Levy" (RSL), according to Dr. Robert Levy's study, called "The Relative Strength Concept of Common Stock Pricing", which was released as a hardcover book in late 60's of the last century. Key concept Use this indicator on various instruments to compare their relative strength: The resulting analysis values ​​will fluctuate around 1 The strongest instruments will have the highest RSL values ​​(above 1) and the weakest instruments
Color Trend
Bruno Goncalves Mascarenhas
Combining the best of Price Action , Directional Movement , and Divergence / Convergence analysis, the Candle Color Trend is the easy and reliable way to identify the direction of the trend. The indicator automatically paints the candles according to the premise that the upward trend is defined by prices that form a series of ascending tops and bottoms. On the other hand, the downward trend is defined by prices that form a series of descending tops and bottoms. Color Trend is certainly one
FREE
筛选:
Ruhail Ashraf Khan
630
Ruhail Ashraf Khan 2022.11.21 19:27 
 

用户没有留下任何评级信息

Valentin Butorin
4123
Valentin Butorin 2020.07.23 15:00 
 

用户没有留下任何评级信息

kayser
142
kayser 2020.04.13 20:29 
 

用户没有留下任何评级信息

回复评论