ChzhshchMACD
- 指标
- Xiaoyu Huang
- 版本: 1.0
- 激活: 10
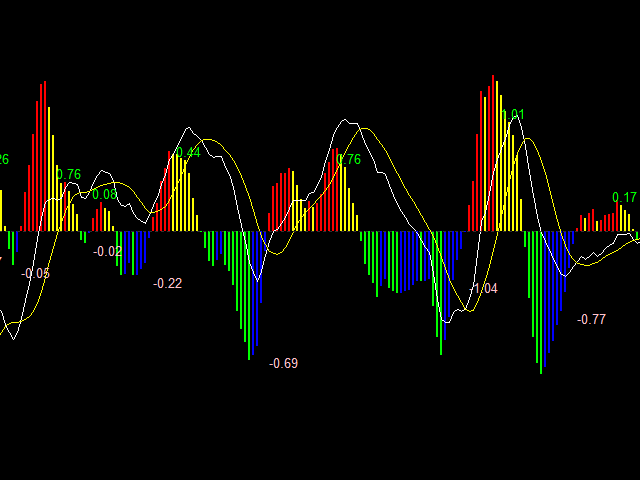
缠中说禅 MACD 指标
四色双线MACD
显示柱子的面积的和
InpFastMA=12; // Fast EMA period
InpSlowMA=26; // Slow EMA period
InpSignalMA=9; // Signal SMA period
InpAppliedPrice=PRICE_CLOSE;// Applied price
InpMaMethod=MODE_EMA; //Ma_Method
input bool ChArea= false; //chzhshch Area
Fast EMA period 快线参数
Slow EMA period 慢线参数
Signal SMA period 信号线参数
应用价格 可选
缠论里面定义的趋势力度的对比,2段趋势进行对比,对比柱子面积的和
本指标计算了相应面积的和方便对比