EvoLevels
- 指标
- Stanislav Korotky
- 版本: 1.4
- 更新: 21 十一月 2021
- 激活: 5
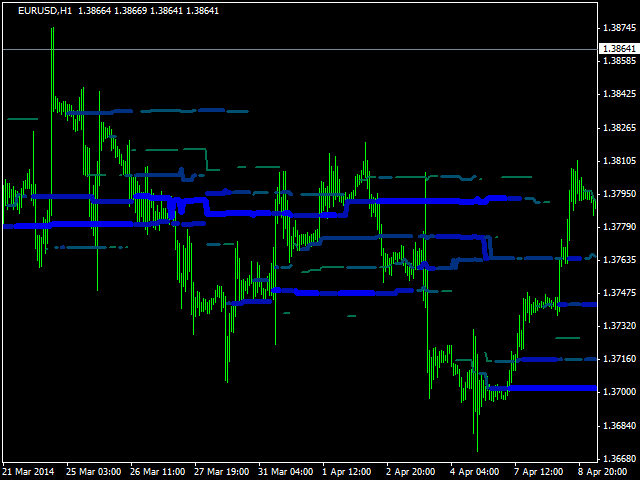
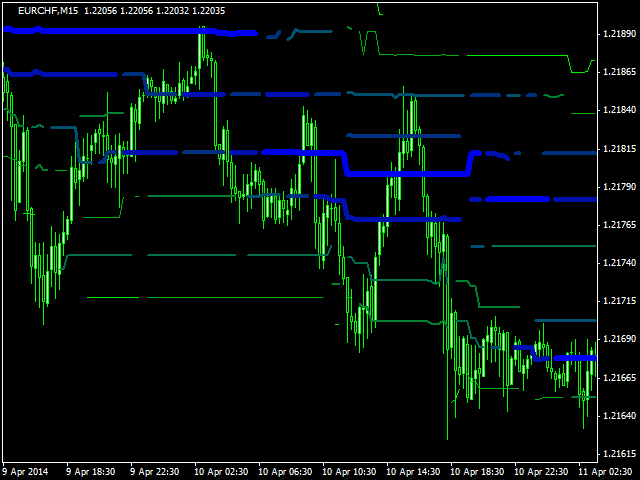
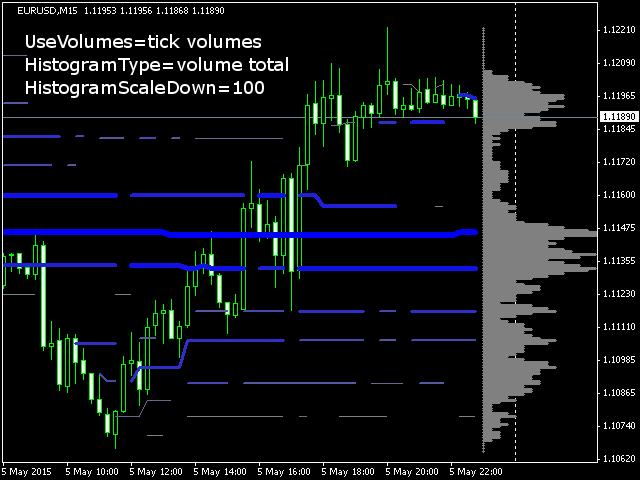
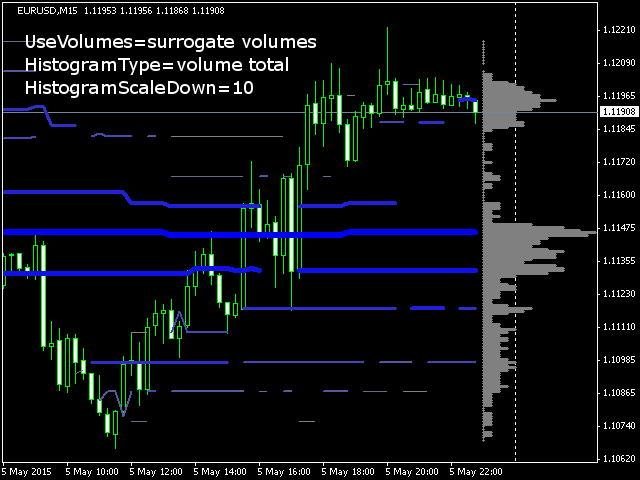
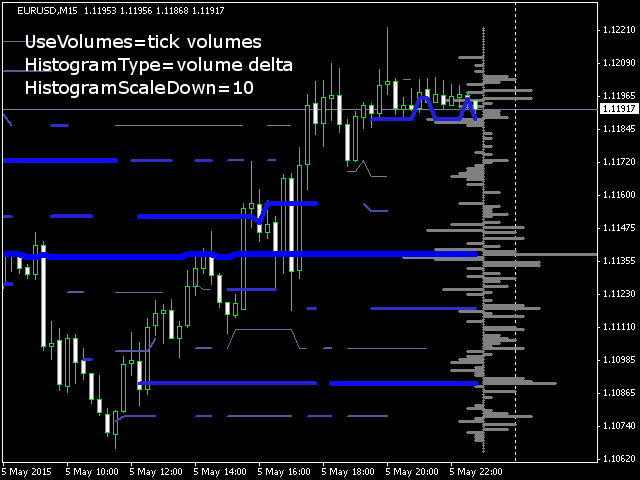
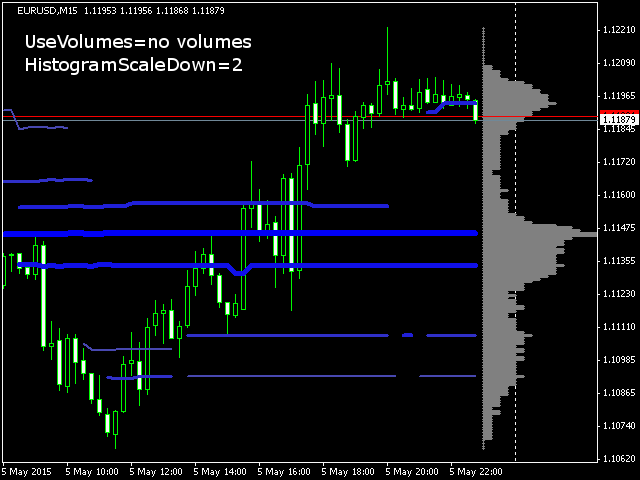
The indicator displays most prominent price levels and their changes in history. It dynamically detects regions where price movements form attractors and shows up to 8 of them. The attractors can serve as resistance or support levels and outer bounds for rates.
Parameters:
- WindowSize - number of bars in the sliding window which is used for detection of attractors; default is 100;
- MaxBar - number of bars to process (for performance optimization); default is 1000; when the indicator is called from an expert, use 1;
- Shift - number of bar to start processing from; default is 0;
- MaxLevels - number of level to detect, up to 8; default is 5;
- DeltaPoints - minimal width of each attractor in points, that is nearby levels can not be closer than DeltaPoints/2 to each other; default is 200;
- StepPoints - granularity of price values in calculations (for performance optimization); default is 10;
- CleanUp - if true (default), removes jumps between levels, when, for example, level 1 becomes level 2 (i.e. loses its power); use true for clean visualization; use false when the indicator is called from an expert;
- Color - base color for levels; default is Blue.
You should estimate which WindowSize is better suited for selected timeframe. Also change DeltaPoints as appropriate for specific work insttruments. It's recommended to have StepPoints as tenths of DeltaPoints.

