Reback
- 指标
- Yazhou Liu
- 版本: 1.1
- 更新: 18 十月 2019
- 激活: 20
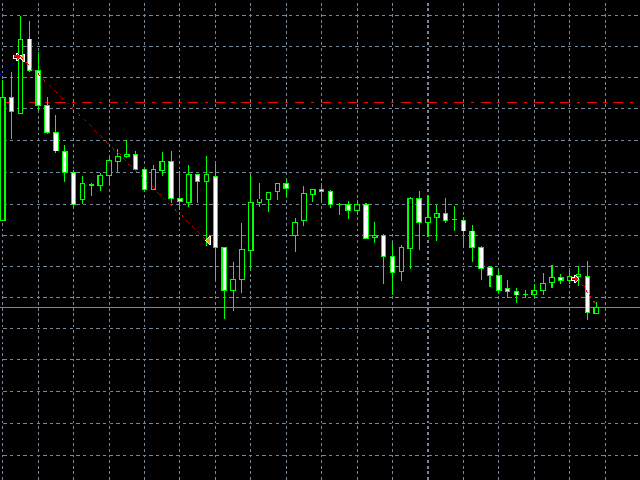
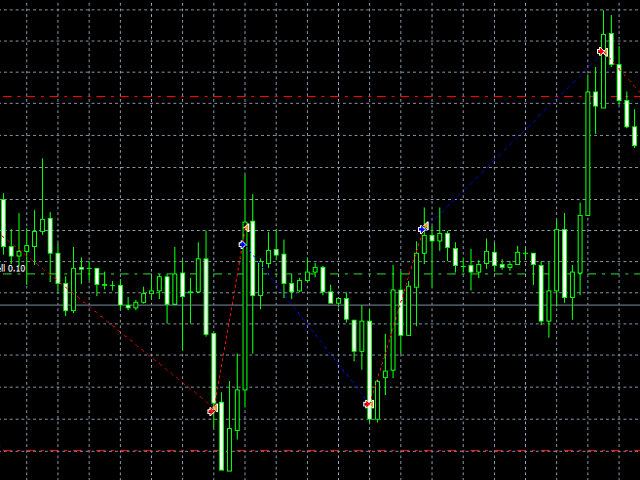
本指标可回溯历史交易,可以一目了然的看到交易位置,交易类型及盈亏情况,还有统计信息。
showlabel用于是否显示统计信息,summary_from是订单统计的开始时间,该参数以订单开仓时间为准。
回溯历史可以帮助我们纠正曾经错误的交易习惯,对于学习手动交易的新手极为重要。
本指标适用于各个时间周期,通过交易标识和划线能非常明显地看出各个订单的具体交易情况,可作为信号卖家的辅助工具使用。
即使加载到当前图标中也能实时看到当前订单的下单位置及盈亏情况。
即使加载到当前图标中也能实时看到当前订单的下单位置及盈亏情况。
本指标可回溯历史交易,可以一目了然的看到交易位置,交易类型及盈亏情况,还有统计信息。
showlabel用于是否显示统计信息,summary_from是订单统计的开始时间,该参数以订单开仓时间为准。
回溯历史可以帮助我们纠正曾经错误的交易习惯,对于学习手动交易的新手极为重要。
本指标适用于各个时间周期,通过交易标识和划线能非常明显地看出各个订单的具体交易情况,可作为信号卖家的辅助工具使用。