VWAP and MVWAP Easy for MT5
- 指标
- Eadvisors Software Inc.
- 版本: 129.79
- 激活: 5
The volume weighted average price (VWAP) is a trading benchmark used by traders that gives the average price a security has traded at throughout the day, based on both volume and price. It is important because it provides traders with insight into both the trend and value of a security.
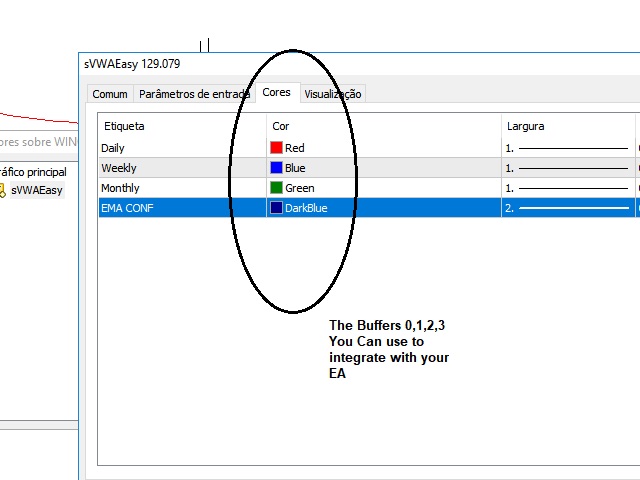
This version is simple to use as we simplify the indicator entries and leave only the most used buffers. You can use it to integrate with your EA
Product Features
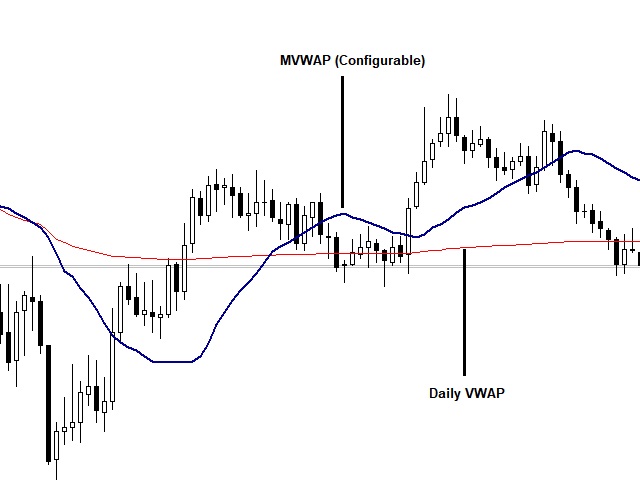
- Daily VWAP ploted at the chart.
- MOnthly VWAP ploted at the chart.
- Weekly VWAP ploted at the chart.
- EMA configurable VWAP ploted at the chart.
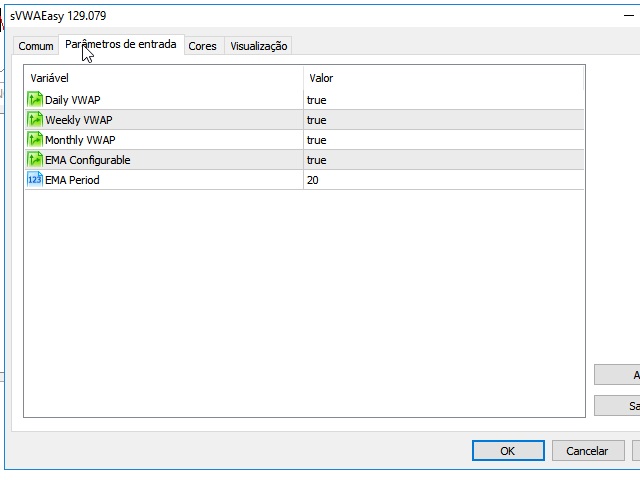
Indicator Parameters
- Daily VWAP Enable Option.
- Monthly VWAP Enable Option.
- Weekly VWAP Enable Option.
- EMA configurable VWAP Enable Option.
- EMA configurable period.