CyclicPatterns
- 指标
- Stanislav Korotky
- 版本: 1.3
- 激活: 5
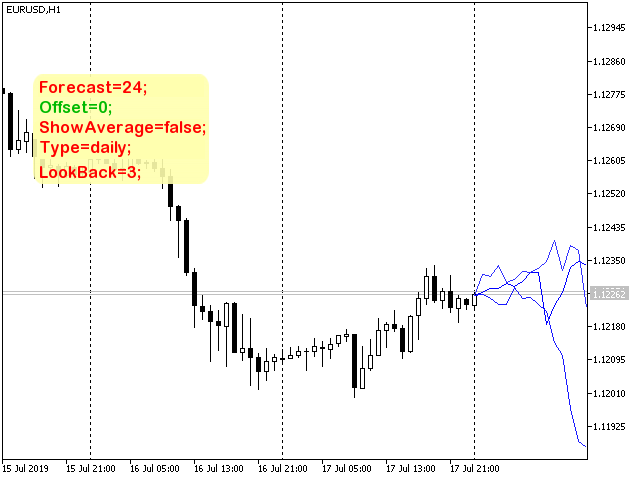
This indicator shows price changes for the same days in the past.
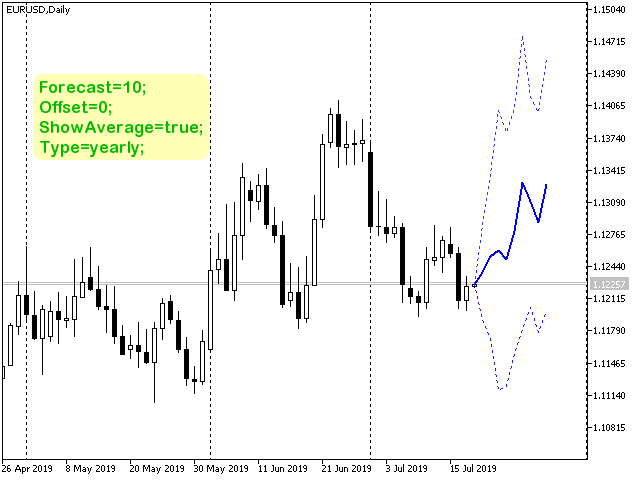
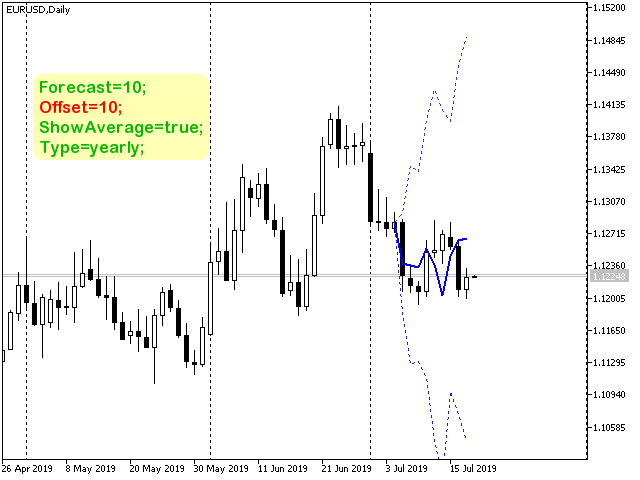
This is a predictor that finds bars for the same days in past N years, quarters, months, weeks, or days (N is 10 by default) and shows their relative price changes on the current chart. Number of displayed buffers and historical time series for comparison is limited to 10, but indicator can process more past periods if averaging mode is enabled (ShowAverage is true) - just specify required number in the LookBack parameter.
Parameters:
- Forecast - number of bars to show "future" price changes; default is 10;
- Offset - number of bars to shift back in history; default is 0;
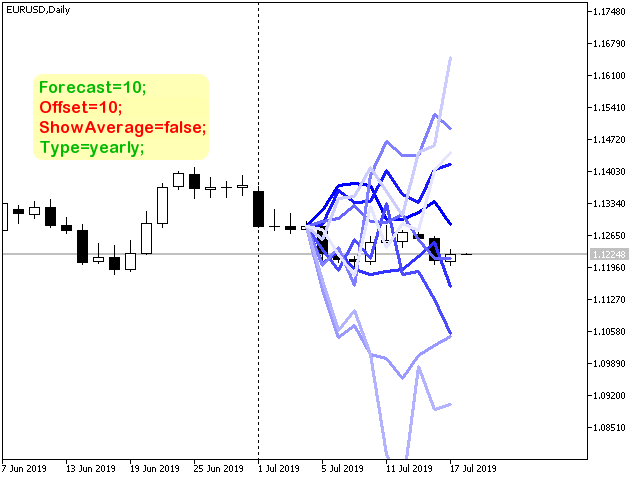
- ShowAverage - mode switch; true - show the mean value for all the past periods and deviation bounds; false - show price changes for the past periods themselves; default is true;
- PriceType - price type to use; default is Close;
- Smoothing - period of moving average for smoothing; by default it is 1 (no smoothing);
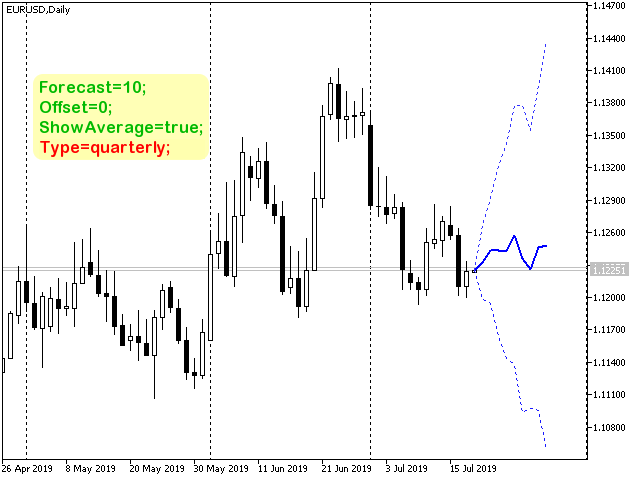
- Type - allows you to choose different periods for quotes comparison on history: yearly, quarterly, monthly, weekly, or dayly; by default it is yearly; you may place several instances of the indicator on the same chart in order to see trends in different time scales; when yearly scale is chosen, lines' width is 3, for quarterly it is 2, and otherwise it is 1;
- Color - base color for lines; recent past is shown in bright, older periods are faded;
- LookBack - number of past periods to compare, 10 by default, which is equal to maximum number of indicator buffers; can be larger, if ShowAverage is true;
The indicator works bar by bar - there is no ticks processing.
Recommended timeframes - D1, W1.
Forecast parameter must be less than number of bars (of current timeframe) in a single period of the given Type. For example, on H4 you can set Forecast to 6 bars maximum using daily cycles, because (-1) day holds 6 bars of H4. If Forecast is larger, we are trying to look into the future at Offset = 0, which brings "nothing". If cycle Type is weekly you can look forward by Forecast for 6*5 = 30 bars (6 bars of H4 per every one of 5 days in a week). Exactly the same, on D1 you can set Forecast to 5 bars maximum using weekly cycles, because (-1) week holds 5 days. The extrem case would be daily Type on D1 chart, where only 1 bar can be reliably veiwed by Forecast.

