Markets Heat MT5
- 指标
- Viktor Yatsyshyn
- 版本: 1.0
- 激活: 5
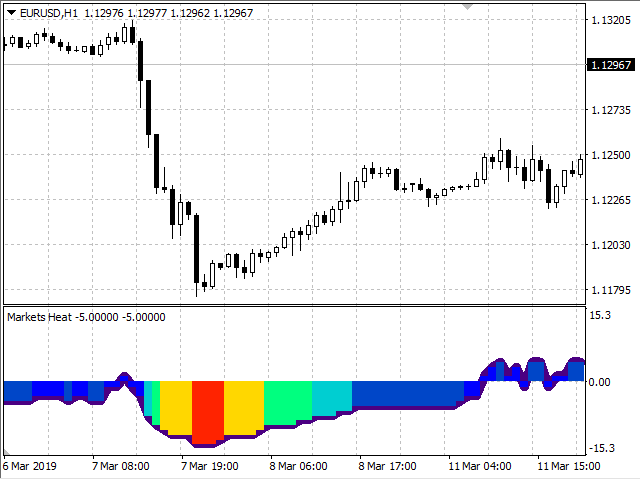
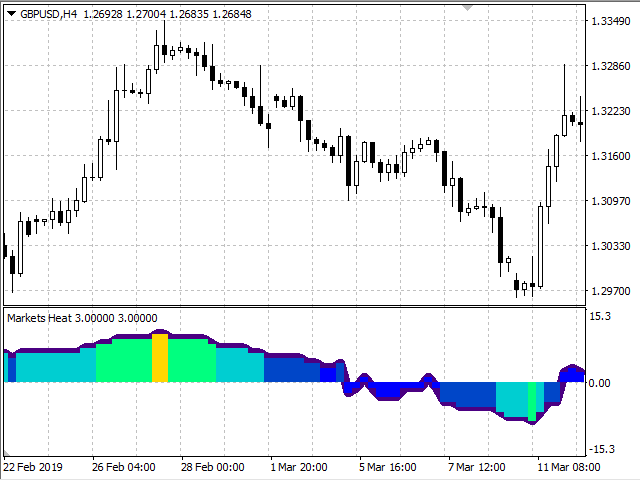
Markets Heat indicator can help you determine correct course of action at current market situation, by calculating market's "heat level".
What is market's "heat level"?
Well, it's my own way of simplifying complex market conditions to ease decision-making process.
How does it work?
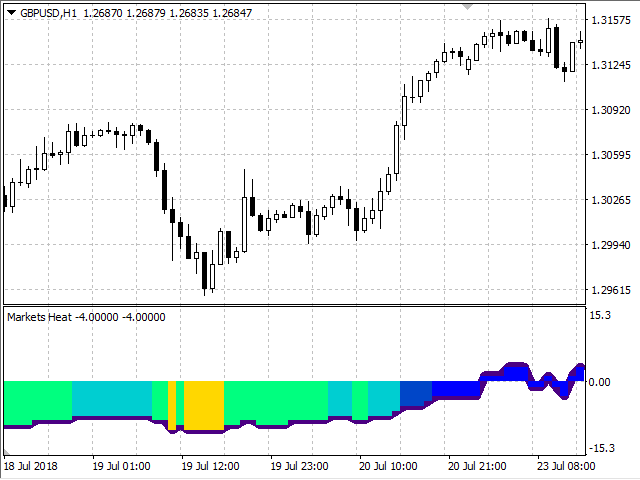
Most of time market is moving in some narrow range and can't "decide" where to go -> flat market -> cold market.
Other times, price goes Up or Down -> making trend movements -> heating the market.
More powerful trends making bigger/faster movements -> increasing "heat level".
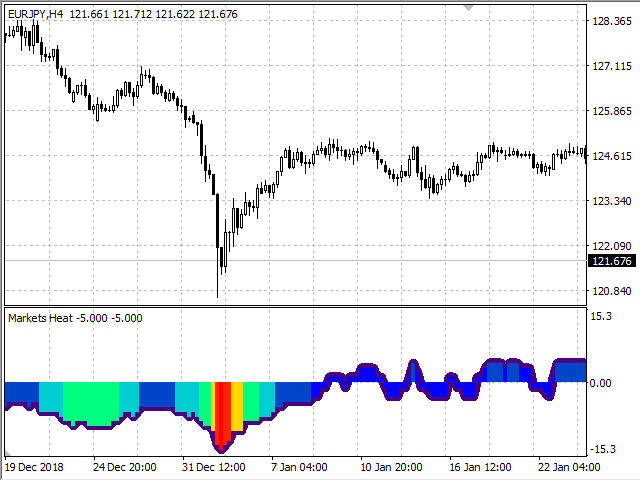
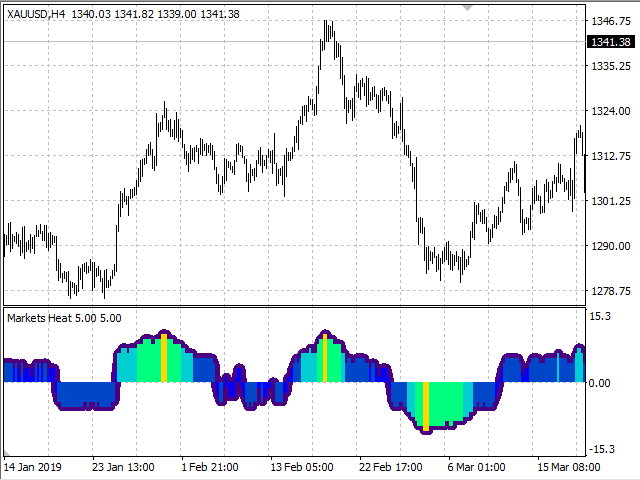
But nothing lasts forever.
And even most powerful(hot) trends has to end(cool off).
Markets Heat indicator is a great tool that can help you determine how "hot" is current market.
And it can be used/adapted for different trading styles.
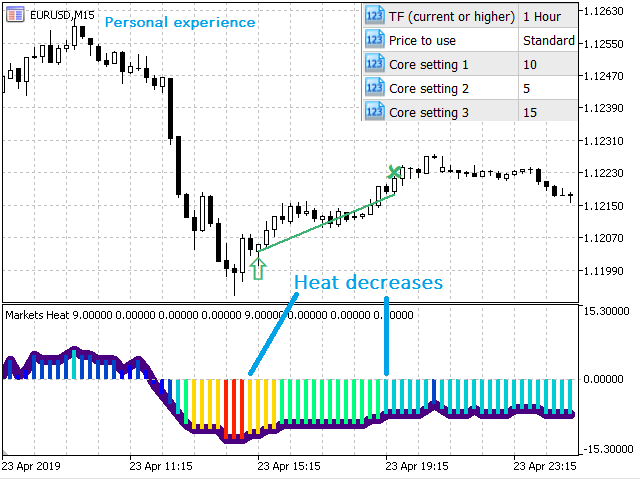
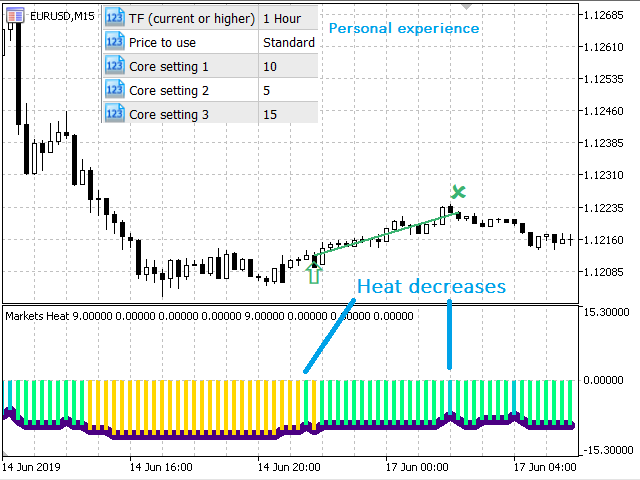
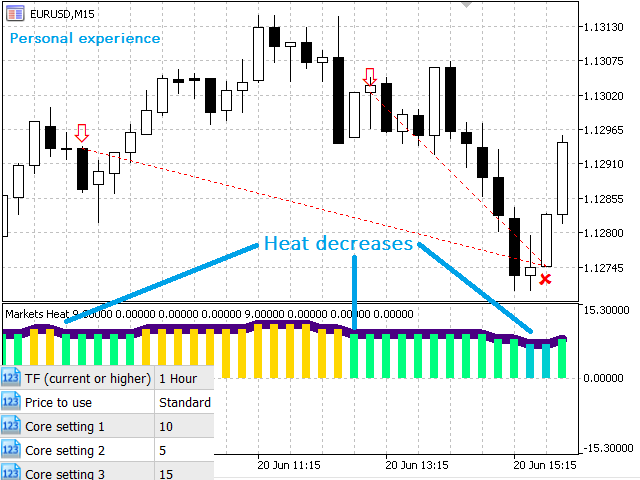
Those inputs can help you adjust it to your needs:
- "TF (current or higher)" — Multi-TF option to increase stability
- "Price to use" — price to determine "heat level"
- "Maximum bars calculated" — system input -> decrease it in case of lags
- "Core setting 1/2/3" — main inputs for internal calculations -> has the most influence on the results
Default settings provides good results in general.
But you might want to play with them and adjust to your personal trading style.
In my daily trading I am using default inputs(with multi-TF option).
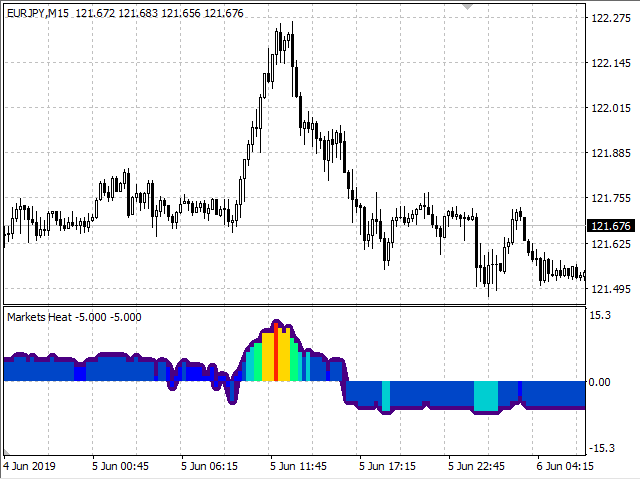
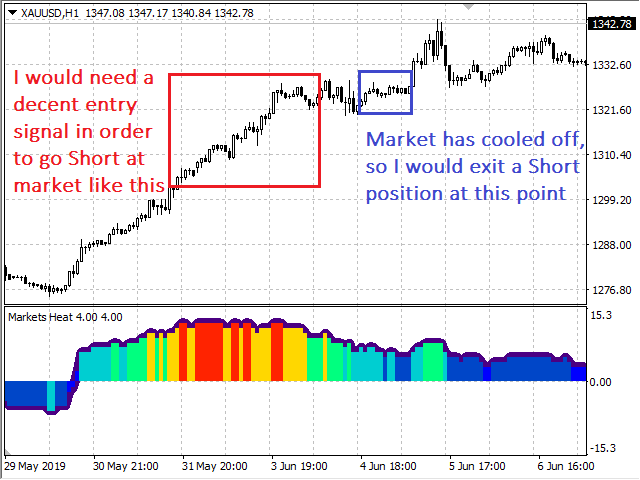
And this tool helps me to filter weak entry signals(when market is cold) and to find good exits(when market is cooling-off).
Hotter market has higher chance for reversal/correction -> making my entry signals more powerful.
And when market is cooling-off -> you might want to exit and take profits.
This is a relatively safe approach that helps me to be profitable for years.
But Markets Heat indicator also has huge potential for more aggressive trading styles.
So, regardless, try free demo right now -> perhaps this is your "missing link".
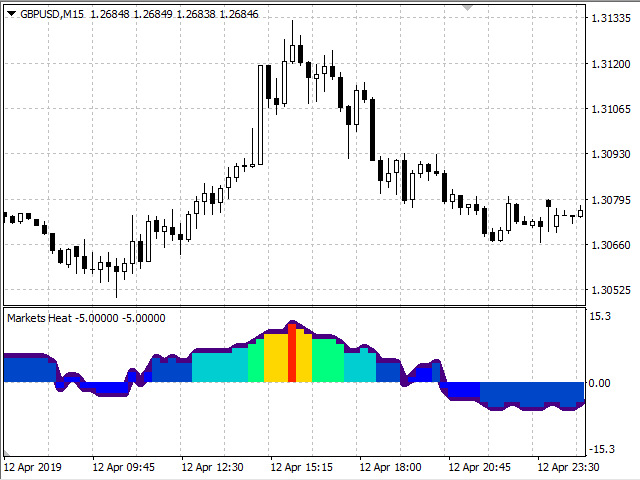
My recommendation: start with EURUSD M15 with Multi-TF = H1
PS. Markets Heat indicator doesn't repaint and can be easily used in the EA.