Niubility Scalping For MT5
Niubility Scalping
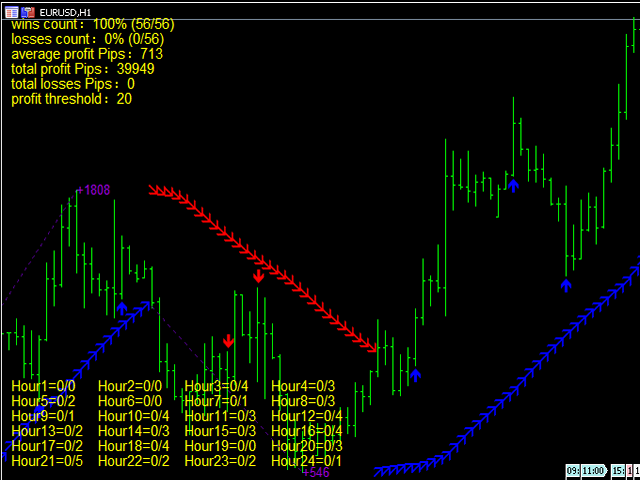
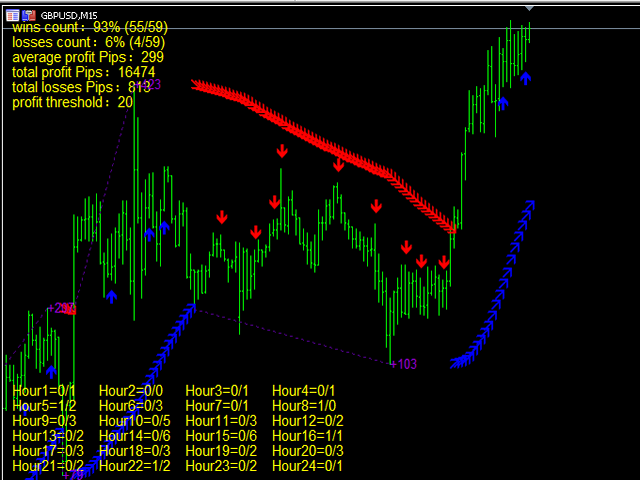
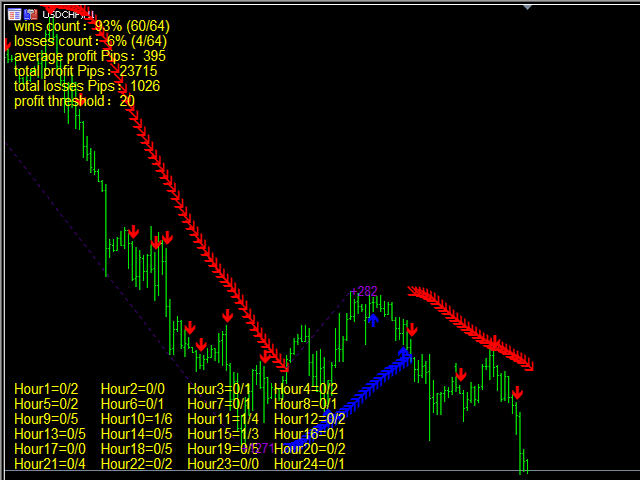
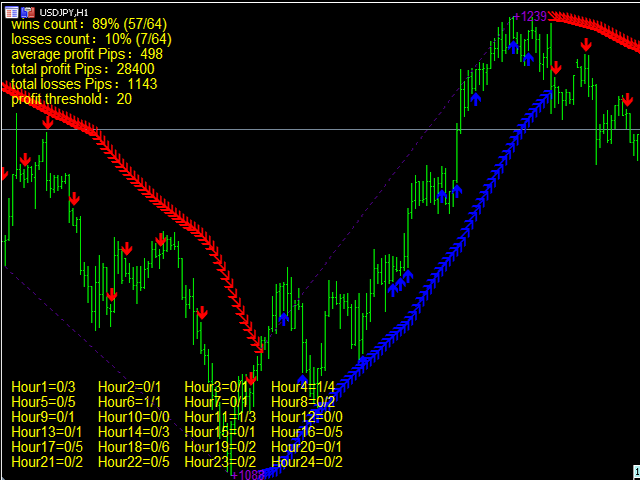
The Niubility Scalping indicator detects trend, give sell point and buy point. this indicator can use for scalping technique, and also use for trend technique.
Attention
Chart statistics will help you to optimize your trading, statistical accuracy to the hour.
It can works on every timeframe.
The indicator analyzes its own quality and performance.
Losing signals are highlighted and accounted.
The indicator is non-repainting.
It implements sound alerts.
Parameters
ProfitThreshold: profit threshold, use to statisitc wins rate.