Extended Keltner Channel MT5
- 指标
- Sergey Efimenko
- 版本: 1.6
- 更新: 25 三月 2020
- 激活: 10
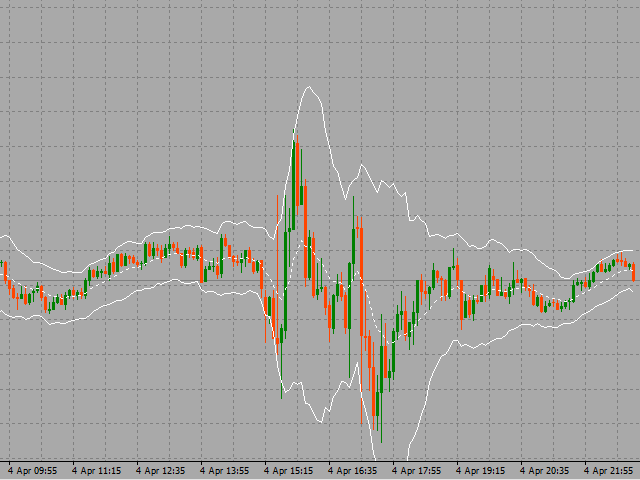
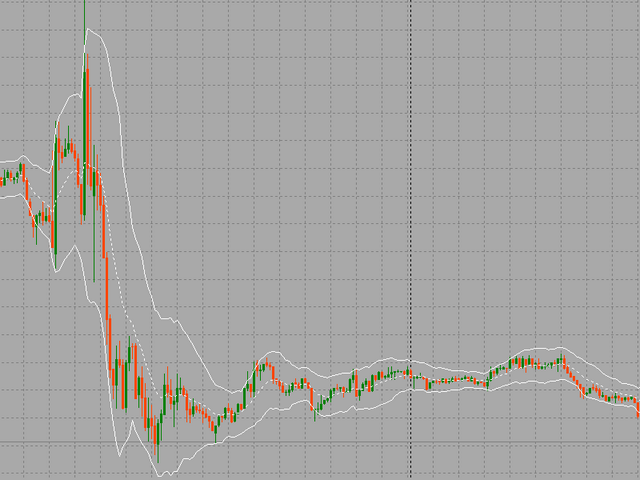
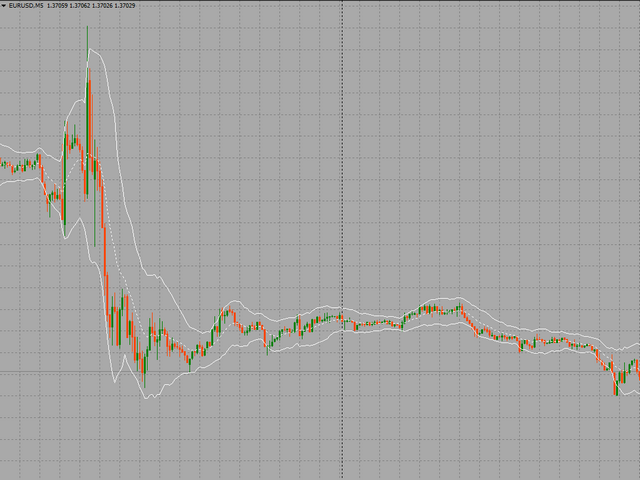
“Keltner 通道”指标的扩展版本。这是一种分析工具,可让您确定价格头寸相对于其波动率的比率。
您可以使用 26 种移动平均线和 11 种价格选项来计算指标的中线。当价格触及通道的上边界或下边界时,可配置的警报将通知您。
可用平均线类型:简单移动平均线、指数移动平均线、Wilder 指数移动平均线、线性加权移动平均线、正弦加权移动平均线、三角移动平均线、最小二乘移动平均线(或 EPMA、线性回归线)、平滑移动平均线、赫尔移动平均线Alan Hull 的平均值,零滞后指数移动平均线,Patrick Mulloy 的双指数移动平均线,T. Tillson 的 T3,J.Ehlers 的瞬时趋势线,移动中值,几何平均值,Chris Satchwell 的正则化 EMA,线性回归斜率的积分, LSMA 和 ILRS 的组合,J.Ehlers 概括的三角移动平均线,Mark Jurik 的成交量加权移动平均线,平滑。
计算价格选项:收盘价、开盘价、最高价、最低价、中间价=(最高价+最低价)/2、典型价格=(最高价+最低价+收盘价)/3、加权收盘价=(最高价+最低价+收盘价*2)/4 , Heiken Ashi Close, Heiken Ashi Open, Heiken Ashi High, Heiken Ashi Low。
参数:- PeriodMA - 通道中线的周期
- MethodMA——通道中心线平滑法
- PriceMA - 用于计算的价格
- PeriodATR - ATR 指标的周期
- MulATR - ATR 指标的乘数
- ShiftMA - 在图表上向前/向后移动通道
- AddDigits - 以小数点后的数字形式进一步提高指标读数的准确性
- AlertOnUpTouch - 当您触摸上部通道线时启用/禁用警报
- AlertOnDnTouch - 触摸下方通道线时启用/禁用警报
- EnableAlertMessage - 启用/禁用文本消息的显示
- EnableAlertNotification - 启用/禁用向移动终端发送通知
- EnableAlertSound - 启用/禁用声音通知
- AlertUpSoundFileName - 上声道线被触摸时通知的声音文件的名称
- AlertDnSoundFileName - 触摸下部通道线时用于通知的声音文件的名称
Как установить это чудо техники??
Купил.
Но он не скачивается и не активируется. Задолбался уже.