• 概述
  • 评论
  • 评论
  • 新特性

ClassicSBA

this indicator very simple and easy if you understand and agree with setup and rule basic teknical sba

you can cek in link :

please cek my youtube channel for detail

chanel :


an for detail info

 contact me 

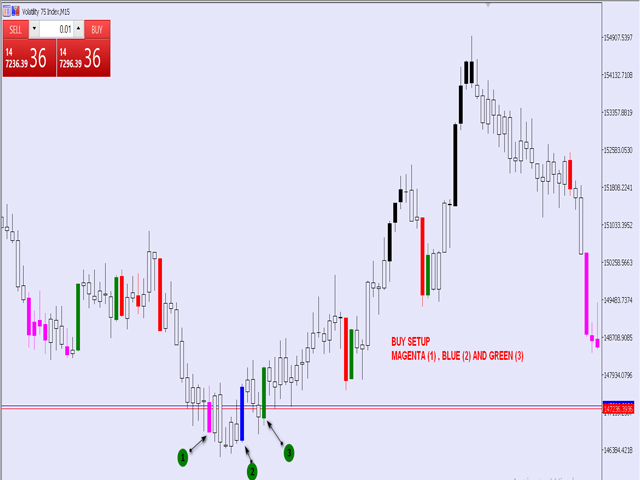
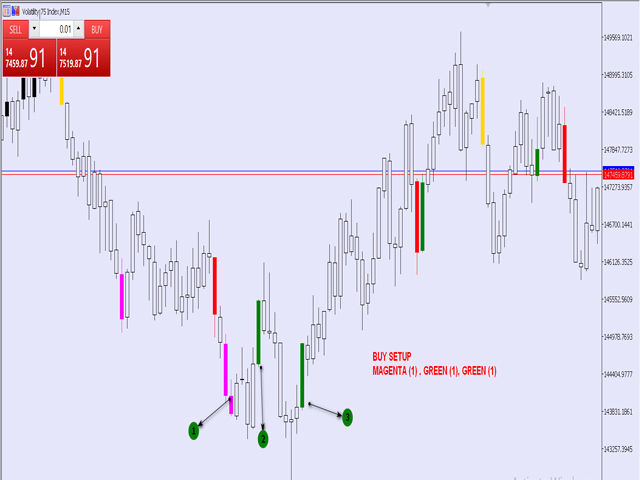
basicly setup buy (long) for this indicator is Magenta- blue and green candle or magenta - green  and green candlestik

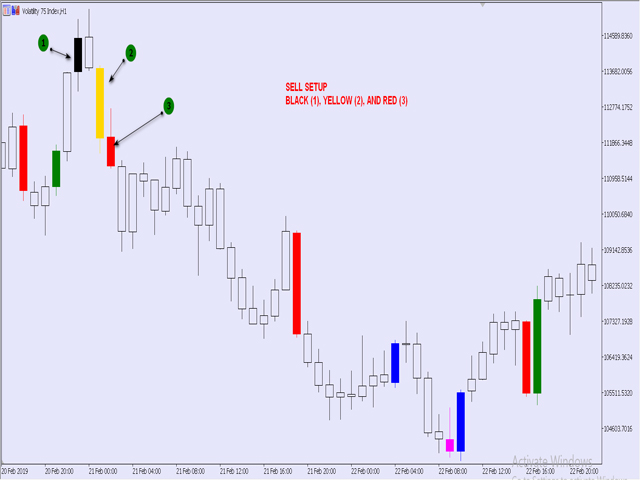
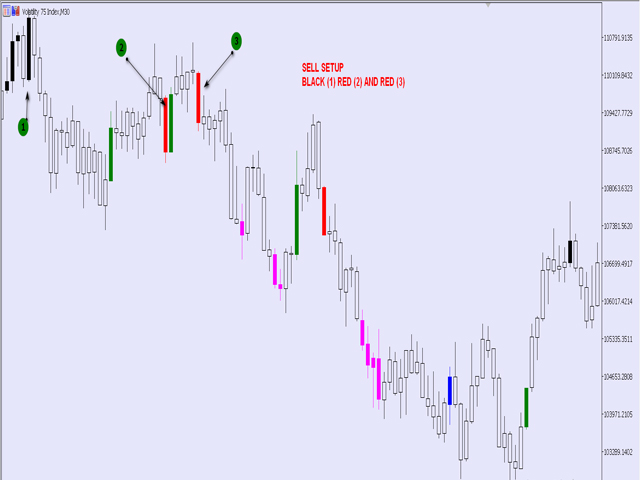
and for setup sell (short) is Black - yellow - and red candle or black - red  and red candlestik

推荐产品
A useful scanner/dashboard that shows the RSI values for multiple symbols and Time-frames. It can be easily hidden/displayed with a simple click on the scanner man top left of the dashboard. You can input upper and lower RSI values and the colours can be set to show when above/below these values. The default values are 70 and 30. There are also input colours for when the RSI is above or below 50 (but not exceeding the upper/lower levels Symbols and time-frames are input separated by commas.
Limitless MT5
Dmitriy Kashevich
Limitless MT5 is a universal indicator suitable for every beginner and experienced trader. works on all currency pairs, cryptocurrencies, raw stocks Limitless MT5 - already configured and does not require additional configuration And now the main thing Why Limitless MT5? 1 complete lack of redrawing 2 two years of testing by the best specialists in trading 3 the accuracy of correct signals exceeds 80% 4 performed well in trading during news releases Trading rules 1 buy signa
QuantumAlert Stoch Navigator is a free indicator available for MT4/MT5 platforms, its work is to provide "alerts" when the market is inside "overbought and oversold" regions in the form of "buy or sell" signals. This indicator comes with many customization options mentioned in the parameter section below, user can customise these parameters as needful. Join our   MQL5 group , where we share important news and updates. You are also welcome to join our private channel as well, contact me for the p
FREE
True Day
Aurthur Musendame
5 (1)
True Days is a tool designed specifically for the trader who wants to catch intraday volatility in price charts.  True day makes it easier for the trader to avoid trading in the dead zone - a period in time where markets are considered dead or non volatile. The trader can concentrate on finding opportunities only during periods of profound market movements. By default the indicator gives you a true day starting at 02:00 to 19:00 hours GMT+2. You can adjust according to your Time Zone. By deafult
FREE
QuantumAlert RSI Navigator is a free indicator available for MT4/MT5 platforms, its work is to provide "alerts" when the market is inside "overbought and oversold" regions in the form of "buy or sell" signals. This indicator comes with many customization options mentioned in the parameter section below, user can customise these parameters as needful. Join our MQL5 group , where we share important news and updates. You are also welcome to join our private channel as well, contact me for the priva
FREE
Round Numbers And Psychological Levels (Multi Pair And Multi Time Frame) :   ---LIMITED TIME OFFER: NEXT 25 CLIENTS ONLY ---46% OFF REGULAR PRICE AND 2 FREE BONUSES ---SEE BELOW FOR FULL DETAILS Studies show that more orders end in '0' than any other number.  Also know as 'round numbers', or 'psychological levels', these levels act as price barriers where large amounts of orders will generally accumulate. And the larger the number, the larger the psychological significance. Meaning that even
My PVSR
Ashok Kumar Singha
My PVSR   is based on All Type of Pivot Points. Use this Indicator to get proper Support / Resistance Zone and Trade accordingly.. Recommendation: Use this Indicator along with my another Indicator --->>> Dr. Trend   <<<--- Click Here ; To get the best output result feel free to contact me ; Best of Luck It can be used for: All Pairs: Forex, Cryptocurrencies, Metals, Stocks, Indices etc. All Timeframe All Brokers All type of Trading Style like Scalping, Swing, Intraday, Short-Term, Lon
AI Binary Sniper
Angelo Capoferri
基於人工智慧的指標,可產生二元期權的可能的看漲期權和看跌期權條目。 此指標適用於 3 種不同的策略: 1) 透過讀取交易量,它會在價格應該反轉時發出訊號 2)透過價格和成交量之間的背離,發出趨勢何時繼續或反轉的信號 3)透過價格和成交量之間的收斂,它發出了趨勢何時應該繼續的信號。 此指標適用於所有時間範圍,但在 3 分鐘或 5 分鐘期限內獲得最佳結果(因為在低時間範圍內會出現機構攻擊)。 最佳時間是流動性較大的時間,即格林威治標準時間 7 點至 18 點。 雖然該指標產生超過 70% 的正確訊號,但您可能會遇到操縱價格或相互排斥的機構之間的爭鬥,從而產生一系列錯誤訊號,因此我們建議使用充分的資金管理(例如 Masaniello )...
Follow The Line MT5
Oliver Gideon Amofa Appiah
4.42 (31)
This indicator obeys the popular maxim that: "THE TREND IS YOUR FRIEND" It paints a GREEN line for BUY and also paints a RED line for SELL. (you can change the colors). It gives alarms and alerts of all kinds. IT DOES NOT REPAINT and can be used for all currency pairs and timeframes. Yes, as easy and simple as that. Even a newbie can use it to make great and reliable trades. NB: For best results, get my other premium indicators for more powerful and reliable signals. Get them here: https://www.m
FREE
Go Way TREND
Ywsf Hsyn Hmad Alrsh
順應潮流。是的,在 15 分鐘的框架上等待進場信號,無論是買入還是賣出,並檢查信號是否出現在 30 分鐘的框架上(有時信號需要一個小時或更長時間才會出現。您可以返回到15分鐘框架並返回到30分鐘框架,重複此操作,直到主要訊號出現在您面前。被記錄,或當相反的訊號出現時它非常簡單並且適用於所有主要貨幣。  金屬、指標和所有框架,但最好的結果是 30 分鐘框架。 始終將止損設置在蠟燭底部下方,資金管理不得超過 資本的10% 順應潮流。是的,在 15 分鐘的框架上等待進場信號,無論是買入還是賣出,並檢查信號是否出現在 30 分鐘的框架上(有時信號需要一個小時或更長時間才會出現。您可以返回到15分鐘框架並返回到30分鐘框架,重複此操作,直到主要訊號出現在您面前。被記錄,或當相反的訊號出現時它非常簡單並且適用於所有主要貨幣。  金屬、指標和所有框架,但最好的結果是 30 分鐘框架。 始終將止損設置在蠟燭底部下方,資金管理不得超過 資本的10% 順應潮流。是的,在 15 分鐘的框架上等待進場信號,無論是買入還是賣出,並檢查信號是否出現在 30 分鐘的框架上(有時信號需要一個小時或更長時
LT Super Trend
Sie Samuel Roland Youl
4.88 (8)
Super Trend指标是一种受欢迎的技术分析工具,被交易者用来识别趋势方向以及市场中潜在的入场和出场点。它是一种趋势跟随指标,基于价格行动和波动性提供信号。 Super Trend指标由两条线组成 - 一条指示看涨趋势(通常为绿色),另一条指示看跌趋势(通常为红色)。根据趋势方向,这些线会在价格图表上方或下方绘制。 有效使用Super Trend指标的步骤如下: 1. 识别趋势方向:观察Super Trend线以确定市场是处于上涨趋势还是下跌趋势。绿色线表示上涨趋势,红色线表示下跌趋势。 2. 入场信号:当Super Trend线改变颜色时,考虑进场交易,表明可能发生趋势反转。例如,如果Super Trend线从红色变为绿色,表示从下跌趋势转变为上涨趋势,表明可能有买入机会。 3. 出场信号:使用Super Trend指标来确定何时退出交易。如果您处于多头头寸,并且Super Trend线从绿色变为红色,则可能是关闭交易并获利的信号。同样,如果您处于空头头寸,并且Super Trend线从红色变为绿色,则可能是潜在的出场点。 4. 设置止损:将Super
FREE
The Magic LWMA indicator is of great help in determining trend direction. It can be an excellent addition to your existing strategy or the basis of a new one. We humans can make better decisions when we see better visually. So we designed it to show a different color for rising and falling trends. Everyone can customize this in the way that suits them best. By setting the Trend Period, we can optimize it for longer or shorter trends for our strategy. It is great for all time frames. IF YOU NE
MarketMagnet
Kelly Adediran Raymond
Are you ready to take your trading journey to new heights? Look no further than MarketMagnet, this groundbreaking indicator designed to propel your trading success with excitement and accuracy. Powered by the convergence of Momentum and CCI (Commodity Channel Index), MarketMagnet equips traders with the ultimate tool to determine direction and entry prices for a wide range of recommended currency pairs and instruments. It is designed for traders seeking to scalp for a few pips on lower timeframe
Price DNA MT5
Ruben Octavio Gonzalez Aviles
价格DNA是一个趋势指标,它利用复合比率加权移动平均线来减少滞后,并能早期发现趋势。该指标不会重绘,可应用于任何时间框架的任何金融工具。 Price DNA是如何工作的? 该指标将在图表上显示多个 波浪 ,表明当前交易的方向。 五个绿波或五个红波分别表明强烈的看涨或看跌趋势。 根据您的个人交易风格,您可以选择在所有波浪或特定数量的波浪表明趋势反转时开仓或平仓。看涨波和看跌波的数量将始终显示在您终端的左上角。 设置 通过调整每个单独的DNA波的周期,你可以使价格DNA指标适应你的交易风格--无论是更激进还是更谨慎。 第一波周期。第一波的周期 第二波时期。第二波的周期 第三波时期。第三波的时期 第四波时期。第四浪的时期 第五波时期。第五浪的周期 乘法器。复合比率乘数 测试和安装 要测试这个指标,你只需从MetaTrader市场标签中下载演示版,并在 策略测试器中 使用它。购买后,你可以在 导航器 窗口内选择该指标,并将其拖到你想要的图表上。 如果你对该指标或其设置有任何问题或疑问,请随时联系我。
ToolBox 360 is the swiss knife of all indicators. It is full packed with useful tools to help you with your trading. It can be used to find best entry and exit points and help you to decide if you should open a trade or not. It shows market trends, candlestick formations outside / inside bars and you can sett time based allerts. Main features: Time based Fibonacci lines Choose a start and end time and the indicator shows you Fibonacci lines within the selected time range including range high
Super Trend eu
Emin Ulucanli
4.75 (4)
SUPERTREND; It is a trend following indicator based on the SuperTrend ATR created by Olivier Seban. It can be used to detect changes in trend direction and locate stops. When the price falls below the indicator curve, it turns red and indicates a downtrend. Conversely, when the price moves above the curve, the indicator turns green, indicating an uptrend. Like other indicators, it works well on SuperTrend when used in conjunction with other indicators such as MACD, parabolik SAR, Bollinger Band
FREE
God Spike Boom
Pedro Luis Oiaz Villamar
High Trend Lite MT5
Evgeniy Scherbina
5 (1)
The indicator High Trend Lite monitors 5 symbols in up to 3 timeframes simultaneously and calculates the strength of their signals. The indicator notifies you when a signal is the same in different timeframes. The indicator can do this from just one chart. Therefore, High Trend Lite is a multicurrency and multitimeframe indicator. With the High Trend Pro , available at this link , you will have an unlimited number of symbols, 4 timeframes, a colourful chart of the primary MACD indicator, several
FREE
Stormer RSI 2
Ricardo Rodrigues Lucca
This strategy was learned from Stormer to be used on B3. Basically, 15 minutes before closing the market, it will check RSI and decided if it will open an position. This strategy do not define a stop loss. If the take profit reach the entry price it will close at market the position. The same happens if the maximal number of days is reached. It is created to brazilian people, so all configuration are in portuguese. Sorry Activations allowed have been set to 50.
Urgently mt5
Tatiana Savkevych
The Urgently indicator is designed to quickly determine the situation in the market, reflect the state of the market and signal profitable levels for opening trades. Market conditions change quickly enough, requiring constant calibration of trading strategies. Recommended for use in conjunction with any of the oscillators. The Urgently forex market trend indicator shows the trend direction and entry points. It smooths out price fluctuations when generating a signal by averaging the data and the
ScalperMultiMT5
Andrey Spiridonov
ScalperMultiMT5 is a multicurrency indicator for professional traders. The indicator shows the complete market situation for the trader. The main advantage of this indicator is that it simultaneously analyzes six major currency pairs on all timeframes from M1 to MN. The indicator analyzes the trend strength. The indicator generates color-coded signals to visualize the market situation: Green - ascending trend. Red - descending trend. Yellow - trend is not defined. The indicator is excellent for
KT Triple Top Bottom MT5
KEENBASE SOFTWARE SOLUTIONS
KT Triple Top-Bottom identifies the triple top/bottom pattern with a breakout signal in the opposite direction. It is used to identify potential trend reversals. A Triple Top pattern is formed when the price reaches a high point three times, while a Triple Bottom pattern occurs when the price comes to a low point three times. Features The indicator detects the triple top/bottom pattern with high precision and accuracy. The indicator suggests a shift in momentum, with sellers or buyers takin
Value Chart Candlesticks
Flavio Javier Jarabeck
4.7 (10)
The idea of a Value Chart indicator was presented in the very good book I read back in 2020 , " Dynamic Trading Indicators: Winning with Value Charts and Price Action Profile ", from the authors Mark Helweg and David Stendahl. The idea is simple and the result is pure genius: Present candlestick Price analysis in a detrended way! HOW TO READ THIS INDICATOR Look for Overbought and Oversold levels. Of course, you will need to test the settings a lot to find the "correct" one for your approach.
FREE
该指标将向您显示您已经为图表上的每个订单设置的 TP 和 SL 值(以该货币表示)(接近交易/订单行),这将帮助您估算每个订单的利润和损失。它还会向您显示 PIP 值。显示的格式是“我们的损益/PIP 值的货币值”。 TP 值将以绿色显示,SL 值将以红色显示。 如有任何问题或了解更多信息,请随时通过 fxlife.asia@hotmail.com 或 fxlife.asia@yahoo.com 与卖家联系 (而指标中即将加入的下一个功能是“自动或半自动TP和SL设置”,我们的客户将免费获得更新版本。谢谢...^_^) (或者如果您认为在指示中应该增加一些功能,请随时告诉我们) ========================================================
VVWAP Bandas
Edipaulo Zanella
Daily VWAP, continues for a period of hours (eg, 10 hours of history), with color to indicate change of direction and bands to map good entry and exit points. The indicator was created to map the center of the market, and find good buying moments, trend analysis or market correction points are easily detected, allowing you to understand moments of exhaustion and buying and selling points Copyright (c) <year> <copyright holders> Permission is hereby granted, free of charge, to any person obtain
DYNAMIC SR TREND CHANNEL Dynamic SR Trend Channel is a simple indicator for trend detection as well as resistance/support levels on the current timeframe. It shows you areas where to expect possible change in trend direction and trend continuation. It works with any trading system (both price action and other trading system that use indicators) and is also very good for renko charting system as well. In an uptrend, the red line (main line) serves as the support and the blue line serves as the
Master OBV FX
Thalles Nascimento De Carvalho
5 (1)
MasterOBV:精准掌握市场趋势! MasterOBV 是一个 技术分析指标 ,结合了 成交量 、 正相关性 和 移动平均线(MA) ,以提高在金融市场中识别趋势的能力。 主要功能: 智能成交量: 分析交易量,以识别趋势强度的显著变化。 正相关性: 包括相关资产,以获得更广泛和准确的视角,基于对价格的位移潜力强化。 视觉通道: 利用视觉通道清晰准确地评估趋势的延续和反转潜力,提供直观的视觉分析。 平滑移动平均线: MA 平滑价格波动,使得识别主要趋势方向更加容易。 为什么选择 MasterOBV? 决策信心: 集成多个因素,帮助您自信地做出进出市场的决策。 全面分析: 不仅考虑价格,还考虑成交量、资产相关性和视觉通道,提供市场的完整视角。 价格位移潜力: 使用在同一方向移动的相关对,增强价格位移机会,最大化交易的影响力。 点击这里访问无限版
FREE
The indicator determines the state of the market: trend or flat. The state of the market is determined by taking into account volatility. The flat (trading corridor)is displayed in yellow. The green color shows the upward trend. The red color shows the downward trend. The height of the label corresponds to the volatility in the market. The indicator does not redraw . Settings History_Size   - the amount of history for calculation. Period_Candles  - the number of candles to calculate the
MR Trend Corrections 5
Sergey Khramchenkov
We publish the indicator as a useful tool in trading and call this indicator the "Swiss Army Knife" because it provides many possibilities and combinations to help understand the material on the "Masters of Risk" trading system. The indicator itself is not part of the tools used in the "Masters of Risk" trading system. The indicator consists of 3 separate multi-timeframe indicators, which in combination with each other help to reduce the "noise" of false signals. The first of the indicators ar
Magic EA MT5
Kyra Nickaline Watson-gordon
Magic EA is an Expert Advisor based on Scalping, Elliot Waves and with filters such as RSI, Stochastic and 3 other strategies managed and decided with the robot smartly. Large number of inputs and settings are tested and optimized and embedded in the program thus inputs are limited and very simple. Using EA doesn't need any professional information or Forex Trading Knowledge. EA can trade on all symbols and all time frames, using special and unique strategies developed by the author. The EA
该产品的买家也购买
Atomic Analyst MT5
Issam Kassas
4.79 (19)
首先值得强调的是,该交易指标是非重绘、非延迟的指标,这使其成为手动和机器人交易的理想选择。 用户手册:设置、输入和策略。 Atomic Analyst是一种PA价格行动指标,利用价格的力量和动量来寻找市场上更好的机会。配备了高级过滤器,可帮助去除噪音和假信号,并提高交易潜力。使用多层复杂的指标,Atomic Analyst扫描图表,并将复杂的数学计算转化为任何初学者都能理解并用来做出一致交易决策的简单信号和颜色。 “Atomic Analyst”是专为新手和经验丰富的交易者量身定制的综合交易解决方案。它将高级指标和一流功能融合为一体的交易策略,使其成为所有类型交易者的多功能选择。 日内交易和剥头皮策略:专为快速准确的日内交易和短期交易而设计。 日内和摆动交易策略:可用作追求价格大幅波动的日内和摆动交易者的可靠工具。 多货币和市场:凭借其可靠的精度,在不同的工具和市场上运作。 多个时间框架:可在多个时间框架上使用,性能良好。 稳定性:所有指标均不重绘、不重绘和不滞后,确保可靠的信号。 信号清晰度:提供箭头信号,用于清晰的入场和出场点。 实时警报:通过交易入场、SL和TP警报通知交
首先,值得强调的是,这个交易系统是一个非重绘、非重画和非滞后的指标,这使得它非常适合手动和机器人交易。 在线课程,手册和下载预设。 “智能趋势交易系统 MT5”是专为新手和经验丰富的交易者量身定制的综合交易解决方案。它结合了超过 10 个优质指标,具有 7 多个强大的交易策略,使其成为适用于各种市场条件的多功能选择。 趋势跟随策略:提供精确的入场和止损管理,以有效地跟随趋势。 反转策略:识别潜在的趋势反转,使交易者能够利用区域市场的机会。 剃头策略:专为快速准确的日内交易和短期交易而设计。 稳定性:所有指标都不会重绘、不会重画和不会滞后,确保可靠的信号。 定制:支持自定义策略,以满足个人交易偏好。超过 7 种策略和组合可帮助您找到最佳策略。 信号清晰度:提供箭头信号,以指示清晰的入场和退出点。 实时警报:通过交易进出警报使交易者保持了解。 深入分析:提供更高时间框架的趋势分析和实时交易监控。 自适应颜色编码:利用蜡烛颜色编码来显示成交量、趋势和反转蜡烛信号。通过蜡烛颜色分析市场方向。 “智能趋势交易系统 MT5”赋予交易者必要的工具,以便在各种市场条件下做出明智和战略性的交易决策。无论
TPSpro RFI Levels MT5
Roman Podpora
4.67 (9)
Reversal First Impulse levels (RFI)      INSTRUCTIONS        RUS       -       ENG              R ecommended to use with an indicator   -   TPSpro  TREND PRO -  Version MT4                 A key element in trading is zones or levels from which decisions to buy or sell a trading instrument are made. Despite attempts by major players to conceal their presence in the market, they inevitably leave traces. Our task was to learn how to identify these traces and interpret them correctly. Main functi
Entry Points Pro for MT5
Yury Orlov
4.56 (163)
这款指标用于 MT5,可提供准确的入场交易信号,且无重绘。 它可应用在任何金融资产:外汇、加密货币、贵金属、股票、指数。 它将提供极其精准的评估,并告诉您何时开仓和平仓的最佳时机。 观看 视频 (6:22),其中包含一个仅处理单一信号的示例,该信号即可值回指标购价! 大多数交易者在 Entry Points Pro 指标的帮助下,在第一个交易周内即改善了他们的交易结果。 订阅我们的 Telegram 群 ! Entry Points Pro 指标的益处。 入场信号无重绘 如果信号出现,并得到确认,则它不会再消失;不像是重绘指标,它会导致重大的财产损失,因为它们可以在显示信号后再将其删除。 无差错开仓 指标算法可令您找到入场交易(买入或卖出资产)的理想时机,从而提高每位交易者的成功率。 Entry Points Pro 可操作任何资产 它允许您在 MT5 平台上交易任何经纪商的加密货币、股票、贵金属、指数、大宗商品和货币。 提供任何方向的信号 Entry Points Pro 指标提供针对任意价格走势的入场交易信号 - 上涨、下跌或横盘(横向)。
首先,值得强调的是,这个交易工具是非重绘、非重画和非滞后的指标,非常适合专业交易。 在线课程,用户手册和演示。 智能价格行动概念指标是一个非常强大的工具,既适用于新手,也适用于经验丰富的交易者。它将超过20个有用的指标合并到一个指标中,结合了高级交易思想,如内圈交易员分析和智能资金概念交易策略。该指标侧重于智能资金概念,提供有关大型机构交易方式的见解,帮助预测它们的动向。 它在流动性分析方面尤其擅长,有助于理解机构的交易方式。它擅长预测市场趋势,并仔细分析价格波动。通过将您的交易与机构策略对齐,您可以更准确地预测市场走向。该指标多才多艺,擅长分析市场结构,识别重要的订单区块,并识别各种模式。 它擅长识别BOS和CHoCH等模式,理解动量的转变,并突出显示供需强劲的关键区域。它还擅长发现强大的不平衡,并分析价格创造更高高点或更低低点的模式。如果您使用斐波那契回撤工具,该指标可以满足您的需求。它还可以识别相等的高点和低点,分析不同的时间框架,并通过仪表板显示数据。 对于使用更高级策略的交易者,该指标提供了工具,如公平价值差指标和优惠和折扣区域的识别。它特别关注高时间框架订单
Quantum Trend Sniper
Bogdan Ion Puscasu
4.92 (48)
介绍   量子趋势狙击指标 ,突破性的 MQL5 指标,正在改变您识别和交易趋势反转的方式!由拥有超过13年交易经验的资深交易员团队开发,     量子趋势狙击指标   旨在通过其创新的方式以极高的准确度识别趋势反转,将您的交易之旅推向新的高度。 ***购买量子趋势狙击指标,即可免费获得量子突破指标!*** 当量子突破指标识别出趋势反转时,它会向您发出警报和信号箭头,并建议您三个止盈水平。 它既适合新手交易者,也适合专业交易者。 量子 EA 通道:       点击这里 MT4版本:       点击这里 建议: 时间范围: 所有时间范围。为了获得最佳结果,我们建议在 M15、M30 和 H1 时间范围内使用它。 货币对:欧元兑美元、英镑兑美元、澳元兑美元、欧元兑英镑、, EURAUD,  XAUUSD 账户类型:ECN、Raw 或 Razor,点差极低 经纪时间:任意 经纪商:IC Markets、Pepperstone with Raw 和 Razor 的点差最低 建议止损:50 点 建议止盈水平:20 点、50 点和
FX Power MT5 NG
Daniel Stein
5 (6)
通过 mql5 和 Telegram 上 的晨间简报获取每日市场更新,包括详细信息和屏幕截图 ! FX Power MT5 NG 是我们长期以来非常受欢迎的货币强度计算器 FX Power 的下一代产品。 这款下一代强度计算器能提供什么?您所喜爱的原版 FX Power 的所有功能 附加功能 黄金/XAU 强度分析 更精确的计算结果 可单独配置的分析周期 可自定义计算限制,以获得更好的性能 为希望查看更多信息的用户提供特殊的多实例设置 无尽的图形设置,可在每个图表中设置您最喜欢的颜色 无数的通知选项,让您再也不会错过任何重要信息 采用 Windows 11 和 macOS 风格的全新圆角设计 神奇的移动指标面板 FX Power 主要功能 所有主要货币的完整强势历史 所有时间框架内的货币强弱历史 所有经纪商和图表的计算结果完全相同 100% 可靠的实时计算 -> 无重绘 可通过下拉列表选择分析时段 通过自定义模式单独配置分析时段 可在一个图表中使用多个实例 可移动 FX Power 显示屏(通过拖放) 适用于高分辨率 QHD、UHD 和 4K 显示器 自动终端配置 针对平板电脑
FX Volume MT5
Daniel Stein
4.94 (17)
通过 mql5 和 Telegram 上 的 " 晨间简报 "获取每日市场更新,包括详细信息和屏幕截图 ! 外汇交易量(FX Volume)是第一个也是唯一一个从经纪商角度真正洞察市场情绪的交易量指标。 直接在您的图表上看到这些信息是真正改变游戏规则和突破性的交易解决方案。 受益于独特的市场数据洞察,如 比率(Ratios )显示货币多头和空头头寸的比率(百分比 比率变化 显示所选时间段内的多头比率及其百分比变化 总交易量 显示货币的总交易量(多头和空头),以手为单位 多头 交易量显示货币所有多头头寸的交易量 空头 交易量显示所有货币空头头寸的交易量 净多头 显示净多头交易量,即所有多头头寸减去所有空头头寸(以手为单位)。 净多头百分比 显示货币净多头交易量的变化 请阅读我们的基本教程 -> "如何使用外汇交易量进行交易 " 获取更多信息,如常见问题、交易技巧和教程视频,请访问我们的 外汇交易量公共信息频道 请 安装并运行 SI Connect 以建立与我们数据中心的持续连接 背景信息 我们都知道,外汇是一个分散的市场。这就是为什么我们必须打破常规思维,开发一个独
XQ Indicator MetaTrader 5
Marzena Maria Szmit
3.5 (2)
Step into the realm of Forex trading with confidence and precision using XQ, a cutting-edge Forex indicator designed to elevate your trading game to unprecedented heights. Whether you're a seasoned trader or just stepping into the world of currency exchange, XQ Forex Indicator empowers you with the insights and signals needed to make informed trading decisions. The signal conditions are a combination of three indicators, and XQ Forex Indicator only display  medium and long-term trends . The ind
该仪表盘显示所选符号的最新可用谐波形态,因此您可以节省时间并提高效率 /  MT4 版本 。 免费指标:  Basic Harmonic Pattern 指标列 Symbol:   显示所选符号 Trend:     看涨或看跌 Pattern:    形态类型(Gartley、蝴蝶、蝙蝠、螃蟹、鲨鱼、Cypher 或 ABCD) Entry:     入口价格 SL: 止损价 TP1: 第一止盈价 TP2: 第二次获利价格 TP3: 第三次获利价格 Current price:    当前价格 Age (in bars):   最后绘制的模式的年龄 主要输入 Symbols :   从 "28 种主要货币对 "或 "选定符号 "中选择。 Selected Symbols :   希望监控的符号,用逗号分隔("EURUSD,GBPUSD,XAUUSD")。如果您的经纪商为货币对设置了后缀或前缀,您必须在以下两个参数中添加(货币对前缀或货币对后缀)。 Max Iteration:   调整模式的最大迭代次数(如果该值越小,则模式越少,性能越快;如果该值越大,则模式越多,性能
TrendMaestro5
Stefano Frisetti
note: this indicator is for METATRADER4, if you want the version for METATRADER5 this is the link:  https://www.mql5.com/it/market/product/108106 TRENDMAESTRO ver 2.4 TRENDMAESTRO recognizes a new TREND in the bud, he never makes mistakes. The certainty of identifying a new TREND is priceless. DESCRIPTION TRENDMAESTRO identifies a new TREND in the bud, this indicator examines the volatility, volumes and momentum to identify the moment in which there is an explosion of one or more of these data a
Gartley Hunter Multi
Siarhei Vashchylka
5 (8)
Gartley Hunter Multi - An indicator for searching for harmonic patterns simultaneously on dozens of trading instruments and on all possible timeframes. Manual (Be sure to read before purchasing) | Version for MT4 Advantages 1. Patterns: Gartley, Butterfly, Shark, Crab. Bat, Alternate Bat, Deep Crab, Cypher 2. Simultaneous search for patterns on dozens of trading instruments and on all possible timeframes 3. Search for patterns of all possible sizes. From the smallest to the largest 4. A
PZ Support Resistance MT5
PZ TRADING SLU
4.17 (6)
厌倦了绘制支撑线和阻力线? 支撑阻力 是一个多时间指标,可以自动检测并绘制图表中的支撑线和阻力线,并具有非常有趣的变化:随着时间的推移测试价格水平及其重要性的提高,线变得越来越粗。 [ 安装指南 | 更新指南 | 故障排除 | 常见问题 | 所有产品 ] 一夜之间增强您的技术分析 无需浏览图表即可检测重要的价格水平 一目了然地识别所有价格水平的相对优势 每次交易最多可节省半小时的绘图线 指标显示所有价格水平的期限 指示器不重涂 过去和现在的价格水平因接近程度而崩溃,并根据当前的市场行为进行了调整。在动作发生的地方绘制了线条,而不一定在峰值处绘制了线条。 价格水平随着时间的推移而被拒绝,变得越来越暗 定期清除不重要的价格水平以避免噪音 可自定义的时间范围选择和崩溃因子 它实现了电子邮件/声音/推送警报的突破 输入参数 指标设置:指标将从当前时间段读取价格,但您可以选择另一个。例如,您可以在H4图表中显示D1支撑线和阻力线。您还可以使用 价格水平密度 参数选择在图表上显示多少价格水平。 颜色设置:根据重要性输入所需的支撑线和阻力线颜色。 标签设置:(可选)可以在指示器
Matrix Arrow Indicator MT5
Juvenille Emperor Limited
5 (14)
矩阵箭头指标 MT5   是一种独特的 10 合 1 趋势,遵循   100% 非重绘多时间框架指标 ,可用于所有符号/工具: 外汇 、 商品 、 加密货币 、 指数 、 股票 。 Matrix Arrow Indicator MT5 将在其早期阶段确定当前趋势,从多达 10 个标准指标中收集信息和数据,它们是: 平均定向运动指数 (ADX) 商品渠道指数 (CCI) 经典 Heiken Ashi 蜡烛 移动平均线 移动平均收敛散度 (MACD) 相对活力指数 (RVI) 相对强弱指数 (RSI) 抛物线SAR 随机振荡器 威廉姆斯的百分比范围 当所有指标给出有效的买入或卖出信号时,相应的箭头将打印在图表上,在下一根蜡烛/柱线开盘时,指示强劲的上升趋势/下降趋势。用户可以选择使用哪些指标,并可以单独调整每个指标的参数。 Matrix Arrow Indicator MT5 仅从选定的指标中收集信息,并仅根据其数据打印箭头。   Matrix Arrow Indicator MT5   还可以为所有新信号发送终端、推送通知或电子邮件警报。无论您是黄牛、日内交易者还是波段交易者, Mat
Volume by Price MT5
Brian Collard
3.6 (5)
The Volumebyprice.com Indicator for MetaTrader 5 features Volume Profile and Market Profile TPO (Time Price Opportunity). Volume and TPO histogram bar and line charts. Volume Footprint charts. TPO letter and block marker collapsed and split structure charts. Static, dynamic and flexible range segmentation and compositing methods with relative and absolute visualizations. Session hours filtering and segment concatenation with Market Watch and custom user specifications. Graphical layering, posit
Volatility Trend System - a trading system that gives signals for entries. The volatility system gives linear and point signals in the direction of the trend, as well as signals to exit it, without redrawing and delays. The trend indicator monitors the direction of the medium-term trend, shows the direction and its change. The signal indicator is based on changes in volatility and shows market entries. The indicator is equipped with several types of alerts. Can be applied to various trading in
Blahtech Supply Demand MT5
Blahtech Limited
4.54 (13)
Was: $299  Now: $99   Supply Demand uses previous price action to identify potential imbalances between buyers and sellers. The key is to identify the better odds zones, not just the untouched ones. Blahtech Supply Demand indicator delivers functionality previously unavailable on any trading platform. This 4-in-1 indicator not only highlights the higher probability zones using a multi-criteria strength engine, but also combines it with multi-timeframe trend analysis, previously confirmed swings
Gold TMAF MTF - 这是一个最佳股票技术指标。该指标算法分析资产的价格走势,并反映波动性和潜在进入区域。 最佳指标信号: - 卖出 = TMA2 的红色上边界高于 TMA1 的红色上边界 + 上方的红色分形指标 + 同方向的黄色 SR 信号箭头。 - 买入 = TMA2 的蓝色下边界低于 TMA1 的蓝色下边界 + 下方的蓝色分形指标 + 同方向的水蓝色 SR 信号箭头。 该指标的优点 1. 指标产生的信号精确度高。 2. 确认的箭头信号不会重绘,分形信号可以重绘半个周期。 3. 您可以在任何经纪商的 MetaTrader 5 交易平台上进行交易。 4. 您可以交易任何资产(货币、金属、加密货币、股票、指数等)。 5. 最好在 M30-H1 时间框架(中期交易)上进行交易。 6. 在指标设置中可更改个别参数(TF、颜色等),以便每位交易者都能轻松定制适合自己的指标。 7. 该指标既可作为交易系统的主要补充,也可作为独立的交易系统使用。 注意:交易的入市准确性和盈利能力仅取决于交易者的技能。任何指标都只是交易者的助手,而非行动指南。
Automated Trendlines MT5
Georgios Kalomoiropoulos
趋势线是外汇交易中最重要的技术分析工具。不幸的是,大多数交易者没有正确绘制它们。自动趋势线指标是专业交易者的专业工具,可帮助您可视化市场的趋势运动。 有两种类型的趋势线看涨趋势线和看跌趋势线。 在上升趋势中,外汇趋势线是通过价格变动的最低摆动点绘制的。 连接至少两个“最低点”将创建一条趋势线。 在下跌趋势中,趋势线是通过价格走势的最高摆动点绘制的。 连接至少两个“最高点”将创建一条趋势线。 趋势线何时突破? 当看跌蜡烛收于看涨​​趋势线下方并且蜡烛的高点在趋势线上方时,看涨趋势线会被打破。 当看涨蜡烛收于看跌趋势线上方并且蜡烛的低点低于趋势线时,看跌趋势线会被打破。 趋势线何时删除? 当一根完整的蜡烛在看涨趋势线下方形成时,看涨趋势线将被删除。 当完整的蜡烛在看跌趋势线上方形成时,看跌趋势线将被删除。 您可以从输入参数更改看涨和看跌趋势线的颜色和宽度。
TPA True Price Action indicator reveals the true price action of the market makers through 100% non-repainting signals strictly at the close of a candle! TPA shows entries and re-entries, every time the bulls are definitely stronger than the bears and vice versa. Not to confuse with red/green candles. The shift of power gets confirmed at the earliest stage and is ONE exit strategy of several. There are available now two free parts of the TPA User Guide for our customers. The first "The Basics"
Auto Order Block with break of structure based on ICT and Smart Money Concepts (SMC) Futures Break of Structure ( BoS )             Order block ( OB )            Higher time frame Order block / Point of Interest ( POI )    shown on current chart           Fair value Gap ( FVG ) / Imbalance   -  MTF      ( Multi Time Frame )    HH/LL/HL/LH  -  MTF      ( Multi Time Frame )  Choch  MTF      ( Multi Time Frame )  Volume Imbalance     ,  MTF          vIMB Gap’s Power of 3 Equal High
介绍     Quantum Breakout PRO   ,突破性的 MQL5 指标,正在改变您交易突破区域的方式!由拥有超过13年交易经验的资深交易员团队开发,     量子突破 PRO     旨在通过其创新和动态的突破区域策略将您的交易之旅推向新的高度。 量子突破指标将为您提供带有 5 个利润目标区域的突破区域的信号箭头,以及基于突破框的止损建议。 它既适合新手交易者,也适合专业交易者。 量子 EA 通道:       点击这里 重要的!购买后请私信我领取安装手册。 建议: 时间范围:M15 货币对:GBPJPY、EURJPY、USDJPY、NZDUSD、XAUUSD 账户类型:ECN、Raw 或 Razor,点差极低 经纪商时间:GMT +3 经纪商:IC Markets、Pepperstone with Raw 和 Razor 的点差最低 规格: 不重漆! 最多 5 个建议利润目标区域 建议止损水平 可定制的盒子。您可以设置自己的 Box Time Start 和 Box Time End。 接触 如果您有任何疑问或需要帮
Order Block Hunter MT5
Noha Mohamed Fathy Younes Badr
5 (1)
Order block hunter indicator is the best indicator for  hunt the order blocks that area where there has been a large concentration of limit orders waiting to be executed Order blocks are identified on a chart by observing previous price action and looking for areas where the price experienced significant movement or sudden changes in direction .This indicator does that for you by using very complicated codes and helps you to take the best areas To buy and sell because it make marks at the best a
AW Trend Predictor MT5
AW Trading Software Limited
4.78 (58)
一个系统中趋势和故障水平的组合。先进的指标算法过滤市场噪音,确定趋势、进入点以及可能的退出水平。指标信号记录在统计模块中,您可以选择最合适的工具,显示信号历史的有效性。该指标计算获利和止损标记。 手册和说明 ->   这里 / MT4 版本 ->   这里 如何使用指标进行交易: 使用趋势预测器进行交易只需三个简单的步骤: 第 1 步 - 开仓 收到买入信号,成功率超过 70% 第 2 步 - 确定止损 通过相反的信号选择中继线 第 3 步 - 定义止盈策略 策略一:达到 TP1 时平仓 策略 2:达到 TP1 时平仓 50%,达到 TP2 时平仓剩余 50% 策略三:在趋势反转时平仓 好处: 从不重绘结果,信号严格位于蜡烛收盘时 它可以在顾问中使用 获利和止损标记 对交易策略或独立策略的重要补充 市场噪音过滤算法 适用于任何工具 统计模块: 为了更好地选择配对,请使用内置的统计计算。 计算交易 - 给出统计数据的信号总数 成功评级 - 达到 TP1 的信号百分比,或反转那些正获利的信号时的百分比 TakeProfit1 Hit - 达到 TP1 的信号百分比 TakeProfit2
Blahtech Market Profile MT5
Blahtech Limited
5 (9)
Was: $249  Now: $99   Market Profile defines a number of day types that can help the trader to determine market behaviour. A key feature is the Value Area, representing the range of price action where 70% of trading took place. Understanding the Value Area can give traders valuable insight into market direction and establish the higher odds trade. It is an excellent addition to any system you may be using. Inspired by Jim Dalton’s book “Mind Over Markets”, this indicator is designed to suit the
TrendLiness MT5
Ugochukwu Mobi
If you want to find good trading opportunities, then you must trade near the Trend Line. This allows you to have a tighter         stop loss   on your trades — which improves your       risk to reward . But that’s not all… Because if you combine Trend Line with Support and Resistance, that’s where you find the best trading opportunities. Now you might wonder: “So when do I enter a trade?” Well, you can use reversal     candlestick patterns   (like the   Hammer, Bullish Engulfing, etc.) as your e
Owl Smart Levels MT5
Sergey Ermolov
4.31 (39)
MT4版本  |   FAQ Owl Smart Levels Indicator 是一個完整的交易系統,包含 Bill Williams 的高級分形、構建正確的市場波浪結構的 Valable ZigZag 以及標記準確入場水平的斐波那契水平等流行的市場分析工具 進入市場和地方獲利。 策略的详细说明 指示灯使用说明 顾问-贸易猫头鹰助手助理 私人用户聊天 ->购买后写信给我,我会将您添加到私人聊天中,您可以在那里下载所有奖金 力量在於簡單! Owl Smart Levels 交易系統非常易於使用,因此適合專業人士和剛開始研究市場並為自己選擇交易策略的人。 策略和指標中沒有隱藏的秘密公式和計算方法,所有策略指標都是公開的。 Owl Smart Levels 允許您快速查看進入交易的信號,突出顯示下訂單的水平並向您發送有關已出現信號的通知。 優點很明顯: 清楚地顯示主要和更高時間框架的趨勢方向。 指示儀器信號的出現。 標記開單、止損設置和固定利潤的水平。 沒有多餘的,只有必要的結構! ZigZag 表示全球趨勢的方向,因此也表示貿易方向。 市場反轉點的短線清楚地表明在什麼水平上構建斐波
Gold ATR MTF 5
Sergei Linskii
Gold ATR MTF - 這是一個很好的股票技術指標。 ATR(平均真實波動範圍)指標的演算法分析資產價格的變動,並透過在指定時間範圍 (D1) 的開盤價的指定百分比 (%) 中繪製相應水平來反映波動性。 符號價格變動方向和箭頭訊號的指標(紅色和/或藍色 D1 H4)是舒適且有利可圖的日內交易和/或倒賣的額外且重要的幫助。 對於外匯符號,每日利潤可以從 20 點起;對於黃金符號,每日利潤可以從 50 點起。 指標特點: 這是一個超級指標,具有 Magic、趨勢方向檢測器和兩個趨勢箭頭塊,可實現舒適且有利可圖的交易。 圖表上顯示用於切換方塊的紅色按鈕。 Magic 在指標設定中進行設置,以便您可以將指標安裝在顯示不同區塊的兩個圖表上。黃金 ATR MTF 可以放置在具有不同箭頭緩衝區(FP 和 SA)的兩個圖表上。 為此,您需要在設定中選擇不同的Magic,例如,一個Magic=999,另一個Magic=666。 然後您可以使用圖表上的紅色按鈕選擇箭頭緩衝區。在GOLD ATR MTF 中,只有當價格強勁波動時,水平(ATR) 才能小幅擴大,只有當價格強勁波動時,才能重新繪製趨勢方
我们创新的基本烛台形态仪表盘专为自动识别图表上的盈利烛台形态而设计。该仪表盘使用先进的算法实时扫描价格图表,并检测从经典到复杂的各种烛台形态。此外,它还有一个易于使用的界面,允许您在不同的时间框架上对检测到的形态进行可视化,从而轻松做出明智的决策/ MT4 版本 免费指标:   Basic Candlestick Patterns 包括谐波形态 看涨形态 Hammer  Inverse hammer Bullish engulfing Morning star 3 White soldiers 看跌形态 Hanging man Shooting star Bearish engulfing Evening star 3 Black crows 指标列 Symbol:   将显示所选符号 Pattern:   形态类型(锤子型、反向锤子型、看涨吞没型......) Bar:   自检测到该形态以来所经过的柱状图数量 Age (in minutes):   自检测到该形态以来的年龄 主要输入 Symbols :   从 "28 种主要货币对 "或 "选定符号
作者的更多信息
SBAHiLo
Umri Azkia Zulkarnaen
this is an indicator to clarify seeing Low and High in the market and is very useful for facilitating those who are studying technical price action this is a type of indicator that gives color to the candlestick where the indicator is divided into 3 colors red = bearish green = Bullish Gray = base this indicator can be used on the forex market or the mt5 binary market. https://t.me/SBA_FOREX_SIGNAL
Shadowbreaker clasic
Umri Azkia Zulkarnaen
This indicator is equipped with a risk and reward calculation, whether it is the calculation of lots to be used, the determination of the price of stop loss and take profit, and also the notification of whether the colors that occur can be used or not. You can adjust the risks that make you calm by changing the settings provided in the indicator menu. this indicator can work well using H1 time frame. You only wait for an indicator command when you want to open an position.
SBA scalping v75
Umri Azkia Zulkarnaen
筛选:
无评论
回复评论
版本 4.0 2019.05.29
this upgrader for last indicator. please use multitimeframe for maximal profit