Adament Levels Logic B
- 指标
- Sattiraju Kottapalli
- 版本: 5.0
- 更新: 4 十一月 2020
- 激活: 5
首先,我要感謝大家“Adamant Levels Logic A”取得的巨大成功
有關邏輯A的更多詳細信息,請參閱以下鏈接:
https://www.mql5.com/en/market/product/36082
在成功之後,我很有信心,這個“Adamant Levels Logic B”指標也將在您成功的交易運營商中發揮重要作用。
堅定級別簡介:
免責聲明:如果您正在尋找一個花哨,色彩鮮豔,引人注目的指示,請遠離。
沒有考慮價格可以保持,反彈或突破的水平,任何交易者都不能成為一個好交易者。
這些水平幫助交易者以更便宜的價格進入市場。它們可以是支撐阻力,需求供給,支點,斐波納契水平等。
經過多年對價格圖表的研究和分析,我發現很少有復雜的算法和邏輯來找出未來可能的價格行為。
在某些價格點上應用這些邏輯和算法,我達到了價格可以反彈或突破的水平。
我將它們命名為“Adamant Levels”。
是的,它們本質上是堅定的和靜態的。
價格被這些水平吸引並擊退。
這些是未來的價格行為水平,交易者可以通過更高的風險回報率進入市場。
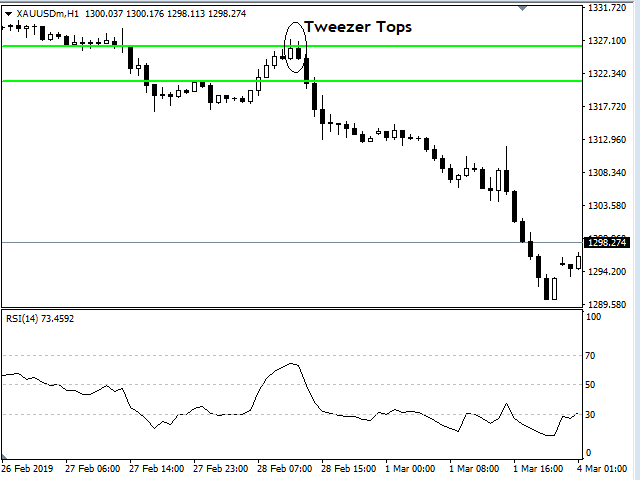
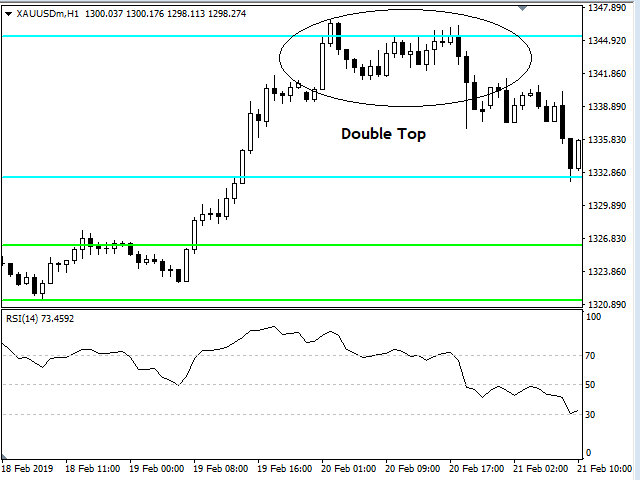
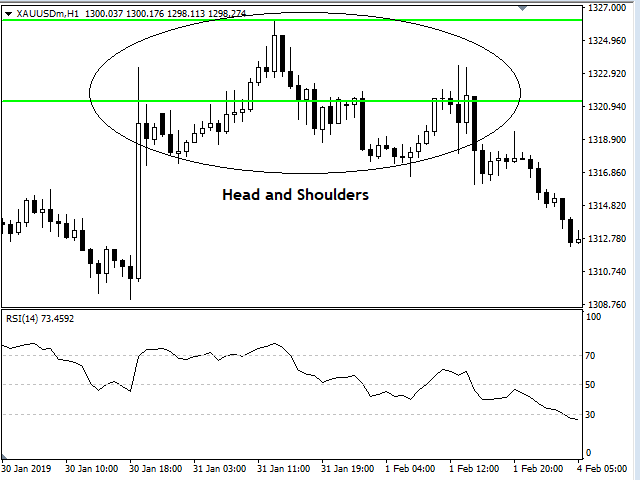
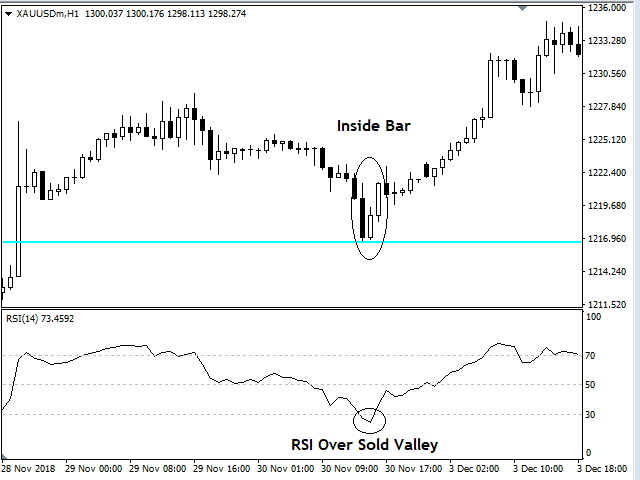
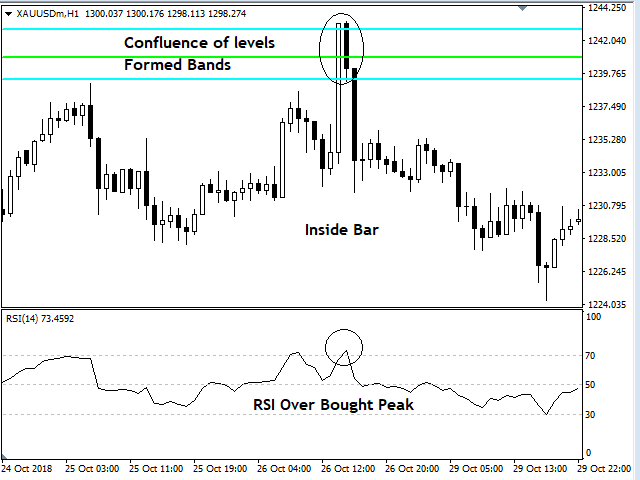
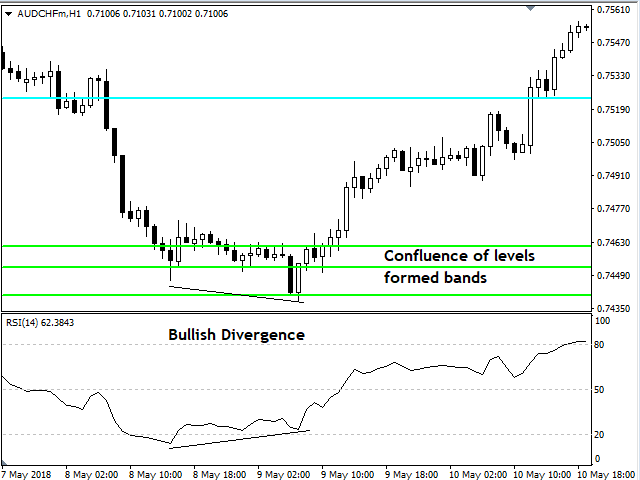
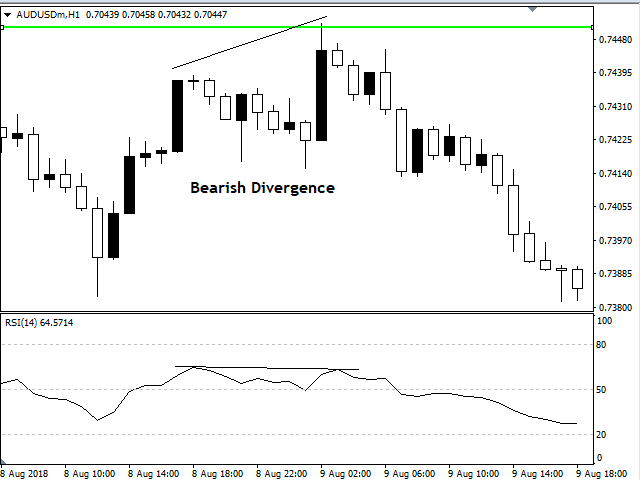
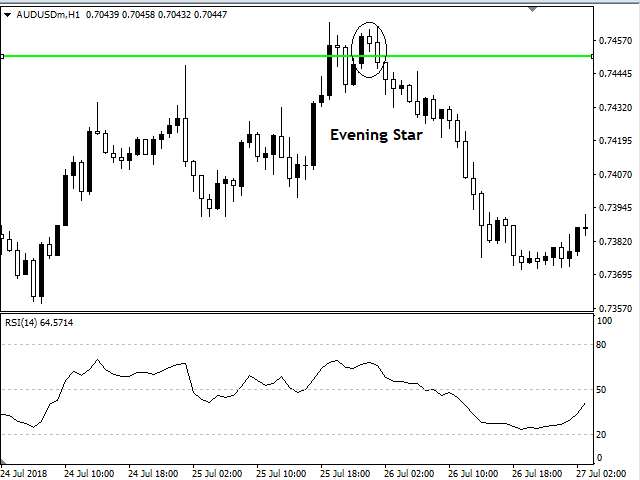
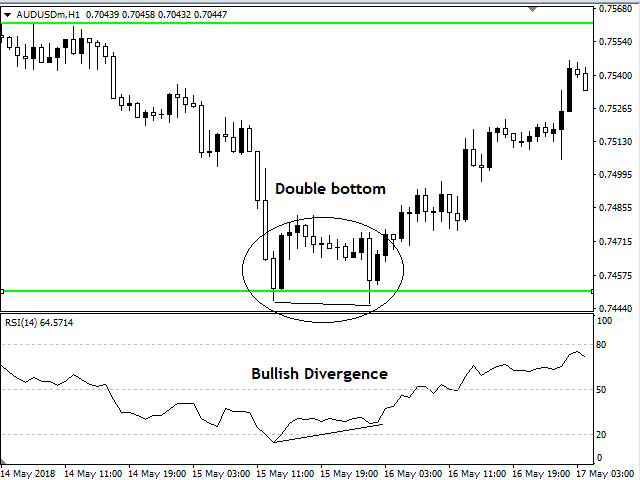
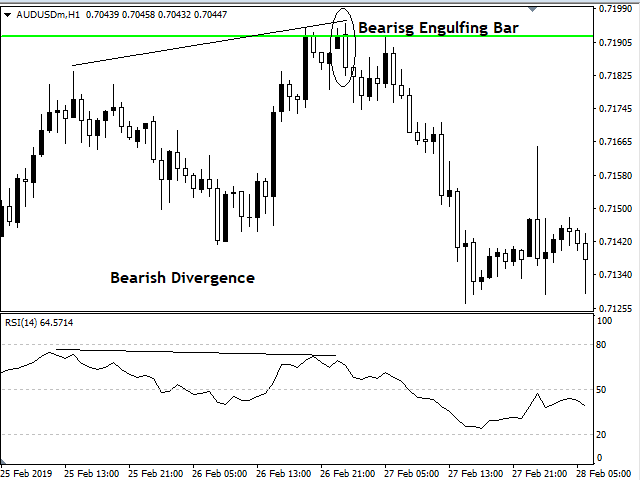
大多數觸發點如價格模式,圖表模式,收斂和分歧,趨勢線故障等都出現在這些“堅定的水平”上。
因此,等待在這些級別上發生觸發並輸入。
特別注意不同堅定程度的融合
特別注意RSI同時達到Adamant Levels和Over Sold,Over Bought區域的價格,然後是Price Patterns。
這些是您交易的每張圖表必須具有的水平。
該指標是根據我的第二個邏輯設計的,即“邏輯B”。
邏輯A和邏輯B完全不同。
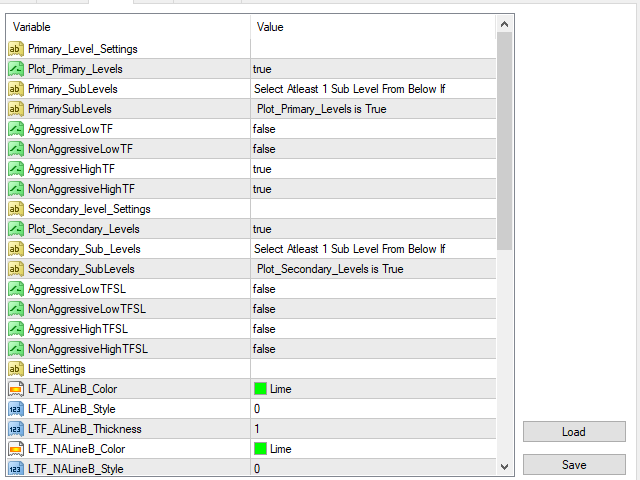
輸入參數:
輸入參數從符號(貨幣對)到符號不等。
默認設置適用於大多數配對。
如果交易者希望擁有更多級別,可以啟用次級別和低時間幀級別。
希望您對此指標的投資可以幫助您實現明亮的交易目標。


Good