版本 1.23
2023.04.21
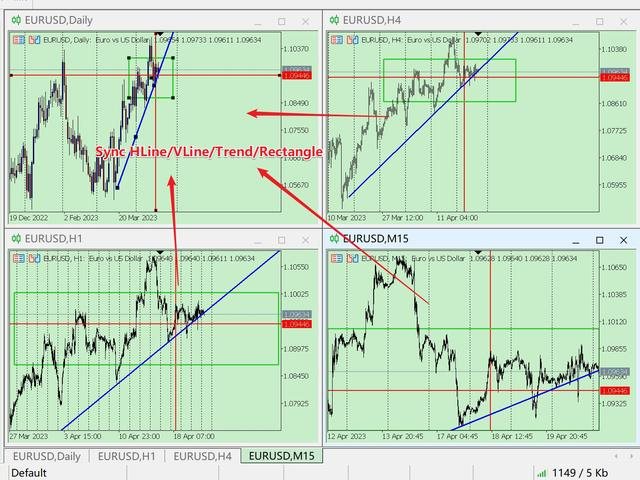
add the function to syn HLine / VLine / Trend / Rectangle
版本 1.22
2021.12.28
Add the function:
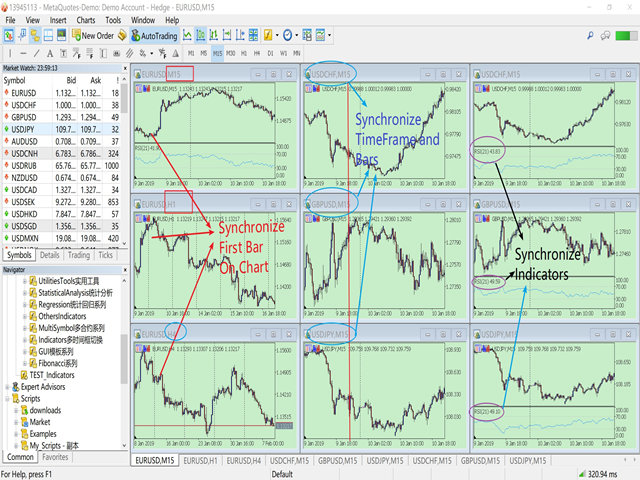
Whether To Synchronize Custom Indicators.
Note:
1. Custom indicators are based on the programming ability of the provider.
2. Synchronization of custom indicators is identified by name.
3. If you want to synchronize different parameters of the same custom indicator, the custom indicator must use the IndicatorSetString() code to set the indicator name with different parameters.
for example: SMA(5), SMA(10) is different parameters with same indicator. But some code only named them SMA.
4. If the provider does not set the indicator name with parameters through IndicatorSetString(), custom indicators with the same name cannot be superimposed. However, it does not affect the synchronization once.
版本 1.21
2020.06.06
recompiled for MT5 update.
版本 1.20
2020.04.30
add New Function:
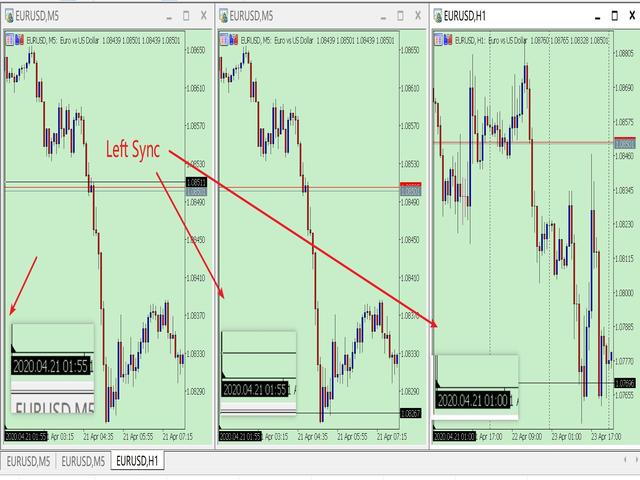
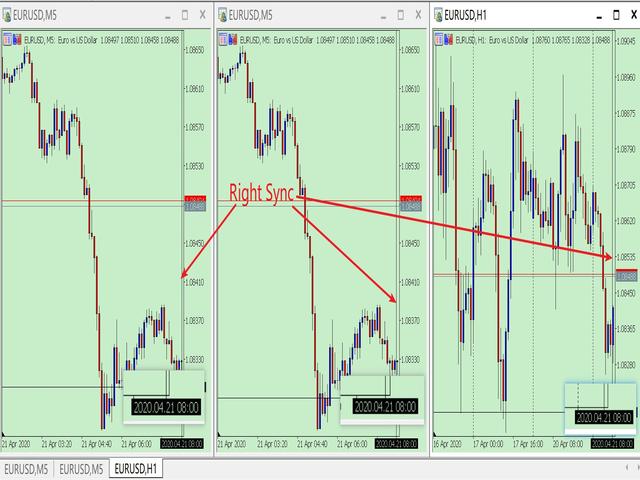
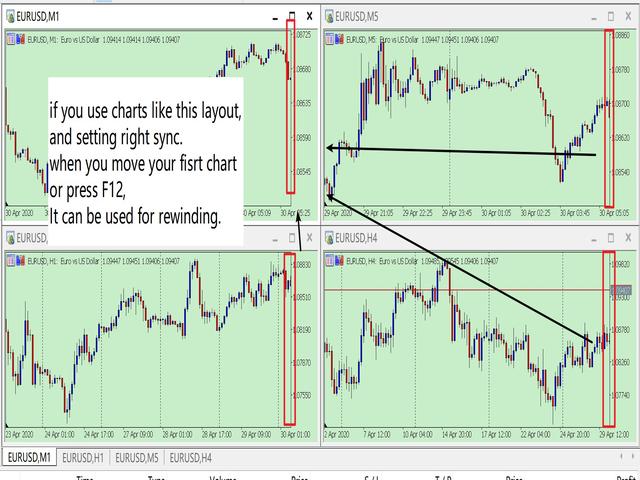
LeftSyn=true; //true: left synchronized / false: right synchronized
版本 1.10
2019.07.26
Now, after you have synchronized the system Indicators, you can increase or decrease the Indicators on other Charts.
This gives the indicator synchronization feature flexibility.
版本 1.9
2019.07.26
Fixed some bugs
版本 1.8
2019.07.23
Add the new function :
Is Lock Chart Start_Times And ChartScale
---true : the default setting just like previous version.
---false : after synchronize to the first chart, you can drag your other charts, and change ChartScale. If you operate the first chart again, Sync again.
Why add this function :
This feature makes synchronization flexible, You can also operate other charts while retaining the sync function.
版本 1.7
2019.07.22
Fixed some bugs.
版本 1.6
2019.07.22
fix some log
版本 1.5
2019.07.22
For some countries, network latency is high, which causes MT5 to load memory slowly. This version improves stability.
版本 1.4
2019.07.20
Added code feedback, You can now see feedback from Toolbox Experts.
Usually you don't need to pay attention to these feedbacks.
版本 1.3
2019.07.19
Increased stability
版本 1.2
2019.02.15
Add Synchronize Setting : ShiftSize
版本 1.1
2019.02.09
fix some log


用户没有留下任何评级信息