Plot Spread
- 指标
- Vladimir Tkach
- 版本: 1.0
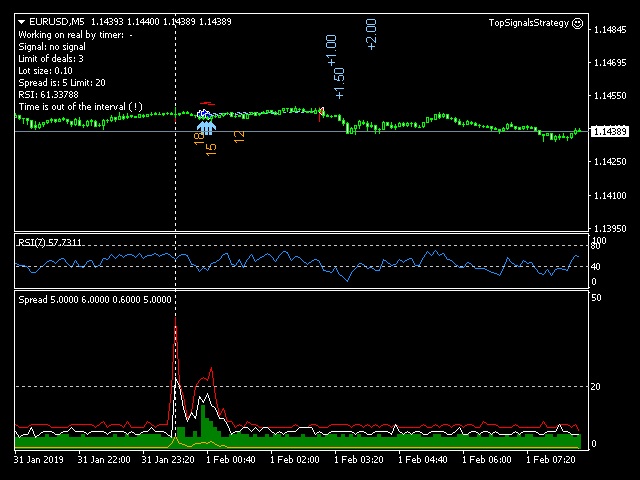
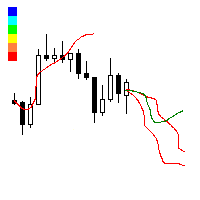
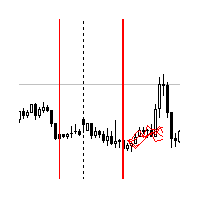
The indicator reads the current spread and displays it on the chart. The maximum value, the minimum value, the value at the time of opening the bar and the maximum value divided by 10 are displayed separately.
The indicator does not remember these values so the data will be lost if there is a change in the timeframe.
The indicator is useful for analyzing market volatility, comparing the spread between brokers and different types of accounts.
By default:
Red line - maximum spread;
Green bar - minimum spread;
White line - spread at the time of bar opening;
Yellow line - the maximum spread value divided by 10.

