Netsrac SR Dashboard Free
- 指标
- Carsten Pflug
- 版本: 2.10
- 更新: 21 十月 2020
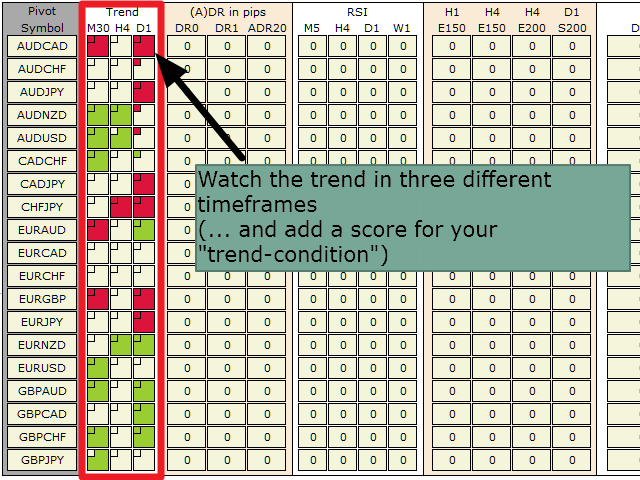
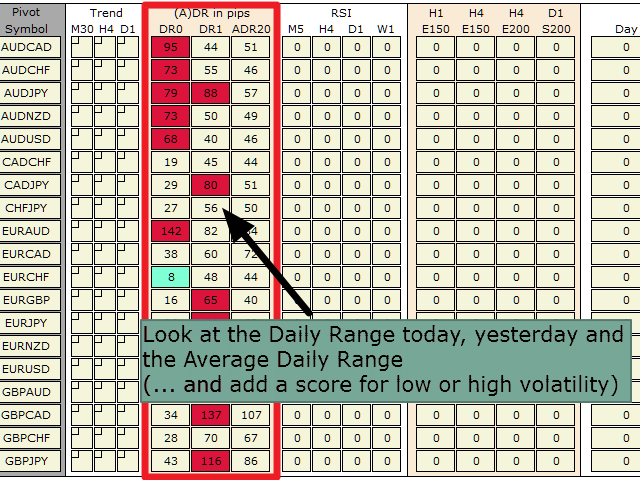
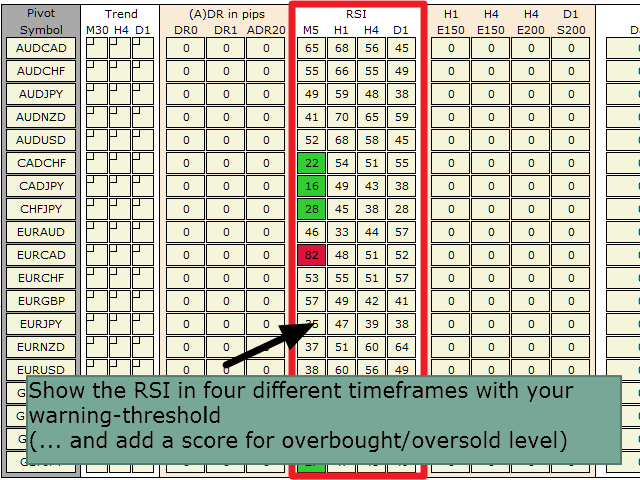
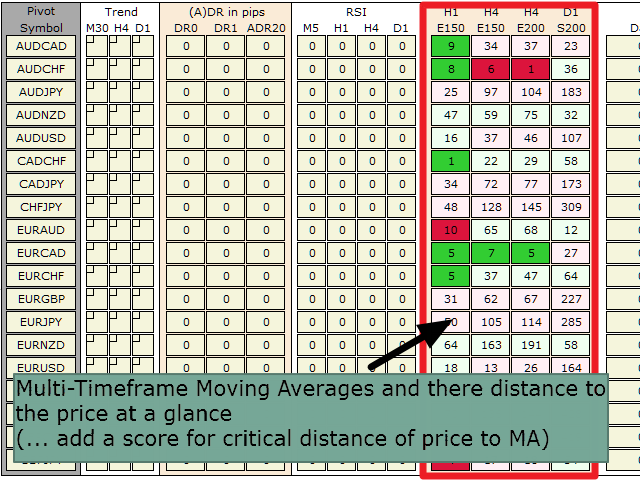
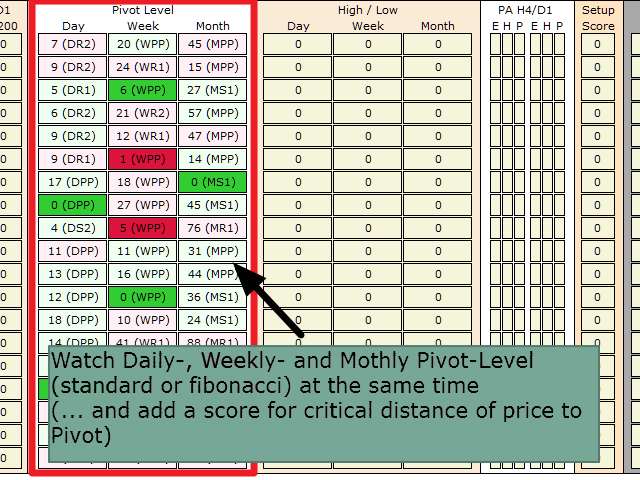
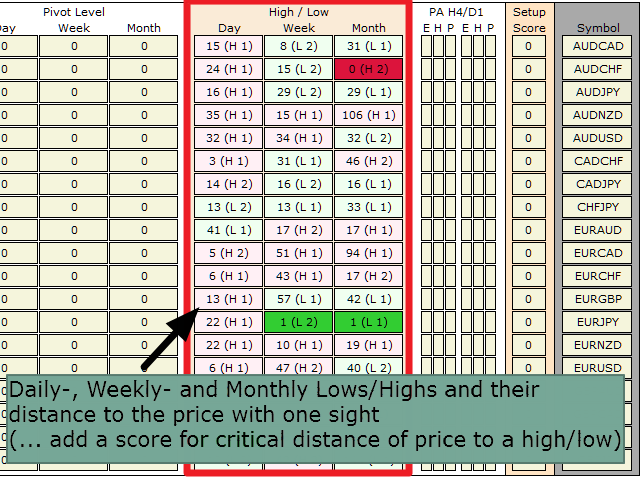
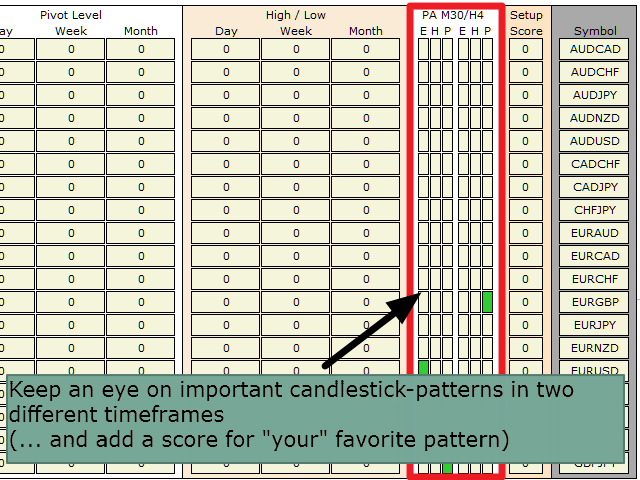
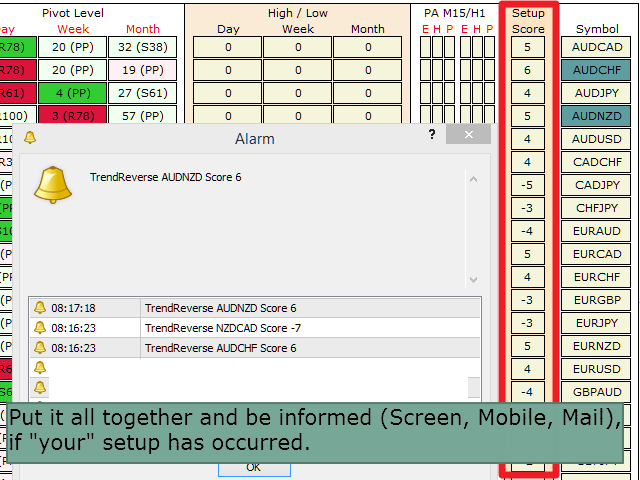
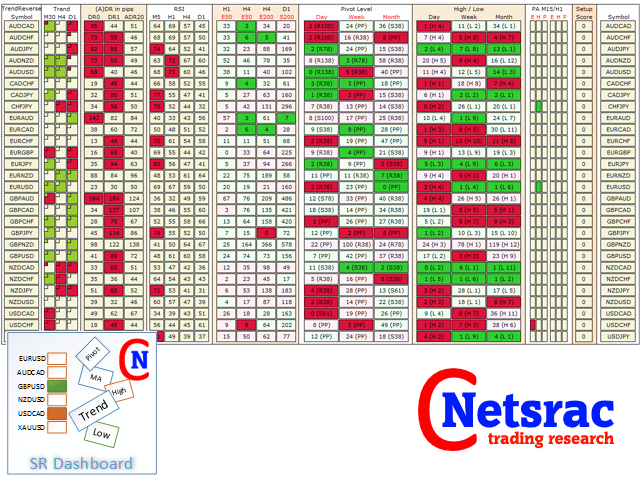
With the SR Dashboard, you get a powerful tool to control some of the most important information in trading. Assemble a setup according to your strategy and get informed as soon as this setup is valid. Assign scores to defined conditions and let the Dashboard find them. Choose from Trend, Average Daily Range, RSI, Moving Averages, Pivot (Daily, Weekly, Monthly), Highs and Lows, Candlestick Patterns.
Note: This indicator is the free version of the Netsrac SR Dashboard. This version only supports two Symbols - no alarms are triggered. You find the full version at https://www.mql5.com/de/market/product/34855
What can you do with this tool?
Use the dashboard as a powerful tool for your discretionary trading. You will be able to save a lot of time on the screen.With the SR Dashboard, you will be able to find some interesting trading setups in a faster and smarter way. Some of these setups are described in our new blog series:
- Using the "Netsrac SR Dashboard" (quick guide)
- Trading Pinbars
- Quick Set-Gets with the Dashboard
- Trade the Engulfing Pattern
- Weekly pivot as potential reversal points
- Scalping the short term trend
- Trend trading with important moving averages
- Volatility outbreak
- ... (may continue)
With the SR Dashboard, you will be able to find some interesting trading setups in a faster and smarter way. Some of these setups are described in our new blog series:
- Using the "Netsrac SR Dashboard" (quick guide)
- Trading Pinbars
- Quick Set-Gets with the Dashboard
- Trade the Engulfing Pattern
- Weekly pivot as potential reversal points
- Scalping the short term trend
- Trend trading with important moving averages
- Volatility outbreak
- ... (may continue)
Manual