Rsi Ma Bands
- 指标
- Philip Pankaj Suthagar
- 版本: 1.10
- 更新: 1 四月 2019
- 激活: 5
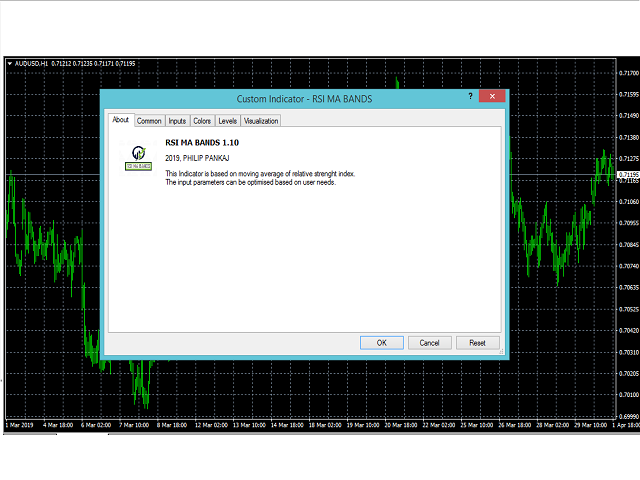
This Indicator is build on value of Relative Strength Index and Moving average of relative strength Index.
We have calculated bands with respect to Moving average of Relative strength Index.
Trading strategy: https://www.mql5.com/en/blogs/post/725691
Why use Rsi Ma Bands?
- Great for novice traders as well as experienced traders.
- Low risk entries.
- Doesn't repaints.
- No additional Indicator is needed.
- Its a trading strategy itself.
- It is perfect for scalping trend reversal trades.
- Simple and easy to use.
- Works in both trending and non trending markets.
- Popup Alerts, Push Notification and Email alerts.
- Can be integrated in Expert Advisors.
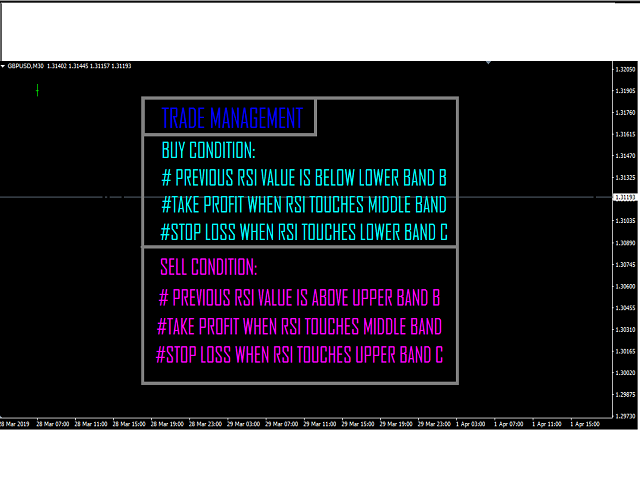
Trade conditions:
BUY CONDITION:
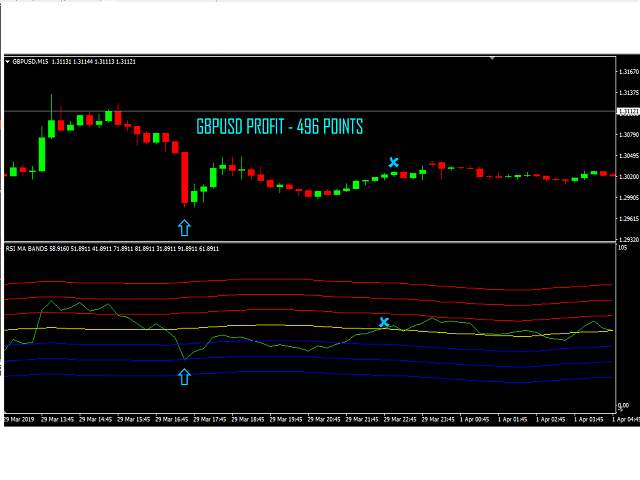
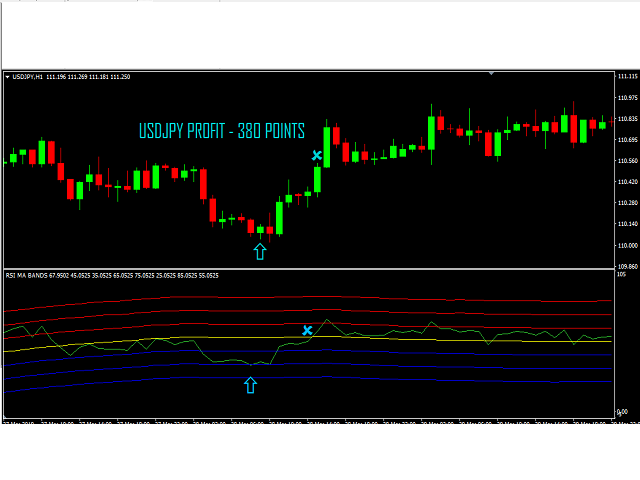
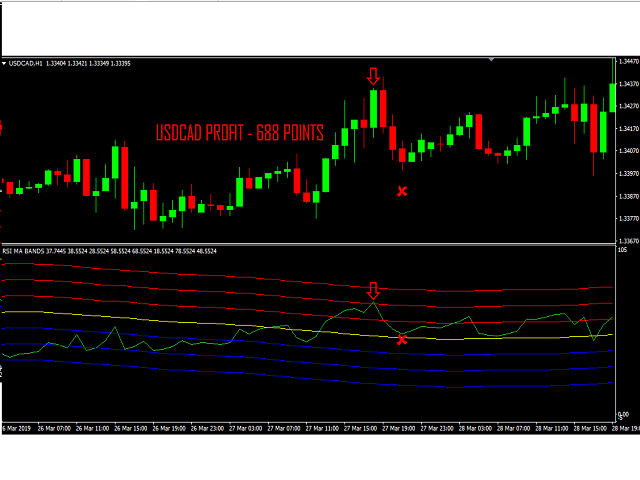
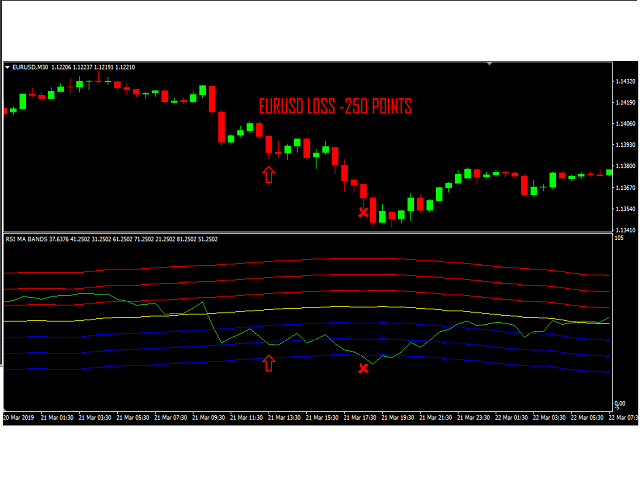
*last rsi value is below lower band B.
*takeprofit when rsi touches middle band.
*stoploss when rsi touches lower band C.
SELL CONDITION:
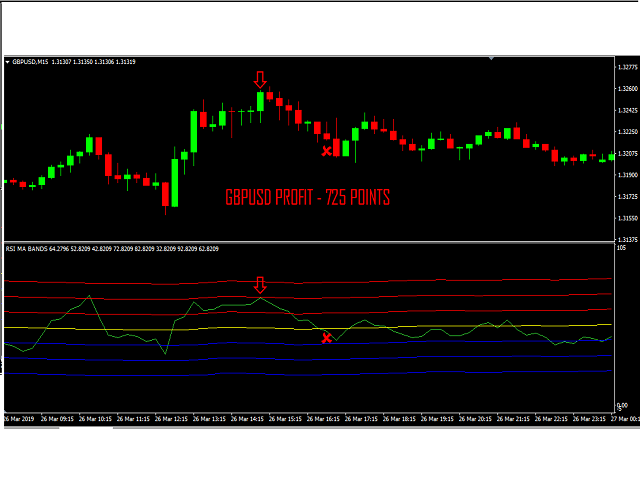
*last rsi value is above upper band B.
*takeprofit when rsi touches middle band.
*stoploss when rsi touches upper band C.
Alerts:
*Alerts pop up when rsi reaches any of the bands with pip sensitivity parameter.
Advantage:
*Non Repaint Indicator.
*We can find dynamic trend reversals of rsi.
*We can predict next candle close.
*We can predict bullish/bearish divergence.
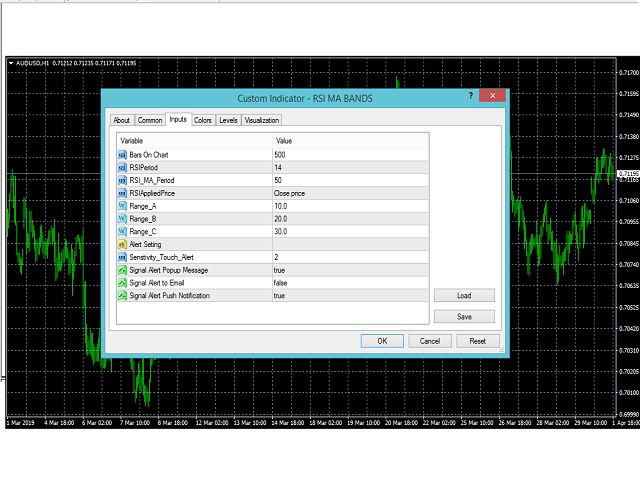
*All external parameters are given for customization of users. i.e)check screenshot for details.
*Dynamic Oversold and OverBought region.

