GJPivot support and resistance
- 指标
- David Jumbo
- 版本: 1.0
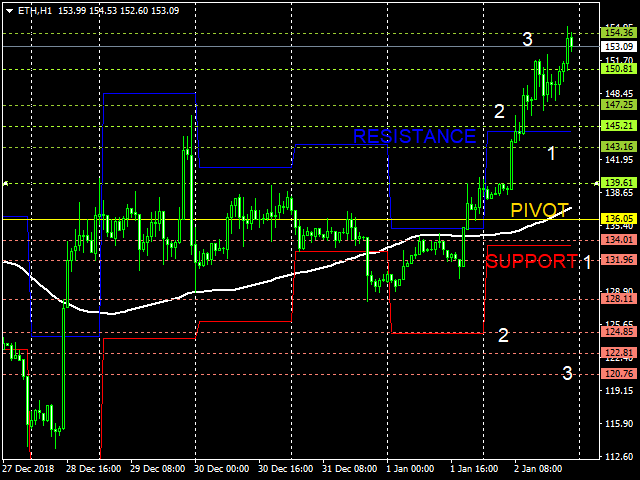
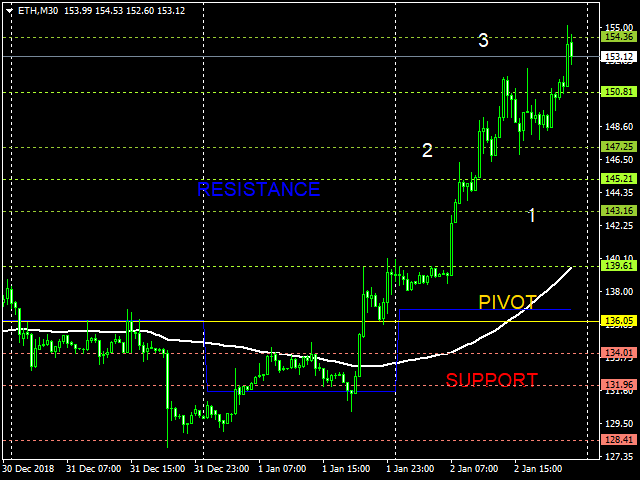
A.此透视指示器显示透视价格的天数。
B.它还显示电阻R0.5,R1,R1.5,R2,R2.5和R3
C.它还显示支持S0.5,S1,S1.5,S2,S2.5和S3
INPUT:
在输入下,您将看到3个变量
1.ExtFomula。在这里,您可以在图表窗口的阻力或支撑位置设置首选出口,其值不超过1或2或3。 1表示在阻力或支撑件1处的出口.2表示在阻力或支撑件2处的出口.3表示在阻力或支撑件3处的出口。
2. ExtHowmanyDays。默认值为30天。如果在ExtFomula中输入1或2或3,过去三十天的退出支持和阻力价格将显示在图表窗口中
3.ExtDraw。选择“true”以允许在图表窗口或副签证上绘制支持和阻力。
好处
1.指示器允许您查看支持3或阻力3
2.指标允许您在任何选定的阻力或支撑位置设定图表上的退出点。
3.支撑位或阻力位的设定出口可以作为获利和/或止损,具体取决于当前的趋势。
4.通过将Exitfomula设置为1或2或3,指标将清楚地了解每日价格可能上涨或下跌的幅度。
Excellent and easy to use. I replaced the other pivot indicator that I use with GJPIVOT. Thanks.