• 概述
  • 评论
  • 评论
  • 新特性

MACDXover

This indicator helps you to find price that may cause MACD Signal crossover on the current bar.. These crossover points are depicted in form of stars (like Parabolic SAR).
prevEMA line also helps you to decide the trend.

Get 20% OFF for rents for 1 year!

How to use:
MACDSignalStars (Violet) stars displayed are the the prices that make the MACDmain = MACDsignal.

  • If the close price is higher than the star, then MACDmain > MACD signal.
  • If the close price is lower than the star, then MACDmain < MACD signal.
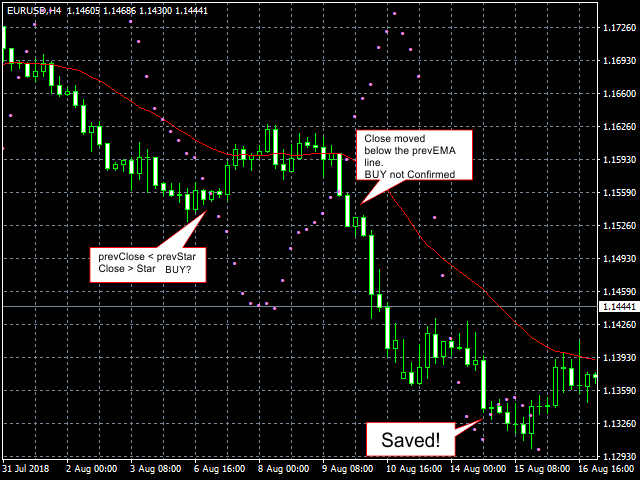
BUY SIGNAL
  • Previous Close is lower than Previous Star.
  • Current Close is higher than Current Star.
  • Current Close is above the prevEMA line several bars later.
  • Both Stars are not below the candles inspected.
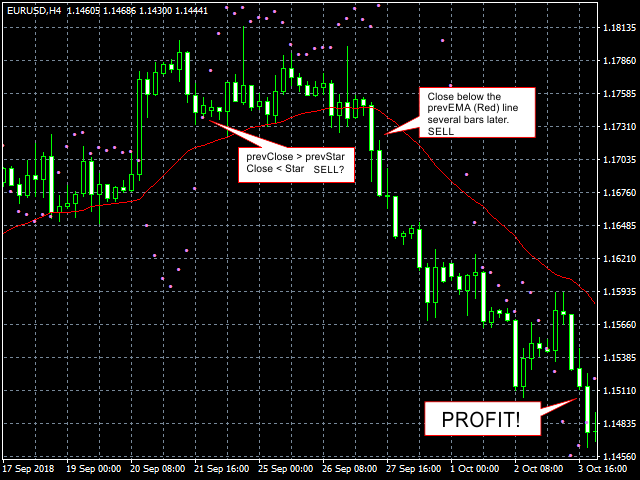
SELL Signal
  • Previous Close is higher than Previous Star.
  • Current Close is lower than Current Star.
  • Current Close is lower the prevEMA line several bars later.
  • Both Stars are not above the candles inspected.

Input Description:
  • MA_Period_short: Fast EMA used for MACD. Must be larger than 1.
  • MA_Period_long: Slow EMA used for MACD. Must be larger than MA_Period_short.
  • MACDperiod: SMA used for MACD signal. Must not be larger than MA_Period_long
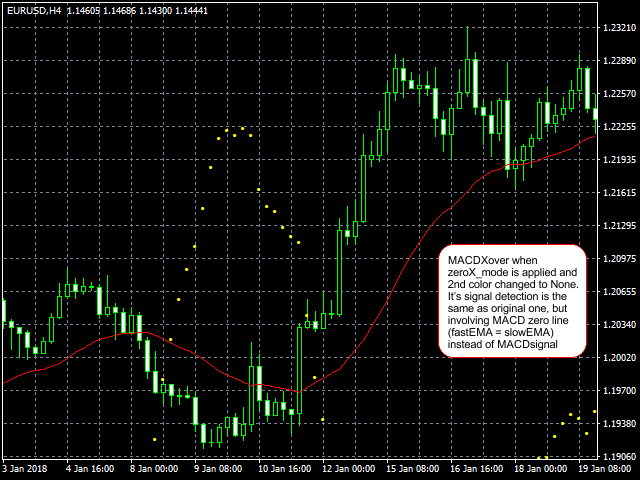
  • zeroX_mode: In addition of MACD Signal crossover, the program also draw MACD Zero crossover points.
  • applied_price: Prices to be applied to the indicator. You can apply Close, High, or Low price.

Output Description:
  • prevEMA: A long-term EMA that shifted by 1 bar forward. Use this to confirm signals generated by this indicator.
  • MACDSignalStars: MACD-Signal Crossover points. The main indicator.
  • MACDZeroStars: MACD-Zero Crossover points. Not used by default. It's signal interpretation is similar to BUY and SELL signal given above.
推荐产品
为您介绍MQL4的Donchian通道指标,这是一个强大的技术分析工具,旨在提升您的交易成功率。该指标由四条线组成,代表了在指定时期内价格运动的上限和下限。 通过Donchian通道指标,您可以轻松识别市场潜在的突破和反转。上线显示指定时期内的最高点,而下线代表最低点。这两条线之间的空间形成一个通道,为您提供了有关资产交易价格范围的有价值见解。 但这还不是全部 - 我们进一步改进了这个令人难以置信的指标。我们的修改允许您按照一定百分比(表示为'shadowTop'和'shadowBottom')减小通道宽度。通过缩小通道,您可以更敏锐地感知价格波动,并准确定位入场和出场点。 无论您是经验丰富的交易者还是初学者,带有减小通道宽度的Donchian通道指标都是您交易工具箱中必备的工具。它能够让您基于市场波动和价格行为做出明智的决策。 不要错过将您的交易推向新高度的机会。体验带有减小通道宽度的Donchian通道指标的强大功能,释放您的交易潜力吧。
This Signal Zero Risk indicator uses Donchian channel and ATR indicators. This trend tracking system uses historical data to buy and sell. This indicator does not repaint. The point at which the signal is given does not change. You can use it in all graphics. You can use it in all pairs. This indicator shows the input and output signals as arrows and alert. Open long deals on blue arrows Open short deals on red arrows It tells you that you should quit the transaction. Parameters Alerts -  noti
MACD (short for Moving Average Convergence/Divergence) is one of the most famous and oldest indicators ever created and is widely used among beginners . However, there is a newer version of the MACD that is named Impulse MACD  which have less false signals than the standard MACD. Classic MACD helps us to identify potential trends by displaying crossovers between two lines. If MACD line crosses above the Signal line it shows us that the market is potentially up trending and that it would be a go
Trend Divergence Indicator: Your Essential Tool for Market Analysis The Trend Divergence Indicator is a powerful tool designed to assist traders in identifying market trends and pinpointing entry points with precision. By leveraging price divergence, this indicator enhances your trading strategy, offering reliable insights and filtering unnecessary signals. Key Features and Benefits of the Trend Divergence Indicator Accurate Trend Analysis: The Trend Divergence Indicator uses price divergence t
This indicator is based on the standard MACD indicator, but showing the changes up and down colored. It is a nice assistance to visualize our Expert MAGIC MACD. MAGIC MACD MT4: https://www.mql5.com/en/accounting/buy/market/41144?period=0 MAGIC MACD MT5: https://www.mql5.com/en/accounting/buy/market/41151?period=0 Inputs in the Indicator: Fast EMA: standard is 12 Slow EMA: standard is 26 Signal: depending on what you want to see. For the MAGIC MACD the standard is 1 in common settings: Fixe
RSI Jurik
Augustine Kamatu
Introducing RSI Jurik—an innovative indicator designed to revolutionize your forex trading strategy by combining custom moving averages based on the Relative Strength Index (RSI) with the MetaTrader 4 indicator, RSI. Jurik moving averages are renowned for their accuracy and reliability in analyzing price movements in the forex market. They provide traders with smoother representations of price action, reducing noise and offering clearer signals for identifying trends and potential reversals.
FREE
Golden Range 2
Damian Mateusz Wojtowicz
Golden Range 2 is one of the top entry indicators securing its future with its results.  Indicator settings: Points = how precise pattern detection is AlertConfirmation = turn on(true) off(false) alert CalculatedBars = how many bars will be calculated Please leave Positive comments, reviews. Buffer 0 Buy Arrow, Buffer 1 Sell Arrow, Buffer2 Buy Signal(Value:1/0), Buffer3 Sell Signal(Value:1/0)  Buy Green, Sell Red
A top-quality from the famous XSuper Trend indicator. It is completely loyal to the original algorithm, and implements many useful features Which includes Trend Indicators as Filters like MACD,CCI and Alligator. The Chefs Super Trend Plus Indicator is a great way to identify the current market trend. The indicator shows a clear distinction between uptrends and downtrends. The indicators has optional filters for sound signal. Suitable for the following trending pairs: EUR/USD, GBP/USD, USD/JPY,
HeikenashiSmoothing
Rodolfo Leonardo De Morais
Heiken ashi Smoothing in separate window MTF The color of the Heiken-Ashi candles depend on their shadows. The advantage of the Heiken-Ashi chart is that the trend is determined very simply, the upward-facing sails are blue, and the downward-tendency sails are red. For profitable trading it is necessary to use it with the standard candles (make analyzes) and with the other indicators. Indicator Parameters TimeFrame - Graphic time being 0 = Current graph time, 1 = M1, 5 = M5, 15 = M15, 30 = M30
This product is a part of  ON Trade Waves Patterns Harmonic Elliot Wolfe you can test free version on EURJPY from this link  Wolf Waves Indicator 探索 Wolf Waves - 您的终极交易工具! 您是否正在寻找一种强大的工具,能够轻松地在任何时间框架上识别 Wolf Waves?不用再找了!我们的 Wolf Waves 指标可以轻松完成这项任务。以下是为您呈现它的理由: 主要特点: 自动检测: 我们的 Wolf Waves 指标使用复杂的算法自动查找关键点并在您的图表上绘制相应的线条。不再需要手动搜索模式。 用户友好: 无论您是专业交易员还是对 Wolf Waves 还不熟悉,我们的指标都非常易于使用。 精准性: 它非常精确,降低了虚假信号的数量,提高了您的信心。 信息丰富: 该指标不仅限于模式检测。它还提供入场点、止损水平和利润目标等重要交易信息,帮助您做出明智的交易决策。 适用于 EA: 如果您进行自动化交易,此指标可以无缝集成
This indicator combines double bottom and double top reversal chart patterns together with detection of divergences between the price chart and the Momentum oscillator. Features Easily detect strong reversal signals Allows to use double top/bottom and Momentum divergence signals combined or independently Get email and/or push notification alerts when a signal is detected Custom colors can be used The indicator is not repainting Can easily be used in an EA (see below) Inputs ENABLE Double Top
TSO Top Bottom Divergence MACD
Dionisis Nikolopoulos
5 (1)
This indicator combines double bottom and double top reversal chart patterns together with detection of divergences between the price chart and the MACD oscillator. Features Easily detect strong reversal signals Allows to use double top/bottom and MACD divergence signals combined or independently Get email and/or push notification alerts when a signal is detected Custom colors can be used The indicator is not repainting Can easily be used in an EA (see below) Inputs ENABLE Double Top - Botto
Provides instant signals on the chart in panel form. Equipped with signal description and trading analysis tools such as drawing auto trendlines, support/resistance area, regression channel, Fibonacci levels, Pivot levels and current signal price, signal time, signal expiry and stoploss recommendation. Also sending alert messages to all available mt4 alert tool. A detailed description panel provides information about where the signal comes from and what indicators are behind the signal. Includin
这种用于从无穷远衡量货币强弱的创新指标是长期交易的黄牛和交易者不可或缺的助手。 分析货币强弱的系统早已被世界领先的交易者所熟知并在市场上使用。 没有这种分析,任何套利交易都是不完整的。 我们的指标很容易确定基础货币相对于彼此的强弱。 它显示所有或当前货币对的折线图,允许即时分析和搜索最强的入口点。 该指标直观,允许您快速找到并切换到任何一对,具有可放置在地下室和主图表上的移动面板。 通知货币强度变化的计时器模式使交易者有机会在手机上收到通知。  使用货币功率计无穷大指示器的几种策略: 1. 使用货币强度的线性显示图表搜索交叉点作为新兴趋势的信号 2. 在趋势反转信号出现后,向强势货币方向反弹 3. 使用货币强度发散分析扭转当前趋势 4. 使用其他无限指标向强势货币方向交易 
Trend Transition is a hybrid indicator, as it is based on signals from several well-known products: RSI and MA. MA is a trend indicator of the average true range, which determines the range of minimum and maximum price fluctuations, as well as closing prices. RSI is an indicator of the family of oscillators. The indicator helps to calculate the oversold and overbought levels of a trading instrument. When a trend changes, the Trend Transition indicator uses a color alarm: blue - when changing
RSI Divergence Scanner
Reza Aghajanpour
4.22 (9)
** All Symbols x All Timeframes scan just by pressing scanner button ** ***Contact me after purchase to send you instructions and add you in "RSI scanner group" for sharing or seeing experiences with other users. Introduction RSI divergence is a main technique used to determine trend reversing when it’s time to sell or buy because prices are likely to drop or pick in the charts. The RSI Divergence indicator can help you locate the top and bottom of the market. This indicator finds Regular div
Chart Patterns Detect 15 patterns (Ascending Triangle, Descending Triangle, Rising Wedge, Falling Wedge, Bullish Flag, Bearish Flag, Bullish Rectangle, Bearish Rectangle Symmetrical triangle, Head and Shoulders, Inverted Head and Shoulders, Triple top, Triple Bottom, Double Top, Double Bottom) Use historical data to calculate the probability of each pattern to succeed (possibility to filter notification according to the chance of success) gives graphic indication about the invalidation level and
PZ Divergence Trading
PZ TRADING SLU
5 (2)
棘手的发现和频率稀缺是最可靠的交易方案之一。该指标使用您喜欢的振荡器自动查找并扫描常规和隐藏的发散。 [ 安装指南 | 更新指南 | 故障排除 | 常见问题 | 所有产品 ] 容易交易 发现常规和隐藏的分歧 支持许多知名的振荡器 根据突破实现交易信号 显示适当的止损和获利水平 可配置的振荡器参数 可自定义的颜色和尺寸 按条形过滤大小差异 实现绩效统计 它实现了电子邮件/声音/视觉警报 为了提供广阔的市场前景,可以使用不同的振荡器在同一张图表中多次加载该指标,而不会产生干扰。该指标支持以下振荡器: RSI CCI MACD OSMA 随机 动量 很棒的振荡器 加速器振荡器 威廉姆斯百分比范围 相对活力指数 由于差异可能会扩大很多,尤其是在外汇市场中,因此该指标产生了转折:它在等待交易突破之前等待donchian突破确认差异。最终结果是带有非常可靠的交易信号的重新粉刷指示器。 输入参数 幅度:用于寻找差异的之字形周期 振荡器-选择要加载到图表的振荡器。 突破期-交易信号的突破期,以柱为单位。 发散类型-启用或禁用发散类型:隐藏,常规或两者。 最小散度单位为条形-最
The trader uses the Trend for Neuro indicator to determine the market situation. This is a trending algorithm that is convenient to download, install and use. The algorithm with acceptable accuracy generates input signals and output levels. Strategy for trend trading, filtering and all the necessary functions built into one tool! By launching the indicator, the user will see only two types of arrows that can change color to blue during an uptrend, to red during a downtrend there is no uncertaint
Binary Option Signal
Yaroslav Varankin
Indicator for binary options arrow is easy to use and does not require configuration works on all currency pairs, cryptocurrencies buy signal blue up arrow sell signal red down arrow tips do not trade during news and 15-30 minutes before their release, as the market is too volatile and there is a lot of noise it is worth entering trades one or two candles from the current period (recommended for 1 candle) timeframe up to m 15 recommended money management fixed lot or fixed percentage of the depo
SFO Trend Racer
Tevin Marshall
5 (1)
SFO Trend Racer system is a trend indicator created by the CEO and Founder of " Simple Forex Options ", Tevin Marshall . It serves 6 different functions all in one. It shows the trader the entry signals as well as exit signals, whether it is a take profit or a stop loss. It also uses trend filters and signal confirmations so that the trader is able to make the most logically fit decision. Trend Racer uses various filters and specific settings from a plethora of indicators. The beauty in this ind
这是一套原创的、敏捷型、极佳趋势系统。无论您是刚入门的交易新手还是专业级的交易人士,这套指标均可助您快捷及时的追踪市场趋势的最新变化。它具有以下特点: 使用方法极简单,即插即用,且所有趋势分析结果的显示方式一目了然 ; 不需配置 任何功能参数 ,趋势追踪指标将根据市场数据自动分析显示日/周/月级别的趋势大方向; 本日,本周及当前月度的趋势信息同时显示在同一个图表窗口中; 不依赖于任何其他传统/经典指标的数据 ; 支持 MT平台的 所有交易品种; 支持5分钟到日线的各级图表(MT5平台用户没有任何限制); 这套指标 采用特有的市场行为分析算法,以不同于传统趋势分析方法的维度,快速辨识即将形成的趋势。因此您 可以将本指标结合任何其他经典分析方法一起使用,从多方角度衡量您的交易决策。
Reservoir mt4
Ivan Simonika
Reservoir is a reversal indicator and is part of a special category of instruments. The indicator not only analyzes the price movement, but also indicates the points of possible reversals. This contributes to the quick and optimal opening of buy or sell orders (depending on the current situation). In this case, the historical data of the analyzed asset is necessarily taken into account. It is the correct implementation of such actions that in many ways helps traders make the right decision in t
ZhiBiCCI MT4
Qiuyang Zheng
【ZhiBiCCI】指标适合所有的周期使用,也适合所有的市场品种。 【ZhiBiCCI】绿色实线是逆转看涨背离。绿色虚线是经典的看涨背离。 【ZhiBiCCI】向红色实线是反向看跌背离。红色虚线是古典看跌背离。 【ZhiBiCCI】可以在参数里面设置(Alert、Send mail、Send notification),设置为(true)就可以发送即时信号到警报窗口、电子邮件、即时消息。 参数设置说明: 【displayAlert】:这是警报开关,设置成true,如果出现箭头就会自动警报提示;设置成false,则不会警报提示。 【sendmail_NO_OFF】:这是发送邮件的开关,设置成true,如果出现箭头就会发送邮件到你在MT4设置好的邮箱里面;设置成false,则不会发邮件。 【sendnotification_NO_OFF】:这是发送即时消息的开关,设置成true,如果出现箭头就会发送消息到你的移动设备;设置成false,则不会发消息。 更多好用的指标网址: https://www.mql5.com/en/users/zhengqiuyang/seller
Bento Market Structure
Gede Hendra Saputra
Overview Automated smart money market structure identification following smart money concept and inner circle trader concept, it gives an unprecedented edge on your smart money and market structure analysis by automatically identifies valid market structure using smart money concept: Identify impulsive and corrective moves Identify valid pullbacks built by impulsive and corrective market moves Idenitfy bearish or bullish leg and their inducements for smart money concept Identify valid market st
Gann 方块指标是一种强大的市场分析工具,基于 W.D. Gann 在其“市场预测数学公式”一文中介绍的数学概念。该指标融合了与平方数(如 144、90 和 52)有关的 Gann 技术,以及平方 9。此外,它还融入了  关于如何将平方 9 与通道和星形图案结合使用的方法。 用户手册和使用方式: 在使用该指标之前,我们建议您阅读用户手册,并与我们联系以获得任何澄清。您可以在我们的网站上找到完整的用户手册。 该指标提供了 MT5 的完整版本供购买,也提供了 MT4 的免费版本供测试。提供了两个版本的链接供您方便使用。 主要特点和功能: Gann 方块指标为您的交易环境提供了全套工具,使您能够基于几何图案和 Gann 的概念做出明智的决策。以下是主要特点: 平方 9 分析: 该指标可以绘制与平方 9 有关的各种元素,包括水平线、星形图案、网格、Gann 扇形等。这在您的图表上提供了 Gann 的几何概念的视觉表示。 Gann 方块: 该指标绘制了 Gann 方块 52、90 和 144,使您能够可视化和分析它们与价格走势的关系。 自由 Gann 星形图案: 该指标使您能够直接在图表上绘制
Signal From Level
Yaroslav Varankin
Binary Options Support Resistance Indicator This indicator is designed for binary options trading and effectively shows retracements from support and resistance levels. Signals appear on the current candle. A red arrow pointing downwards indicates a potential selling opportunity, while a blue arrow pointing upwards suggests buying opportunities. All that needs adjustment is the color of the signal arrows. It is recommended to use it on the M1-M5 timeframes as signals are frequent on these timef
BeST_Profit Taker Exits is a Metatrader Indicator based on the corresponding vital part of Jim Berg's Trading System.It timely locates the most likely points/bars of significant Profit Taking and can be easily used as an add-on to any Trading System/Method . The Indicator consists of 2 Take Profit lines deriving as (MA ± times the ATR) usually the upper one above the prices (for Long Trades) and the lower one below prices (for Short Trades). When the Close (or High by choice) of a bar is above
Smart Indicatorl
Mustain Jiddan Mubarak Zaka
The Indicator Has signal with wait ,  Ready To Buy and Ready To Sell to make you ready to execute when signal coming , it very easy to use and very profitable , good for forex , Binary or crypto and GOLD , you just wait and execute , no need to analysis , because it already analysis by indicator , for exsample Wait than ready to buy or ready to sell than buy or sell you just entry as per instruction of indicator , very easy and usefull
Haine
Yvan Musatov
Haine is a reversal indicator that is part of a special category of instruments. The indicator not only analyzes the price movement, but also indicates the points of possible reversals. This facilitates fast and optimal opening of buy or sell orders (depending on the current situation). In this case, the historical data of the analyzed asset must be taken into account. It is the correct execution of such actions that largely helps traders to make the right decision in time and get a profit. T
该产品的买家也购买
Gann Made Easy
Oleg Rodin
4.88 (102)
Gann Made Easy 是一个专业且易于使用的外汇交易系统,它基于使用先生理论的最佳交易原则。 W.D.江恩。该指标提供准确的买入和卖出信号,包括止损和获利水平。您甚至可以使用推送通知在旅途中进行交易。 购买后请联系我!我将免费与您分享我的交易技巧和丰厚的红利指标! 您可能已经多次听说过江恩交易方法。通常 Gann 的理论不仅对于新手交易者而且对于那些已经有一定交易经验的人来说都是非常复杂的东西。这是因为江恩的交易方法在理论上并不那么容易应用。我花了几年时间来完善这些知识,并将最好的原则应用到我的外汇指标中。 该指标非常易于应用。您所需要的只是将其附加到您的图表并遵循简单的交易建议。该指标不断进行市场分析工作并寻找交易机会。当它检测到一个好的入口点时,它会为您提供一个箭头信号。该指标还显示止损和获利水平。 换句话说,当您像先生一样进行交易时,该指标会为您提供最佳江恩建议。江恩亲自告诉你此时此刻该做什么。但最好的部分是您不需要了解任何有关江恩交易原则的知识,因为该指标会为您完成整个市场分析工作。
Trend Punch
Mohamed Hassan
5 (11)
This indicator is unstoppable when combined with our other indicator called  Support & Resistance . After purchase, send us a message and you will get it   for  FREE as a BONUS! Introducing Trend Punch , the revolutionary forex trend indicator that will transform the way you trade! Trend Punch is uniquely designed to provide precise buy and sell arrows during strong market trends, making your trading decisions clearer and more confident. Whether you're trading major currency pairs or exotic sym
FX Power MT4 NG
Daniel Stein
5 (12)
通过 mql5 和 Telegram 上 的晨间简报获取每日市场更新,包括详细信息和屏幕截图 ! FX Power MT4 NG 是我们长期以来非常受欢迎的货币强度计算器 FX Power 的下一代产品。 这款下一代强度计算器能提供什么?您所喜爱的原版 FX Power 的所有功能 附加功能 黄金/XAU 强度分析 更精确的计算结果 可单独配置的分析周期 可自定义计算限制,以获得更好的性能 为希望查看更多信息的用户提供特殊的多实例设置 无尽的图形设置,可在每个图表中设置您最喜欢的颜色 无数的通知选项,让您再也不会错过任何重要信息 采用 Windows 11 和 macOS 风格的全新圆角设计 神奇的移动指标面板 FX Power 主要功能 所有主要货币的完整强势历史 所有时间框架内的货币强弱历史 所有经纪商和图表的计算结果完全相同 100% 可靠的实时计算 -> 无重绘 可通过下拉列表选择分析时段 通过自定义模式单独配置分析时段 可在一个图表中使用多个实例 可移动 FX Power 显示屏(通过拖放) 适用于高分辨率 QHD、UHD 和 4K 显示器 自动终端配置 针对平板电脑
Gold Stuff
Vasiliy Strukov
4.89 (201)
Gold Stuff 是专为黄金设计的趋势指标,也可用于任何金融工具。 该指标不会重绘,也不会滞后。 推荐时间框架 H1。 在它指标工作全自动专家顾问 EA Gold Stuff。 你可以在我的个人资料中找到它。 重要! 购买后立即与我联系,以获得说明和奖金!   您可以免费收到我们的强力支持和趋势扫描指标的副本,请私信。大部头书! 购买后立即联系我以获得设置和个人奖励!   设置 绘制箭头 - 打开关闭。 在图表上绘制箭头。 警报 - 打开关闭声音警报。 电子邮件通知 - 打开关闭。 电子邮件通知。 Puch-notification - 打开关闭。 推送通知。 接下来,调整色域。 Gold Stuff 是专为黄金设计的趋势指标,也可用于任何金融工具。 该指标不会重绘,也不会滞后。 推荐时间框架 H1。 在它指标工作全自动专家顾问 EA Gold Stuff。 你可以在我的个人资料中找到它。 购买后立即联系我以获得设置和个人奖励!   设置 绘制箭头 - 打开关闭。 在图表上绘制箭头。 警报 - 打开关闭声音警报。 电子邮件通知 - 打开关闭。 电子邮件通
Apollo Pips PLUS SP
Oleg Rodin
5 (2)
请在购买产品之前阅读下面的信息! Apollo Pips PLUS SP 是一款独特的产品!它适合那些想要获得我的新“APOLLO PIPS”指标以及“超级包”奖金以及访问我所有交易指标的人! 通过购买 Apollo Pips PLUS SP 产品,您实际上购买的是全新版本的 Apollo Pips 指标。此版本的指标具有改进的算法和易于使用的参数,使您有机会在任何市场和任何交易风格中使用该指标。 该产品的购买者还可以免费访问我的所有其他指标,作为我的超级奖励!如果您想获得我所有的交易工具,那么该产品非常适合您!:) 但这还不是全部!:) 该产品的所有购买者也有资格免费获得我的新指标!:) 如果我有一个新的交易指标可用,您将能够在我的特权“SUPER PACK”终身奖金计划中完全免费获得它! 购买后请联系我以获得我的交易提示和超级礼包奖金!
TPSproTREND PrO
Roman Podpora
4.78 (18)
TPSpro TREND PRO 是一个趋势指标,可以自动分析市场并提供有关趋势及其每次变化的信息,并给出进入交易的信号而无需重新绘制! 该指标使用每根蜡烛,分别对其进行分析。指不同的脉冲——向上或向下脉冲。货币、加密货币、金属、股票、指数交易的准确切入点! MT5版本                 指标的完整描述   我们建议将其与 指示器 -   RFI LEVELS 一起使用 主要功能: 准确的输入信号,无需渲染! 如果出现信号,它仍然相关!这是与重提指标的一个重要区别,重提指标可以提供信号然后改变信号,这可能导致存款资金的损失。现在您可以以更高的概率和准确度进入市场。还有一个功能是在箭头出现后为蜡烛着色,直到达到目标(止盈)或出现反转信号。 显示止损/获利区域 为了提高搜索切入点时的视觉清晰度,创建了一个模块,该模块最初显示买入/卖出区域,在该区域中搜索进入市场的最佳点。用于处理止损水平的附加智能逻辑有助于随着时间的推移减小其大小,从而降低进入交易(移动 sl)时的初始风险。 显示较高时间范围内的最小值/最大值(MTF 模式) 添加了一项功能,可以显示较高时间间隔的最小
Trend Pulse
Mohamed Hassan
5 (3)
Please contact me after purchase to immediately get your PDF strategy + documentation for Trend Pulse !  Official release price of $89  (2 /50 copies left). Next price is $199 . Introducing Trend Pulse , a unique and robust indicator capable of detecting bullish, bearish, and even ranging trends! Trend Pulse uses a special algorithm to filter out market noise with real precision. If the current symbol is moving sideways, Trend Pulse will send you a ranging signal, letting you know that it'
Scalper Inside PRO
Alexey Minkov
4.69 (49)
An exclusive indicator that utilizes an innovative algorithm to swiftly and accurately determine the market trend. The indicator automatically calculates opening, closing, and profit levels, providing detailed trading statistics. With these features, you can choose the most appropriate trading instrument for the current market conditions. Additionally, you can easily integrate your own arrow indicators into Scalper Inside Pro to quickly evaluate their statistics and profitability. Scalper Inside
Currency Strength Wizard
Oleg Rodin
4.91 (35)
货币强度向导是一个非常强大的指标,为您提供成功交易的一体化解决方案。该指标使用多个时间范围内所有货币的数据来计算这个或那个外汇对的力量。此数据以易于使用的货币指数和货币电力线的形式表示,您可以使用它们来查看这种或那种货币的力量。 您所需要的只是将指标附加到您要交易的图表上,该指标将向您显示您交易的货币的真实强度。该指标还向您显示买卖量压力的极值,您可以在顺势交易时利用这些压力。该指标还显示了基于斐波那契的可能目标。该指标可用于各种交易时间范围。该指标支持各种货币对的交易。 该指标为您提供所有类型的警报,包括推送通知。 购买后请联系我。我将与您分享我的交易技巧,并免费为您提供丰厚的红利指标! 祝您交易愉快,获利丰厚!
Atomic Analyst
Issam Kassas
5 (2)
首先值得强调的是,该交易指标是非重绘、非延迟的指标,这使其成为手动和机器人交易的理想选择。 用户手册:设置、输入和策略。 Atomic Analyst是一种PA价格行动指标,利用价格的力量和动量来寻找市场上更好的机会。配备了高级过滤器,可帮助去除噪音和假信号,并提高交易潜力。使用多层复杂的指标,Atomic Analyst扫描图表,并将复杂的数学计算转化为任何初学者都能理解并用来做出一致交易决策的简单信号和颜色。 “Atomic Analyst”是专为新手和经验丰富的交易者量身定制的综合交易解决方案。它将高级指标和一流功能融合为一体的交易策略,使其成为所有类型交易者的多功能选择。 日内交易和剥头皮策略:专为快速准确的日内交易和短期交易而设计。 日内和摆动交易策略:可用作追求价格大幅波动的日内和摆动交易者的可靠工具。 多货币和市场:凭借其可靠的精度,在不同的工具和市场上运作。 多个时间框架:可在多个时间框架上使用,性能良好。 稳定性:所有指标均不重绘、不重绘和不滞后,确保可靠的信号。 信号清晰度:提供箭头信号,用于清晰的入场和出场点。 实时警报:通过交易入场、SL和TP警报通知交
- Real price is 80$ - 40% Discount ( It is 49$ now ) Contact me for instruction, any questions! Introduction The breakout and retest strategy is traded support and resistance levels. it involves price breaking through a previous level.  The break and retest strategy is designed to help traders do two main things, the first is to avoid false breakouts. Many false breakouts start with a candlestick that breaks out of a level but ends with an immediate candlestick that brings the price back into t
RelicusRoad Pro
Relicus LLC
4.54 (80)
现在$ 147(更新后增加到$ 499) - 无限帐户(PC或Mac) RelicusRoad 用户手册 + 培训视频 + 访问 Private Discord Group + VIP 身份 一种看待市场的新方式 RelicusRoad 是世界上最强大的外汇、期货、加密货币、股票和指数交易指标,为交易者提供保持盈利所需的所有信息和工具。我们提供技术分析和交易计划,帮助每一位交易者取得成功,从初学者到高级。它是一个关键的交易指标,可以提供足够的信息来预测未来的市场。我们相信一个完整的解决方案,而不是图表上几个没有意义的不同指标。这是一个多合一指标,显示无与伦比且非常准确的信号、箭头 + 价格行为信息。 RelicusRoad 基于强大的人工智能,提供缺失的信息和工具来教育您并使您成为交易专家,成为成功的交易者。 几乎所有技术指标都滞后,这意味着它们只能报告已经发生的事情。因此,他们只确认您过去可以看到的价格已经在哪里。我们相信领先指标可以预测未来价格,而无需重新绘制,也不要过度依赖可能改变并导致重新绘制的滞后指标。如果您根据滞后指标进行交易并建立头寸,您就知道您已
目前八折优惠! 对任何新手或专家交易者来说都是最好的解决方案! 这个仪表板软件适用于28种货币对。它基于我们的两个主要指标(高级货币强度28和高级货币冲动)。它对整个外汇市场提供了一个伟大的概述。它显示高级货币强度值,货币运动速度和28个外汇对在所有(9)时间段的信号。想象一下,当你可以使用图表上的单一指标观察整个市场,以确定趋势和或剥头皮的机会时,你的交易将得到改善 我们已经在这个指标中建立了一些功能,使你更容易识别强势和弱势货币,同时识别和确认潜在的交易。该指标以图形方式显示货币的强势或弱势是增加还是减少,以及它在所有时间段的表现。 增加的新功能是动态市场斐波那契水平,它适应当前的市场条件变化,这是一个已经在我们的高级货币强度28和高级货币冲动指标中使用的成熟的加分项。 在交易时,总是将弱势货币和强势货币配对,这个新指标将帮助你做到这一点。 用户手册:点击这里  https://www.mql5.com/en/blogs/post/708783 特点  显示每个时间段的ACS28和GAP-speed(冲动)的货币强度值。 列:颜色代码以7种颜色
Clear Breakout
Martin Alejandro Bamonte
"Breakout Buy-Sell" 指标旨在根据不同市场交易时段(东京、伦敦和纽约)的价格突破,识别并突出潜在的买卖机会。该指标帮助交易者清晰地可视化买卖区域,以及止盈(TP)和止损(SL)水平。 使用策略 该指标可以按以下方式使用: 初始设置 :选择交易时段并调整 GMT 偏移。 市场可视化 :观察每个交易时段开始时绘制的突破箱。这些箱子表示该期间的最高点和最低点。 买卖信号 :价格突破箱子的最高点被认为是买入信号。价格突破最低点被认为是卖出信号。 风险管理 :使用 TP1、TP2、TP3 和 SL 水平来管理头寸。TP 水平设计用于不同的利润目标,而 SL 确保对不利走势的保护。 应用策略 为了最大限度地利用此指标,建议采用以下策略: 伦敦时段 :选择伦敦时段,并根据您的经纪商位置调整 GMT 偏移。 目标设置 :根据当前市场波动性定义 TP 和 SL,或允许每个货币对的特定建议。 主动监控 :观察突破箱,等待市场条件下的买入或卖出信号。 警报管理 :设置警报,当价格达到关键水平时通知您,这样就不需要不断监控图表。 外部参数说明 Margin :在突破水平上添加的点数空间,以建
Trend Screener
STE S.S.COMPANY
4.79 (81)
趋势指标,趋势交易和过滤的突破性独特解决方案,所有重要趋势功能都内置在一个工具中! 它是 100% 非重绘多时间框架和多货币指标,可用于所有符号/工具:外汇、商品、加密货币、指数、股票。 趋势筛选器是有效的指标趋势跟踪指标,它在图表中提供带有点的箭头趋势信号。 趋势分析器指标中可用的功能: 1.趋势扫描仪。 2. 具有最大利润分析的趋势线。 3.趋势货币强度计。 4. 带有警报的趋势反转点。 5. 带有警报的强趋势点。 6. 趋势箭头 每日分析示例,每日信号表现...等与我们的趋势筛选指标,可以在这里找到: 点击这里 限时优惠:Trend Screener Indicator 仅售 50 美元且终身可用。原价 125$) 通过访问我们的 MQL5 博客,您可以找到我们所有的高级指标以及分析示例、每日信号表现...等。 : 点击这里 我们的趋势系统由 2 个指标组成: 1. Trend Screener Indicator:显示趋势仪表盘、图表中的趋势线、入场点...等。 2. Trend Line Map Indicator:显示买卖作为仪表板,活动信号盈利/亏损
Advanced Currency IMPULSE with ALERT
Bernhard Schweigert
4.9 (455)
目前31%的折扣!! 对任何新手或专家交易者来说都是最好的解决方案! 这个指标是一个独特的、高质量的、负担得起的交易工具,因为我们已经纳入了一些专有的功能和一个秘密的公式。只需一张图表,它就能给出所有28种货币对的警报。想象一下,你的交易将如何改善,因为你能够准确地确定新趋势或剥头皮机会的触发点 建立在新的基础算法上,它使识别和确认潜在交易变得更加容易。这是因为它以图形方式显示了一种货币的强势或弱势是否正在加速,并测量了这种加速的速度--把它想象成你汽车中的速度表。当你加速时,事情显然会发生得更快,这在外汇市场上也是一样的,即如果你配对的货币正在向相反的方向加速,你就会发现一个潜在的有利可图的交易。 货币动量的垂直线和箭头将指导你的交易! 动态的市场斐波那契23水平被用作警报触发器,将适应市场活动。如果冲动触及黄色触发线,您将在MetaTrader或您的电子邮件或推送警报中收到警报。然后你就知道作为一个交易员应该做什么。货币对和方向已经给出。只要点击警报按钮,就可以切换到该货币对或打开一个新的图表,以便进一步分析。警报级别可以通过用户输入来改变,可以选择3个敏感度级别
Advanced Currency Strength28 Indicator
Bernhard Schweigert
4.91 (607)
目前26%的折扣 任何新手或专家交易者的最佳解决方案! 这个指标是一个独特的、高质量的、可负担得起的交易工具,因为我们纳入了一些专有的功能和一个新的公式。只需一个图表,你就可以读出28个外汇对的货币强度!想象一下,你的交易将如何得到改善,因为你的交易是在你的手中进行的。想象一下,你的交易将如何改善,因为你能够准确地确定新趋势或剥头皮机会的触发点? 用户手册:点击这里  https://www.mql5.com/en/blogs/post/697384 这是第一本,原版的! 不要买一个毫无价值的崇拜者的克隆品。 特别的 子窗口中的箭头显示强劲的货币势头GAP将指导你的交易! 当基础货币或报价货币处于超卖/超买区域(外盘斐波那契水平)时,在个人图表的主窗口中出现警告信号。 当货币力量从外围区间回落时,回撤/反转警报。 十字星模式的特别警报 可选择多个时间框架,以快速查看趋势! 货币强度线在所有的时间框架中都非常平稳,当使用较高的时间框架来识别总体趋势,然后使用较短的时间框架来确定精确的入口时,效果非常好。你可以根据自己的意愿选择任何时间框架。每个时间框架都由其自身进
PRO Renko System
Oleg Rodin
5 (23)
PRO Renko Arrow Based System for trading renko charts.  准确的信号交易任何外汇工具. 另外,我将免费提供系统的附加模块! PRO Renko系统是RENKO图表上高度准确的交易系统。该系统是通用的。 该交易系统可应用于各种交易工具。 该系统有效地中和了所谓的市场噪音,打开了获得准确反转信号的通道。 该指标易于使用,只有一个参数负责产生信号。 您可以很容易地使算法适应您感兴趣的交易工具和renko酒吧的大小。 我很乐意通过提供任何咨询支持来帮助所有客户有效地使用该指标。 祝您交易成功!购买后,立即写信给我! 我将与您分享我的建议和我的renko发电机。 另外,我将免费提供系统的附加模块!
Gold Channel XAUUSD
Paulo Rocha
5 (2)
Gold Channel is a volatility-based indicator, developed with a specific timing algorithm for the XAUUSD pair, which consists of finding possible corrections in the market. This indicator shows two outer lines, an inner line (retracement line) and an arrow sign, where the theory of the channel is to help identify overbought and oversold conditions in the market. The market price will generally fall between the boundaries of the channel. If prices touch or move outside the channel it is a tra
首先,值得强调的是,这个交易工具是非重绘、非重画和非滞后的指标,非常适合专业交易。 在线课程,用户手册和演示。 智能价格行动概念指标是一个非常强大的工具,既适用于新手,也适用于经验丰富的交易者。它将超过20个有用的指标合并到一个指标中,结合了高级交易思想,如内圈交易员分析和智能资金概念交易策略。该指标侧重于智能资金概念,提供有关大型机构交易方式的见解,帮助预测它们的动向。 它在流动性分析方面尤其擅长,有助于理解机构的交易方式。它擅长预测市场趋势,并仔细分析价格波动。通过将您的交易与机构策略对齐,您可以更准确地预测市场走向。该指标多才多艺,擅长分析市场结构,识别重要的订单区块,并识别各种模式。 它擅长识别BOS和CHoCH等模式,理解动量的转变,并突出显示供需强劲的关键区域。它还擅长发现强大的不平衡,并分析价格创造更高高点或更低低点的模式。如果您使用斐波那契回撤工具,该指标可以满足您的需求。它还可以识别相等的高点和低点,分析不同的时间框架,并通过仪表板显示数据。 对于使用更高级策略的交易者,该指标提供了工具,如公平价值差指标和优惠和折扣区域的识别。它特别关注高时间框架订单
NAM Order Blocks
NAM TECH GROUP, CORP.
5 (1)
MT4多時限訂單塊檢測指示器。 特徵 -在圖表控制面板上完全可自定義,提供完整的交互。 -隨時隨地隱藏和顯示控制面板。 -在多個時間範圍內檢測OB。 -選擇要顯示的OB數量。 -不同的OB用戶界面。 -OB上的不同過濾器。 -OB接近警報。 -ADR高低線。 -通知服務(屏幕警報|推送通知)。 概括 訂單塊是一種市場行為,它指示從金融機構和銀行收取訂單。著名的金融機構和中央銀行帶動了外匯市場。因此,交易者必須知道他們在市場上正在做什麼。當市場建立訂單塊時,它會像發生大多數投資決策的範圍一樣移動。 訂單建立完成後,市場將朝著上升和縮小的方向發展。訂單大宗交易策略的關鍵術語是它包括機構交易者正在做的事情。由於它們是主要的價格驅動因素,因此包括機構交易在內的任何策略都可以。 您將在任何時間範圍內實時看到訂單塊,使用我們的控制面板,您將能夠在所選的歷史記錄週期內檢測常規,拒收和未大寫的訂單塊。 現在您可以接收到訂單塊接近警報,我們在MT4上顯示屏幕通知,並將通知推送到您的手機!
PZ Trend Trading
PZ TRADING SLU
4.8 (5)
许多盈利交易者不仅知道如何识别市场趋势,而且也能把握趋势建立后的交易机会。 Pz 趋势交易 指标设计用来在趋势行情中尽可能的赚取利润。 已建立的趋势提供了一揽子交易机会,但大多数趋势交易指标完全忽视了它们,让交易者在趋势行情时完全不知道该如何做!一般趋势指标只通知有关的趋势变化,但根本不足以得到卓越的回报. Pz 趋势交易 指标比一般趋势指标显示多达 20 倍的交易 , 因为它注重所谓的市场时机。它不仅显示当前的市场趋势,也有回调,内柱线的突破和调整。它令您在趋势回调之后介入,安全的柱线内突破金字塔加仓,以及发现潜在的反转,和已知的调整。 趋势改变 一个趋势改变在市场方向变化时发生。趋势变化在图表上用带数字的彩色圆圈显示。蓝色 (1) 信号为上涨开始, 而红色 (1) 信号为下跌开始。趋势变化并非评估当前价格动作的结果, 它意味着交易设置是不定时地。如果您正确使用本指标, 在趋势变化时, 您将将已经入场 (参看下面的调整)。 回调 但凡趋势在运动中,行情上下抖动,盈利者收割利润,且其它参与者入场。趋势回调代表好的买入机会,通常是由主力获利离场导致。如果行情在回调后回归上行, 指
TPSpro RFI Levels
Roman Podpora
4.8 (20)
Order Block Hunter
Noha Mohamed Fathy Younes Badr
5 (1)
Order block hunter indicator is the best indicator for  hunt the order blocks that area where there has been a large concentration of limit orders waiting to be executed Order blocks are identified on a chart by observing previous price action and looking for areas where the price experienced significant movement or sudden changes in direction .This indicator does that for you by using very complicated codes and helps you to take the best areas To buy and sell because it make marks at the best a
Scalper Vault
Oleg Rodin
5 (22)
Scalper Vault 是一个专业的剥头皮系统,为您提供成功剥头皮所需的一切。该指标是一个完整的交易系统,可供外汇和二元期权交易者使用。推荐的时间范围是 M5。 该系统为您提供趋势方向的准确箭头信号。它还为您提供顶部和底部信号以及江恩市场水平。无论您拥有何种交易经验,该系统都易于使用。您只需要遵循简单的规则并每天重复该过程。 建议将此系统用于主要货币对。感谢您的关注! 请注意,该指标在策略测试器中可能无法正常工作。因此,我建议仅在模拟或真实账户的真实交易条件下使用该系统。 指示器提供所有类型的警报,包括推送通知。 购买指标后请与我联系。我将免费与您分享我的个人交易建议和出色的奖励指标! 祝您交易愉快,盈利!
M1 Arrow
Oleg Rodin
4.67 (12)
M1 Arrow - 基于市场的两个基本原则的盘中策略。 该算法基于使用附加过滤器对交易量和价格波动的分析。该指标的智能算法仅在两个市场因素合二为一时才会发出信号。该指标使用较高时间框架的数据计算 M1 图表上某个范围的波浪。为了确认波浪,该指标使用了成交量分析。 从理论上讲,该指标可以与其他时间框架一起使用,但您需要考虑到该指标最初是为在 M1 上交易而开发的这一事实。 该指标是一个现成的交易系统。交易者所需要的只是跟随信号。此外,该指标可以成为您自己的交易系统的基础。交易仅在分钟图表上进行。 尽管指标使用 MTF 原理,但指标算法尽可能稳定。 购买后,一定要写信给我!我将与您分享我的交易设置和建议!祝您交易成功!感谢您的关注!
IX Power MT4
Daniel Stein
5 (5)
IX Power 终于将 FX Power 的无与伦比的精确性带到了非外汇交易符号中。 它能准确判断您喜爱的指数、股票、商品、ETF 甚至加密货币的短期、中期和长期趋势强度。 您可以 分析 终端提供的 一切 。试试吧,体验一下您在交易时如何把握 时机 。 IX Power 主要功能 100% 精确的非重绘计算结果 - 适用于您终端中的所有交易符号 下拉式选择预配置以及可单独配置的强度分析周期 通过电子邮件、消息和手机通知的无数种通知选项 可访问的 EA 请求缓冲区 可自定义计算限制,以获得更好的性能 为希望查看更多信息的用户提供特殊的多实例设置 无尽的图形设置,让您在每个图表中都能找到最喜欢的颜色 采用 Windows 11 和 macOS 风格的圆角新面板设计 神奇的移动指标面板,可在子窗口和主图表之间无缝移动 适用于高分辨率 QHD、UHD 和 4K 显示器,并针对平板电脑和触摸屏进行了优化 IX Power 参数 最重要的参数不言自明,但我们很快会在另一篇文章中为您提供所有 IX Power 参数的完整说明。 使用别名 "参数可为技术交易
`All in One Chart Patterns` 图表形态在交易者之间是一个有争议的话题;有些人认为它们是可靠的信号,而另一些人则不这样认为。我们的“Chart Patterns All-in-One”指标显示了各种图表形态,让您可以自行测试这些理论。这些形态的盈利能力并不反映指标的有效性,而是对形态本身的评估。“Chart Patterns All-in-One”指标是可视化这些形态的绝佳工具,让您能够对它们在您的交易策略中的有效性得出自己的结论。 该指标将多个图表模式组合成一个统一的工具,用于MetaTrader 4 (MT4)。它提供了直接从图表上开启或关闭每个模式的功能,使分析更加高效和可定制。以下是该指标和包含的模式的详细描述: #### 包含的模式: 1. **模式 1-2-3**    - **描述**:该模式用于识别市场中的潜在反转点。它寻找三个点(高点或低点)的序列,标志着趋势的变化。    - **信号**:       - 买入信号:当有两个连续的低点,第二个低点高于第一个低点,随后是一个低于前一个高点的高点时形成。      - 卖出信号:当
Advanced Supply Demand
Bernhard Schweigert
4.9 (271)
现在优惠 33%! 任何新手或专业交易者的最佳解决方案! 该指标是一款独特、高质量、且价格合理的交易工具,因为我们已经整合了许多专有功能和新公式。 依据此更新,您将能够显示双重时间帧区域。 您不仅可以显示一个较高的时间帧,还可以同时显示图表时间帧,加上更高的时间帧:显示嵌套时区。 供需双方所有交易者都会喜欢它。 :) 重要信息披露 高级供需的最大潜力,请访问 https://www.mql5.com/zh/blogs/post/720245   想象您的交易如何得以改善,是因为您能够精准定位入场或目标位吗? 构建于新的底层算法,它可以更轻松地识别出买卖双方之间的潜在失衡。 这是因为它以图形方式展示供需最强劲区域,及其过去的表现(显示旧区域)。 这些功能旨在帮助您更轻松地发现最佳入场区域和价位。 现在您可以针对您的交易品种和时间帧来优化和编辑区域强度! 高级供需指标适用于所有产品和时间帧。 它是一个新的公式,非常新的功能是两个区域强度函数可由用户输入进行调整! 这在交易中是一大优势。 当您学习如何使用专有功能,例如带有价格游离最小 X 因子的区域强度时,您能够判断该区域强劲与否。 供
Break and Retest
Mohamed Hassan
3.83 (12)
This Indicator only places quality trades when the market is really in your favor with a clear break and retest. Patience is key with this price action strategy! If you want more alert signals per day, you increase the number next to the parameter called: Support & Resistance Sensitivity.  After many months of hard work and dedication, we are extremely proud to present you our  Break and Retest price action indicator created from scratch. One of the most complex indicators that we made with ove
作者的更多信息
Keltner Channel MT4
Muhammad Robith
4.75 (8)
Keltner Channel is a well known indicator that not in MT4's indicators default lineup (You can get this from your broker somehow). This indicator helps you to define trend and sometimes overbought/oversold prices during flat trend. Input Description: EMAperiod: Moving Average period used for indicator. Must be higher than 1. ATRperiod: Average True Range period used for indicator. Must be higher than 1. multiplier: Multiplier used for determine channel's wide. Must be higher than 0 but may not b
FREE
BWMACDsignal
Muhammad Robith
5 (1)
This indicator mostly inspired from BW-ZoneTrade custom indicator from MT5. How To Use: BUY when both dots colored Green. SELL when both dots colored Red. In addition to original one, MACD-OsMA-generated signal also can be drawn. Input Description: MA_period_short: Faster EMA period for MACD. Applied when drawMACD is true. MA_period_long: Slower EMA period for MACD. Applied when drawMACD is true. MACDperiod: MA period for MACD. Applied when drawMACD is true. drawMACD: When true, draw an addi
FREE
BuySell Volume
Muhammad Robith
5 (3)
BuySell Volume is an indicator that approximates Buy and Sell volumes based on price movement. Input Description: applied_model: Choose the applied model. In low reversal mode, price is considered receive low bearish pressure during bullish candle's creation (high bearish pressure on high reversal model. In other words, Bullish Marubozu candles has really high Buy Volumes in low reversal model than in high reversal one. Output Description: Buy and Sell Volume: Determines how many Buy and Sell v
FREE
Triple EMA
Muhammad Robith
4 (2)
Triple Exponential Moving Average Technical Indicator (TEMA) was developed by Patrick Mulloy and published in the "Technical Analysis of Stocks & Commodities" magazine. It works as the same as EMA. However, it provides smaller lags, even compared to Double EMA. Input Description: period: MA's period. Must be higher than 1. applied_price: Define the price to be applied. Use 1 of these integers. 0 -> applied_price is Close price 1 Open price 2 High price 3 Low price 4 Median price 5 Typical price
FREE
This indicator helps you to find overbought and oversold prices based on William %R. Input Description: Wperiod: Period for %R indicator. OverBoughtLevel: Define the overbought level for %R. Must in between 0 and -50. OverSoldLevel: Define the oversold level for %R. Must in between -50 and -100. middle_value: When true, indicator also draw the middle points between upper and lower line. shift: Set an additional offset to the indicator. Several Notes: Set 0 and -100 as Overbought and Oversold le
FREE
VolumeXover
Muhammad Robith
3.5 (2)
This indicator determines minimum volumes needed during a candle formed so that it would be higher than current volume's average. Although you can place MAs on your volume indicator, this indicator has non-repaint characteristic so you may not to worry about sudden volume increase. This indiator also draw volume indicator for its own. Input Description: period: Period used for indicator. Must be higher than 1. Output Description: VolumeXover: This indicator's main feature. During the time the vo
FREE
Double EMA
Muhammad Robith
5 (1)
Double Exponential Moving Average (DEMA) is a well-known trend indicator. DEMA was developed by Patrick Mulloy and published in February 1994 in the "Technical Analysis of Stocks & Commodities" magazine. It is used for smoothing price series and is applied directly on a price chart of a financial security. Besides, it can be used for smoothing values of other indicators. The advantage of this indicator is that it eliminates false signals at the saw-toothed price movement and allows saving a posi
FREE
Price Time Correlation
Muhammad Robith
5 (1)
This indicator determine price volatility using correlation between Price and Time. WARNING: Not suitable for 1M timeframe, you would not see any lines in this frame! How to Use: More closer the indicator's value to 0, the price is considered more volatile. When reversal is started, the indicator's value would be rise or fall significantly. During a strong trend, the indicator's value would be closer to 1 or -1, depends on current trend. Entry Signal: BUY SIGNAL: Indicator crosses 0.2 from
FREE
PriceXover
Muhammad Robith
This indicator maps price crossover with Simple Moving Average (SMA) for each candle. Works like a SMA but has non-repaint characteristic. How to Use: As stated before, this indicator works like a SMA. Use this to determine trend. When price is above this line then the uptrend is expected (downtrend if price below the line). 2 of these indicator (with different periods) can also generate buy/sell signal like 2 SMAs. When the lower period SMA crosses higher period SMA from below, then buy signal
FREE
SMAconfirm
Muhammad Robith
This indicator helps you to comfirm SMAs' crossovers by draw a signal line that determines SMA movement direction. when Short SMA cross above Long SMA and Close price is above the signal several bars later, then uptrend is expected. when Short SMA cross below Long SMA and Close price is below the signal several bars later, then downtrend is expected. Input Description :  MA_Period_short: Short-term SMA's period. Used for short-term PriceX. Must be higher than 1.  MA_Period_long: Long-term SMA'
FREE
AOnoisyChannel
Muhammad Robith
Are you using Awesome Oscillator? Wonder at which High and Low prices this indicator colored Green? Red? This indicator helps you determine those limits. GET 20% OFF for renting for 1 year! Yellow line is called Upper Line, and Red line is Lower Line. BUY SIGNAL In this case, last bar's AO color would be colored Green. Both Open and Low Price above the Lower Line. Close price crosses the Upper Line from below. SELL SIGNAL In this case, last bar's AO color would be colored Red. Both Open and
筛选:
无评论
回复评论
版本 1.53 2019.01.22
Now you can apply High/Low prices as an input, instead of Close price only.
版本 1.52 2019.01.11
Description rewrited, and now star size is adjustable.
Now the indicator will notify you when there are inputs has invalid values (and also repair them).
版本 1.5 2018.12.31
1.05 Changelog

- Adjust MACDperiod automatically when MACDperiod = 1
- More "larger" stars for your convenience