TrueRegression
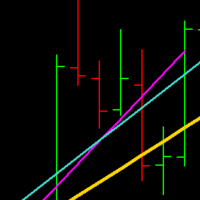
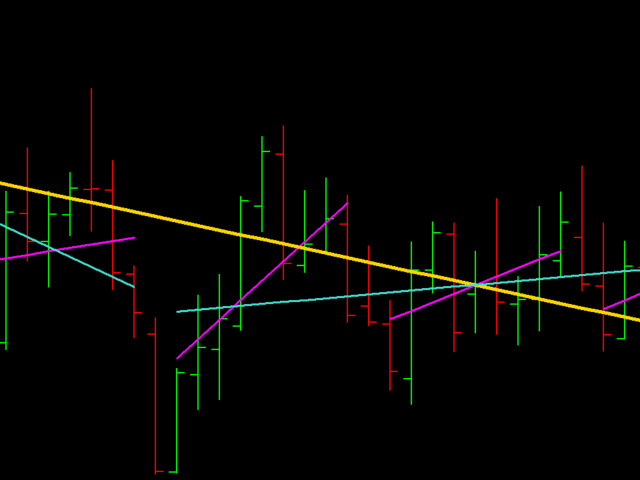
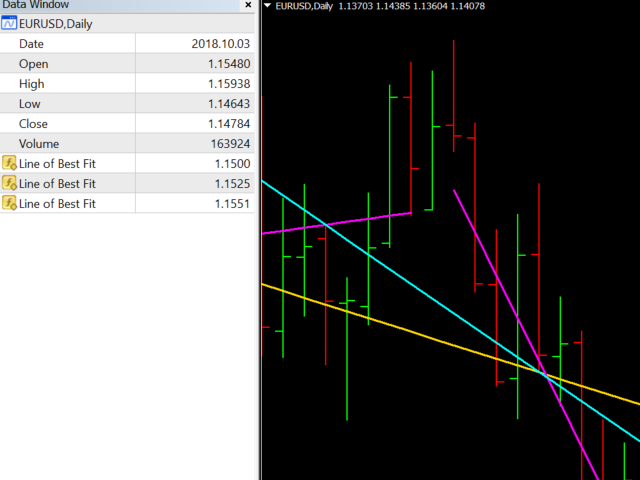
TrueRegression will calculate the linear regression of a given sequence of bars, and display the line of best fit on the chart.
Regression is used to determine whether a market is currently trending, and whether sub-trends are occurring, which can hint at a potential breakout situation.
The indicator will recalculate every 'n' bars (defined by the user input).
When the indicator re-draws, it will keep the original lines on the chart, unmodified, so they can be referenced by a custom EA, or by the user manually.
The calculation is the same used widely in machine learning today.
TrueRegression also works in the backtester!
The screenshots below show the indicator after it's been added to the chart 3 times, all with different periods.
