Sensitive Signal
- 指标
- Aleksey Ivanov
- 版本: 7.0
- 更新: 3 十一月 2021
- 激活: 5
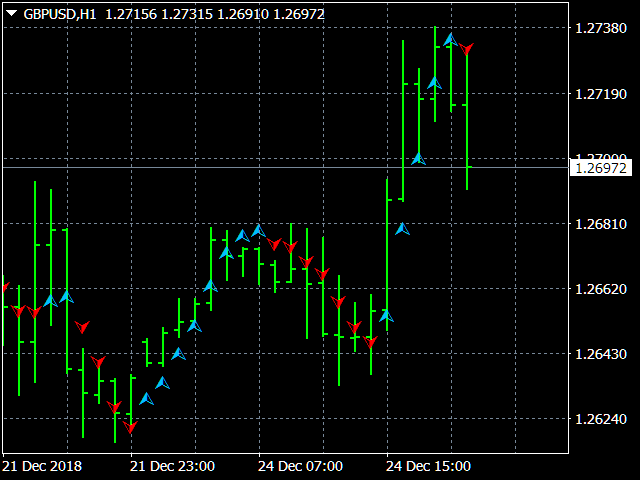
使用作者开发的过滤方法的“敏感信号”指示器允许以高概率建立真实趋势运动的开始。该指标过滤随机价格走势,因此对货币兑换交易非常有效。作者开发的过滤在几次迭代中进行,揭示了常规价格运动的真实轨迹(更确切地说,这种运动的最可能的曲线)并绘制它。
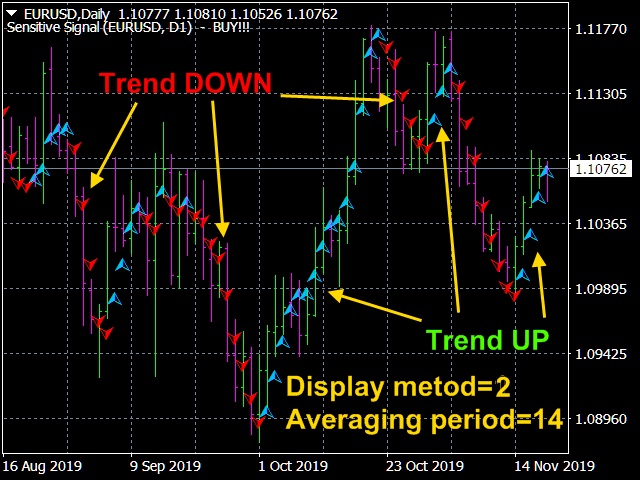
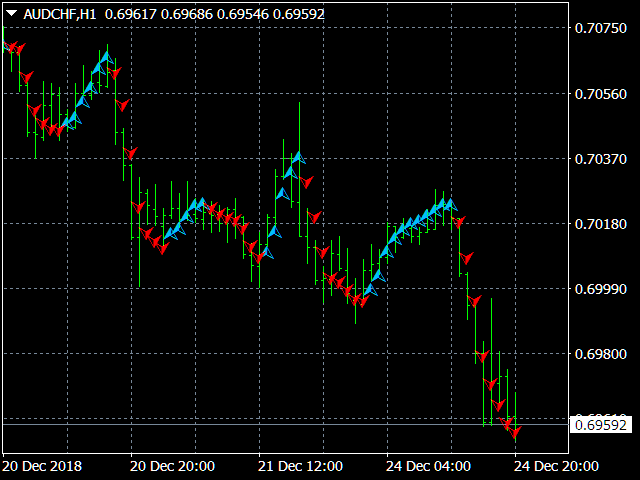
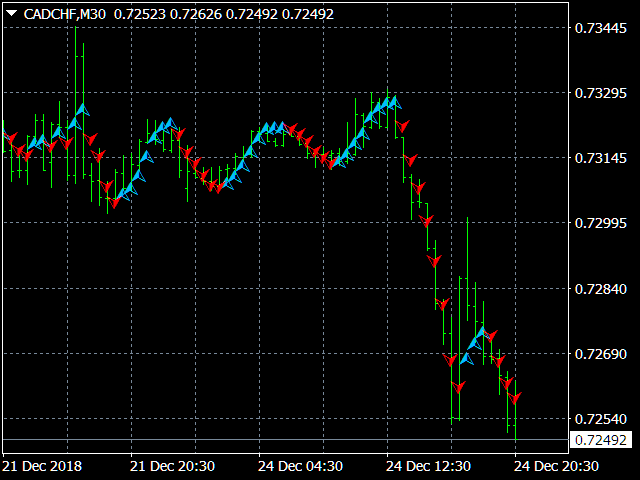
“敏感信号”指示器的指示生动,非常简单,不需要注释。蓝色三角形位于价格运动的常规成分的上升趋势中,红色三角形呈下降趋势。因此,当红色三角形被蓝色替换时,买入的入口点。当蓝色三角形被红色替换时,您需要打开一个卖出位置。
指标的敏感度级别由选项决定 «Select sensitivity level»。同时,您需要了解增加灵敏度级别不仅会减少信号的延迟,还会增加发出错误信号的可能性。
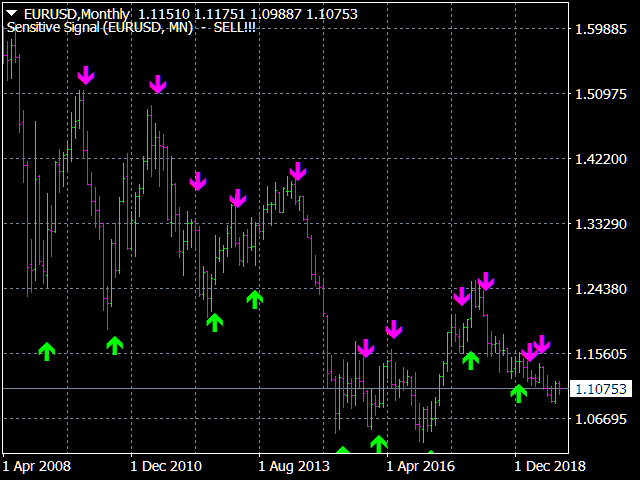
箭头也指示了价格走势发生变化的可能时刻。
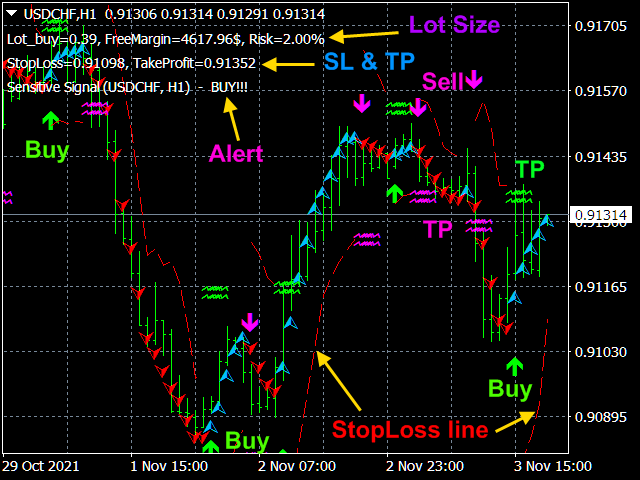
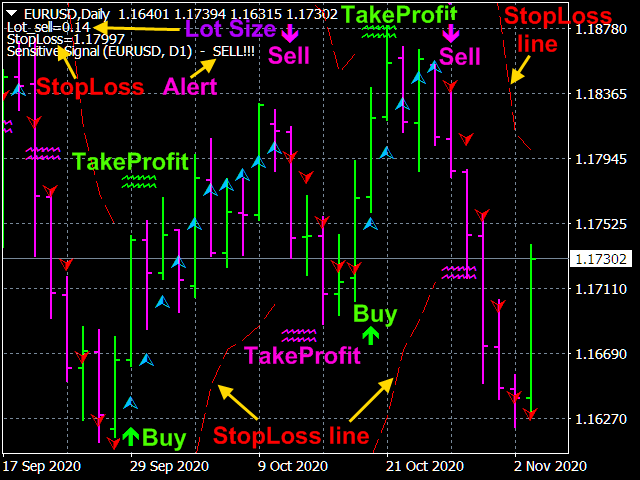
指标还认为止盈是信号后价格达到的最可能值。
该指标计算并显示止损仓位线,该止损位线是根据价格概率的当前分布以及趋势逆转之前由止损价平仓的所选概率水平来计算的。
该指标还具有内置的资金管理功能,您可以在其中基于接受的风险水平,存款金额和止损仓位来计算手数。
该指标具有所有类型的警报。 已经开发了三种用于启用警报的算法。警报可能已打开: 1) 当指标的读数在最后两个柱上重合时(关于趋势的方向);2) 在封闭的蜡烛上; 3) 在关闭的蜡烛上和它前面的杠上。
指标设置。
- Price type -价格类型。参数值: Close price, Open price, High price, Low price, Median price ((high + low)/2 -默认情况下), Typical price ((high + low + close)/3), Weighted price ((high + low + 2*close)/4).
- The averaging method -平均法. 参数值: Simple, Exponential (默认情况下), Smoothed, Linear weighted.
- The averaging period - 平均期. 参数值任何整数(20默认情况下).
- Select sensitivity level - 指标的敏感程度。 参数值: Low, Middle (默认情况下), High.
- Dimensions of markers –标记的大小。参数值: 任何整数 (2默认情况下).
- The display method - 显示信息的方法。参数值: Show trend arrows and show change trend arrows (默认情况下), Show only trend arrows, Show only change trend arrows.
- Show StopLoss and TakeProfit lines? 显示止损线? 参数值 : true ( 默认情况下 ), false .
- Trend UP arrow color= DeepSkyBlue - 下降趋势箭头的颜色。
- Trend DOWN arrow color=Red - 上升趋势箭头的颜色。
- Down arrow color=Magenta - 箭头是下降趋势的开始。
- Up arrow color =Lime - 箭头是上升趋势的开始。
- Signal Identification Method -信号识别方法. 参数值: By the last two bars («根据最后两个酒吧» – 默认情况下), By closed candle («通过封闭的蜡烛»), By closed candle and by the previous for it bar («在封闭的蜡烛和前一个酒吧»).
- The Signal method - 交易信号警报的类型. 参数值: No, Send alert, Print (in expert), Comment (in chart), Sound + Print, Sound + Comment, Sound, Push + Comment, Push, Mail + Comment, Mail.
- The probability of triggering StopLoss P_sl –在趋势反转之前通过止损平仓的可能性。0到1之间的任何实数 (0.05默认情况下).
- Calculate the lot size from the risk, deposit and P_sl? –根据风险,存款和StopLoss关闭订单的概率来计算手数?参数值: true, false (默认情况下).
- Allowable losses in % from Free Margin - 以可用保证金百分比表示的允许损失 (2%默认情况下).


Great indicator to use for confirmation of bias and/or exits, under correct settings and time frame, can be adjusted very well to precisely fit your strategy, in what ever market it is that you trade.