Currencies Strength
- 指标
- Jinsong Zhang
- 版本: 2.1
- 更新: 20 十一月 2021
- 激活: 8
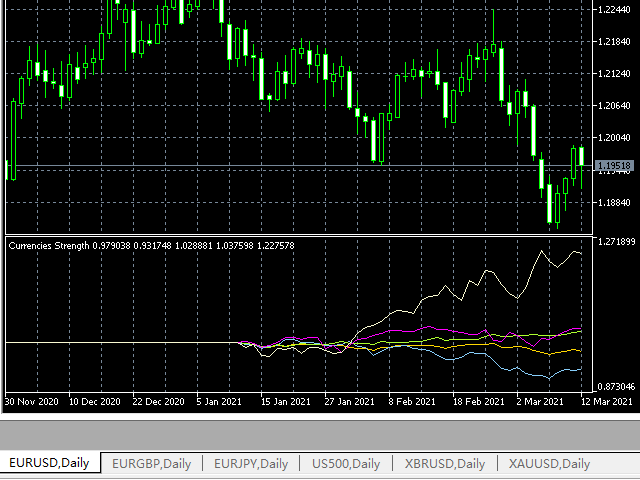
这个指标用于比较图表上的交易品种与其他几个所选交易品种之间的强弱相对关系。
根据每个交易品种基于相同基准日的价格走势进行比较,可以看到几条不同走向的趋势线,反映出几个不同交易品种之间的强弱关系,这样可以更清楚地了解市场的趋势。
例如,你可以在EURUSD图表上应用这个指标,将其与货币对EURJPY和EURGBP进行比较,看看哪个更强。
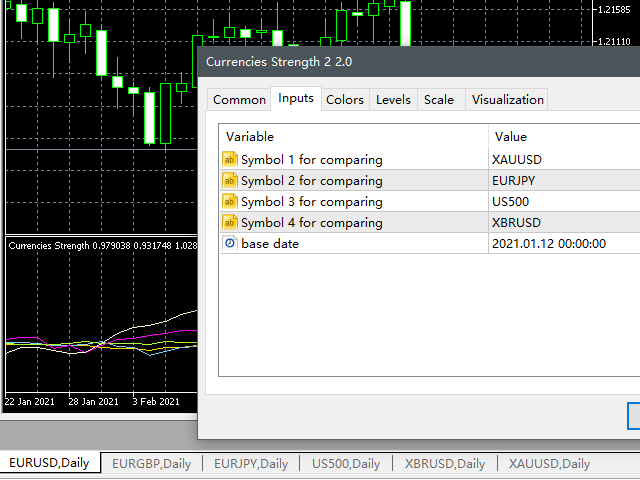
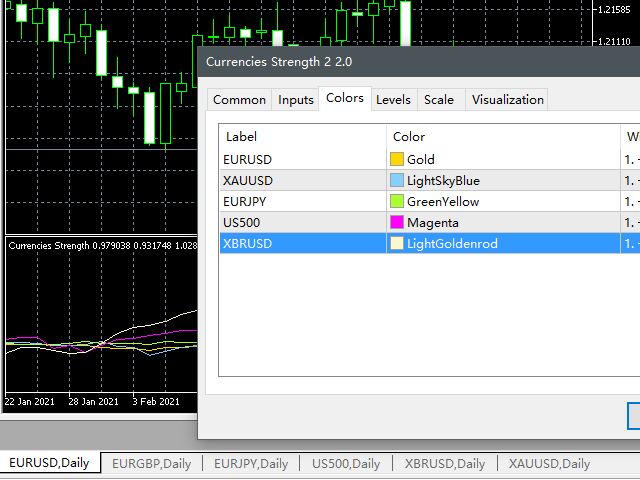
你需要为指标输入参数:
需要比较的几个交易品种的名称
您需要选择比较基准日期。
请注意,使用指标前应确保相关交易品种的历史数据已经下载。
免费模拟版本是:https://www.mql5.com/zh/market/product/63921
.............................................