Line of Loss Percent for Controlling Risk MT5
- 指标
- shi hong he
- 版本: 1.2
- 激活: 5
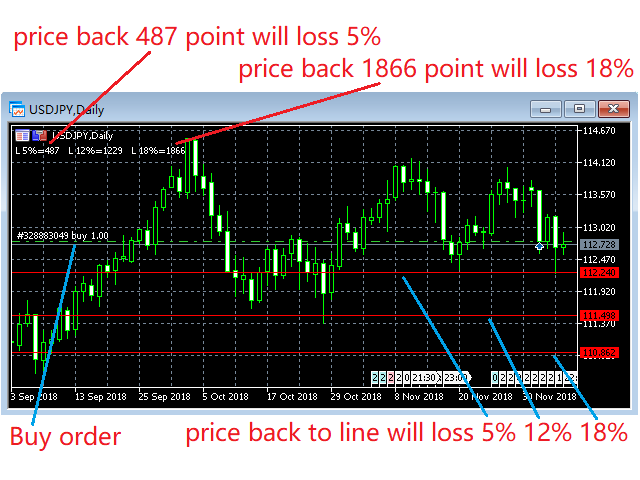
这是一个仓位风险可视化指标,指标可以让你清楚的看到,价格回撤到哪个位置会产生多大的亏损。
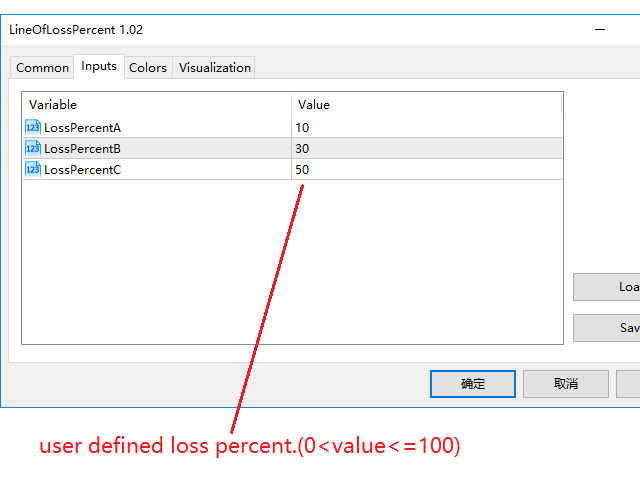
这是一个非常有用的用于控制风险的技术指标,在账户有开仓订单时,把技术指标附加到对应开仓订单的交易品种的图表上,技术指标就会在图表上绘制三条价格直线,此三条亏损百分比价格直线的默认值是10%、30%、50%,用户可自定义亏损百分比值,并且在左上角输出亏损百分比所对应的回撤点差。
亏损百分比价格直线的意义在于,让你可以清楚的看到使账户亏损的价格位置,可以让你更好的控制账户仓位大小,可以让你知道风险的情况下开出尽可能大的仓位,可以让你对账户所持有的仓位的风险做到心中有数。在你对行情有明确的判断时,可以尽可能多的持有仓位。
例1,多头开仓,在你认为市场价格不会低于某一价格时,那么只要亏损10%价格直线低于这一价格,你就可以继续买入开仓,直到亏损10%价格直线接近这一价格。只要市场价格高于亏损10%价格直线,账户的亏损就小于10%。
例2,空头开仓,在你认为市场价格不会高于某一价格时,那么只要亏损12%价格直线高于这一价格,你就可以继续卖出开仓,直到亏损12%价格直线接近这一价格。只要市场价格低于亏损12%价格直线,账户的亏损就小于12%。