RVI Sniper Alert
- 指标
- Yaroslav Varankin
- 版本: 1.0
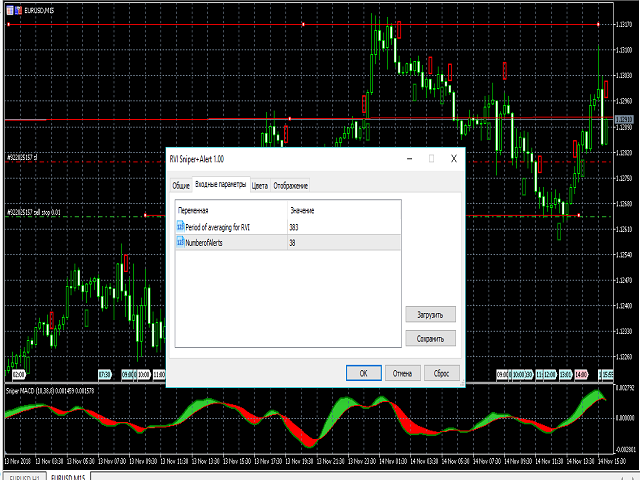
- 這是最終的RVI指標。
- 添加警報箭頭
- 他可以確定潛在的阻力水平
- 額外的2個過濾器,以提高讀數
- 另外平滑以顯示良好的效果
- 它被配置為從m1到m30的短時間範圍
- 也不會很糟糕
- 我建議使用此指示器和屏幕截圖macd中的其他過濾器
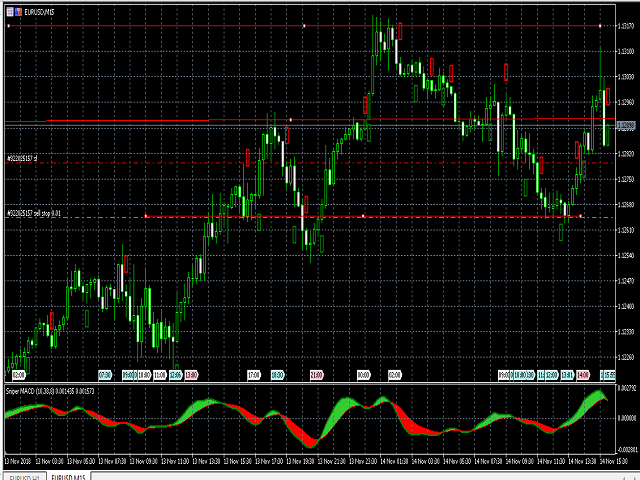
- 這是最終的RVI指標。
- 添加警報箭頭
- 他可以確定潛在的阻力水平
- 額外的2個過濾器,以提高讀數
- 另外平滑以顯示良好的效果
- 它被配置為從m1到m30的短時間範圍
- 也不會很糟糕
- 我建議使用此指示器和屏幕截圖macd中的其他過濾器
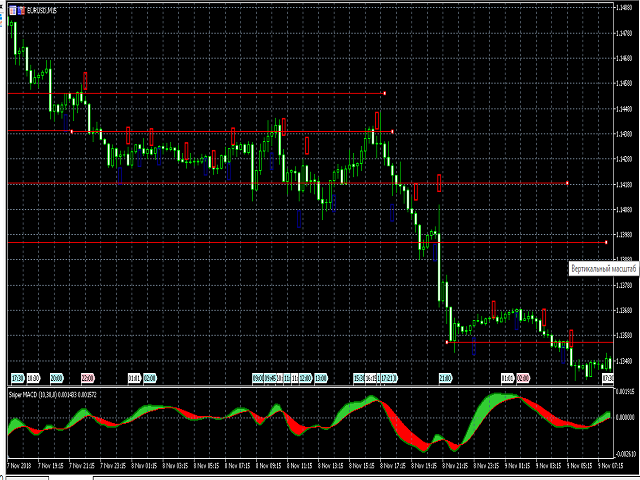
- 這是最終的RVI指標。
- 添加警報箭頭
- 他可以確定潛在的阻力水平
- 額外的2個過濾器,以提高讀數
- 另外平滑以顯示良好的效果
- 它被配置為從m1到m30的短時間範圍
- 也不會很糟糕
- 我建議使用此指示器和屏幕截圖macd中的其他過濾器
Excelente indicador, thanks so mucho.