• 概述
  • 评论 (3)
  • 评论 (67)
  • 新特性

ZigZag Dashboard for MT5

5
ZigZag 指标的多货币和多时间框架修改。 显示市场的当前方向、上次走势的高度、本次走势中的柱数以及锯齿形调整浪(水平线)的前一个点的突破。 这是 MTF 扫描仪。

您可以在参数中指定任何所需的货币和时间范围。 此外,当之字折线改变方向或突破前一点时,面板可以发送通知。 通过单击带有句点的单元格,将打开该符号和句点。

参数

Depth — 如果最后一根蜡烛的偏差小于(或大于)前一根,则 Zigzag 将不会绘制第二个最大值(或最小值)的烛台的最小数量;
Deviation — 锯齿形形成局部顶部/底部的两个相邻烛台的最高点/最低点之间的最小点数;
Backstep — 局部高点/低点之间的最小烛台数量;
Bars to calculate ZZ — 历史中用于查找 ZigZag 点的柱的数量;
ZZ-wave info — 表格中显示有关波形的哪些信息 — 仅当前波形或当前波形 + 上一个波形;
Highlight the symbol when all periods are in the same direction — 方向时突出显示该符号;
Symbol highlight time (minutes, 0-all the time) — 符号高亮时间(分钟,0-一直);
Highlight cells mode — 突出显示单元格模式
— Wave has >=X bars — 突出显示条数大于或等于 X 的单元格;
— Breakout & ZZ-pt on current bar — 当上一个 ZigZag 点被突破时突出显示单元格(ZZ 点位于当前柱上);
— ZZ-pt on current bar — 当 ZZ 点出现在当前栏上时突出显示单元格。 新的或变化的浪潮;
— Price touched ZZ-Ray — 当 ZigZag 射线触及价格时突出显示单元格;
— disable - 禁用-禁用单元格突出显示;
Number of bars to highlight cells (bars) — ZigZag 波形中应有多少条形图突出显示单元格;
Clear the chart at startup — 启动时清除图表。
Set of Pairs — 符号集
—  Market Watch — 来自“市场观察”的配对。 不要使用太多符号,这可能会导致指标变慢;
—  Specified manually — 在参数“Pairs”中手动指定对;
—  Current pair — 当前对;
Pairs (separated by a space or semicolon) — 由空格或分号分隔的符号列表。 货币名称的书写方式应与经纪商的名称完全相同,并保留大小写和前缀/后缀。
Time Frames (separated by a space or semicolon) — 由空格或分号分隔的时间范围列表(多个时间范围)。
Sort pairs — 对对列表进行排序。
Position on chart — 在图表上显示面板的角落。
X offset (pix) — 沿 X 轴移动面板;
Y offset (pix) — 沿 Y 轴移动面板;
Refresh dashboard every (seconds) — 所有货币对和时间范围的更新周期。
Open the pair in a new window — 通过单击在新图表窗口中打开交易品种。
Chart template — 图表模板的名称(如果图表在新窗口中打开)。
Color Up — 如果指示器增加,则单元格颜色。
Color Down — 如果指标下降,则单元格颜色。
Color Highlight — 文本突出显示颜色。
Transparency (0-255) — 面板的透明度。
Font name — 字体名称。
Font size — 字体大小。

警报
Timeframes for alerts (separated by a space or semicolon) — 发送警报的时间段列表(以空格或分号分隔)。
Alert if wave has >= X bars — 如果锯齿形调整浪的条数大于或等于 X,则发出警报。
Alert for the Higher High & Lower Low breakouts — 如果之前的高点或低点被突破,则发出警报。
Alert for the Higher Low & Lower High breakouts — 如果先前的 HL 或 LH 被突破,则发出警报。
New ZZ-Point appears — 如果出现新的锯齿形调整浪点,则会发出警报。
New Triangle appears — 新的三角形出现。
Current bar is over the Rays Cross — 当前柱位于射线十字上方。
Alert when Ray was touched by price — 当雷被价格触动时发出警报。
All timeframes are in the same direction — 所有时间范围都朝同一方向。
All pairs (one column) are in the same direction — 所有对(一列)都处于同一方向。
All timeframes are in the same direction — 当所有时间范围都在同一方向时发出警报。
All pairs (one column) are in the same direction — 所有对(一列)都处于同一方向。
Pop up alert — 弹出警报。
Push notifications — 推送通知。
E-mail notifications — 电子邮件通知。
Sound alert — 声音警报。


评论 3
Marek Borys
152
Marek Borys 2024.05.27 18:19 
 

ok

Alexander Eduardo Camarena Hermoso
305
 

Excelente indicador, lo mejor que eh visto, mil gracias

clausejmbm123
351
clausejmbm123 2020.11.23 22:02 
 

I am really pleased with this dashboard. It took my trading to the next level. The support is great. I requested a few changes on the system, which were realized on the same day. I am looking forward to buying the same dashboard for MT4. Thank you very much for this amazing tool. I really appreciate it.

推荐产品
Pips On Candles
Giuseppe Nittoli
Pips on Candles shows the number of pips involved in each candle on the chart. It is possible to set 3 different ranges for counting on each single candle via the RangeType parameter: With "HighLow" you count the pips present between the minimum and the maximum. The number is shown under each candlestick on the chart. With "OpenClose" you count the pips present between the opening and closing price of the candle. The number is shown under each candlestick on the chart. With "HighDistAndLowDist"
Engulfing Candlestick Bulkowski The engulfing candlestick is a well-known candle pattern composed of two candles. This indicator for showing engulfing candlestick that describe by Thomas Bulkowski. If you need for MetaTrader 4 version, please visit here: https://www.mql5.com/en/market/product/34193 Feature Highlights Show bullish engulfing and bearish engulfing. Customizable "Up Symbol". Customizable "Down Symbol". Customizable symbol distance from candlestick. Customizable "Down Color". Cus
Fractal Channel Breakout MT5
KEENBASE SOFTWARE SOLUTIONS
KT Fractal Channel Breakout draws a continuous channel by connecting the successive Up and Down fractals. It provides alerts and also plots the Up and Down arrows representing the bullish and bearish breakout of the fractal channel. Features If you use Bill Williams fractals in your technical analysis, you must also include it in your trading arsenal. It can be very effective and useful for stop-loss trailing. A new market trend often emerges after a fractal channel breakout in a new directi
ADR 警报仪表板一目了然地向您显示当前价格相对于其正常平均每日范围的交易位置。当价格超过您选择的平均范围和高于它的水平时,您将通过弹出窗口、电子邮件或推送获得即时警报,以便您可以快速跳入回调和反转。破折号旨在放置在空白图表上,只需坐在背景中并在达到水平时提醒您,因此您无需坐下来观看甚至看! 此处提供 MT4 版本: https://www.mql5.com/en/market/product/62756 新:现在还向您显示平均每周和每月范围,并提醒他们! 获取在您的图表上绘制水平的 ADR 反转指标: https://www.mql5.com/en/market/product/64477 大约 60% 的时间价格在其正常的平均每日范围 (ADR) 内交易并推高这些水平通常是价格急剧波动的指标,通常会出现回调(获利了结)走势。您可以通过交易从每日范围的顶部或底部回落到最近的支撑位或阻力位来利用这些急剧波动。 收集了超过 20 年的历史数据,以找出主要外汇对和一系列交叉盘的价格超出特定 ADR 水平的平均百分比。该数据表明价格仅在 3% 的时间内超过其 ADR 的
The indicator determines the state of the market: trend or flat. The state of the market is determined by taking into account volatility. The flat (trading corridor)is displayed in yellow. The green color shows the upward trend. The red color shows the downward trend. The height of the label corresponds to the volatility in the market. The indicator does not redraw . Settings History_Size   - the amount of history for calculation. Period_Candles  - the number of candles to calculate the
Deviation trend
VLADISLAV AKINDINOV
Indicator of trend deviation with a static level. The deviation coefficient is set for the trend histogram. Signals are the intersection of the level trend histogram in the direction of the trend or during a trend reversal - the option is selected in the indicator settings by the "Revers" parameter. There are all the necessary settings for the design of the indication and sending messages to mail or a mobile terminal. All input parameters have an intuitive name. Analog for MT4: https://www.mql5.
TrendDetect
Pavel Gotkevitch
The Trend Detect indicator combines the features of both trend indicators and oscillators. This indicator is a convenient tool for detecting short-term market cycles and identifying overbought and oversold levels. A long position can be opened when the indicator starts leaving the oversold area and breaks the zero level from below. A short position can be opened when the indicator starts leaving the overbought area and breaks the zero level from above. An opposite signal of the indicator can
Rwanda
Tatiana Savkevych
The main application of the Rwanda indicator is to generate buy and sell signals. Displays the Rwanda indicator signals on the price function chart using a mathematical approach. The indicator determines the long-term and short-term trend. The best result is given by the combination of the indicator with fundamental news, it can act as a news filter, that is, it can show how the market reacts to this or that news. With this indicator, you can predict future values. The indicator is designed t
ATR Profesional
Ignacio Agustin Mene Franco
ATR Professional. is an indicator similar to the bollinger, but this back is more advanced to scalp and long in h4 or h1, It has its bands, the strategy is that it marks entry when the candle leaves the band, or does it bounce on the upper roof or lower floor, works for all seasons! works for forex markets and synthetic indices also crypto! Good profit! World Investor.
LevelPAttern MT5 is a technical indicator based on the daily levels and Price Action patterns. The indicator is based on the standard ZigZag indicator + reversal candlestick pattens, such as Star, Hammer (also knows as Pin bar), Engulfing and others. The indicator generates audio and text notifications when a pattern is formed and a level is touched. It also supports sending email and push notifications. Indicator operation features It is suitable for working with any CFD and FOREX trading ins
Gekko Strong Bars
Rodrigo Galeote
This is Gekko's Strong Bars indicator. It produces signals when there is a strong bullish or bearish bar, for that it uses three different conditions: 1 - when the current bar is higher/lower than the last x bars (x is an input parameter), 2 - when the current bar size is higher than the average size of the last x bars (x is an input parameter) and 3 - when the current bar has a short candle tail (shadow). Inputs Plot Strong Bar Arrows for the past X Historical Bars: number of historical bars
The Trendline Automatic indicator is an advanced technical analysis tool specifically designed to assist traders in identifying critical levels in the financial markets through the automatic drawing of support and resistance trendlines on price charts. With its automatic capabilities, this indicator saves traders time and effort in analyzing price movements, allowing them to focus on making better trading decisions. Key Features : Automatic Drawing of Trendlines : This indicator allows traders t
Trade Extractor MT5
Philip Pankaj Suthagar
2 (1)
TRADE EXTRACTOR   is the fastest self-learning AI Algorithm, which will learn any market situation with ease.As a Manual trader, I came across the difficulty of finding the right parameter and the right condition to trade. There are infinite combinations of indicators and objects(trendlines, gann grid, fibo levels etc) which as an human, I can’t decide their winning rate or performance. Many claim to have a winning strategy but won’t have enough statistical support to prove their claims. Due to
ACB Breakout Arrows MT5
KEENBASE SOFTWARE SOLUTIONS
5 (1)
The ACB Breakout Arrows indicator provides a crucial entry signal in the market by detecting a special breakout pattern. The indicator constantly scans the chart for a settling momentum in one direction and provide the accurate entry signal right before the major move. Get multi-symbol and multi-timeframe scanner from here - Scanner for ACB Breakout Arrows MT 5 Key features Stoploss   and Take Profit levels are provided by the indicator. Comes with a MTF Scanner dashboard which tracks the br
KT 4 Timeframe Trend MT5
KEENBASE SOFTWARE SOLUTIONS
The KT 4 Time Frame Trend is an invaluable forex indicator for traders seeking to identify the trend direction across 4-time frames accurately. This innovative indicator allows users to simultaneously observe and analyze price trends across four different timeframes. Whether you're a beginner or an experienced trader, this tool offers an enhanced understanding of trend dynamics, leading to improved trading strategies on your trading platform. The capability to concurrently monitor multiple timef
R747 BreakLevels is smart indicator that automatically detects Support and Resistance levels on actual market trend. Strength of levels can be easily adjusted by changing parameter LevelsStrength in range of 2 (weak levels) and 50 (strong levels). This indicator is accessible in EA via iCustom functions and is fully customizable by user. There is possibility to send Push notifications and Alerts of newly found levels. Follow this link to get all detailed information: >> LINK << Features Adju
Beauty Trend
Nikolay Kositsin
Простой индикатор тренда в NRTR виде с отрисовкой линий стоплосса и тейпрофита, цвет и направление движения которых определяются действующим трендом. Индикатор имеет возможность подавать алерты, отправлять почтовые сообщения и push-сигналы при смене направления тренда. Следует учесть что значение входного параметра индикатора Deviation of the take profit line in points для каждого финансового актива на каждом таймфрейме   необходимо подбирать индивидуально!
Faradenza
Tatiana Savkevych
The main application of the Faradenza indicator is to generate buy and sell signals. The indicator tracks the market trend with unrivaled reliability, ignoring sharp market fluctuations and noise around the average price. Determining the market trend is an important task for traders. The Faradenza indicator implements an advanced algorithm for visualizing the market trend. It catches the trend and shows favorable moments of entering the market with arrows. The main purpose of the indicator is to
HIGH and LOW OTT
Mohammad Taher Halimi Tabrizi
This product is converted form Trading View of Kivanc Ozbilgic to be used on MT5 and below are descriptions of developer on Trading View: Anıl Özekşi's latest development on his precious OTT - Optimized Trend Tracker: In this version, there are two lines of OTT which are derived from HIGHEST price values (HOTT) and LOVEST price values (LOTT) which were originally sourced to CLOSE values on default OTT. Another significant difference is there is no Support Line (Moving Average) in this ver
ZigZag with Fibonacci
Rafael Caetano Pinto
This indicator uses the metaquotes ZigZag indicator as base to plot fibonacci extension and fibonacci retracement based in the Elliot waves. A fibonacci retracement will be plotted on every wave draw by the ZigZag. A fibonacci extension will be plotted only after the 2nd wave. Both fibonacci will be updated over the same wave tendency. Supporting until 9 consecutive elliot waves. Parameters: Depth: How much the algorithm will iterate to find the lowest and highest candles Deviation: Amoun
Oscillator trading signals - это динамический индикатор, определяющий состояние к продолжению тенденции роста или падению цены торгового инструмента и отсечению зон с нежелательной торговлей. Индикатор состоит из 2 линий осцилляторов. Медленная и быстрая сигнальная линия.  Шкала отображения перевернутая. Зоны вблизи 0 свидетельствуют о тенденции роста цены валютной пары. Зоны -100 свидетельствуют о падении цены валютной пары. На основном графике в виде стрелок отображается потенциально выгодные
Higher High Lower Low MT5
KEENBASE SOFTWARE SOLUTIONS
KT Higher High Lower Low marks the following swing points with their respective S/R levels: Higher High: The swing high made by the price that is higher than the previous high. Lower High: The swing high made by the price that is lower than the previous high. Lower Low: The swing low made by the price that is lower than the previous low.  Higher Low: The swing low made by the price that is higher than the previous low.   Features The intensity of swing high and swing low can be adjusted by cha
Trade history
Andriy Konovalov
5 (4)
The indicator plots charts of profit taken at the Close of candles for closed (or partially closed) long and short positions individually. The indicator allows to filter deals by the current symbol, specified expert ID (magic number) and the presence (absence) of a substring in a deal comment, to set the start time and the periodicity of profit reset (daily, weekly or monthly) to calculate the profit chart. The indicator also displays the floating (not fixed) profit of the opened positions at th
Fibrillar
Vitalii Zakharuk
It is very easy to use the Fibrillar indicator, since the simplest is to look at the chart and act according to the indications of the colored arrows. The algorithm takes into account the measurement of prices, and this method also focuses on measuring each of the price drops (H / C, H / O, LC, LO) - which gives more detailed information, but also more averaged. When calculating this indicator, logarithmic gains are first calculated at the closing price, which allows you to filter out the tre
An customize Indicator by which you can have Triple moving averages at close prices and send push notification on each crossing.  This indicator is especially useful when you are doing manual trading. Notes: Cation: forex trading is a very risky business,...              don't invest the money you cannot bear to lose.             the probability of losing is high ... more high aaaand exponentially high.... something like EMA enjoy losing with us...
The new update makes this indicator a complete tool for studying, analyzing and operating probabilistic patterns. It includes: On-chart Multi-asset percentage monitor. Configurable martingales. Twenty-one pre-configured patterns, including Mhi patterns and C3. An advanced pattern editor to store up to 5 custom patterns. Backtest mode to test results with loss reports. Trend filter. Hit operational filter. Martingale Cycles option. Various types of strategies and alerts. Confluence between patter
Your Trend Friend
Luigi Nunes Labigalini
5 (1)
The trend is your friend! Look at the color of the indicator and trade on that direction. It does not  repaint. After each candle is closed, that's the color of the trend. You can focus on shorter faster trends or major trends, just test what's most suitable for the symbol and timeframe you trade. Simply change the "Length" parameter and the indicator will automatically adapt. You can also change the color, thickness and style of the lines. Download and give it a try! There are big movements
"Hunttern harmonic pattern finder" base on the dynamic zigzag with the notification and prediction mode This version of the indicator identifies 11 harmonic patterns and predicts them in real-time before they are completely formed. It offers the ability to calculate the error rate of Zigzag patterns depending on a risk threshold. It moreover sends out a notification once the pattern is complete. The supported patterns: ABCD BAT ALT BAT BUTTERFLY GARTLEY CRAB DEEP CRAB CYPHER SHARK THREE
WT Vwap Bands
Ricardo Almeida Branco
The WT Vwap Bands indicator is an indicator that combines price and volume, helping to show whether the price is within the "fair price", overbought or oversold. The indicator code was designed for performance and has already been tested in a real trading account. In addition to the visual inputs (color, thickness and line style), the user can define a% value that depends on the price. The default values work with the most distant band at 1% of the price and then dividing this distan
This indicator scans the 1-3 Trendline pattern . The indicator is a 100 % non repaint low risk breakout system . The patterns are formed around swing high and swing lows which make them a low risk pattern with high reward. PATTERN BACKGROUND The 1-3 Trendline Breakout pattern is formed by four(4) points which are composed of three (3) primary points and the pattern neck. A trendline is always formed by the point 1 and the neck of the pattern . When price breaks out of the trendline formed ,
该产品的买家也购买
Atomic Analyst MT5
Issam Kassas
4.76 (17)
首先值得强调的是,该交易指标是非重绘、非延迟的指标,这使其成为手动和机器人交易的理想选择。 用户手册:设置、输入和策略。 Atomic Analyst是一种PA价格行动指标,利用价格的力量和动量来寻找市场上更好的机会。配备了高级过滤器,可帮助去除噪音和假信号,并提高交易潜力。使用多层复杂的指标,Atomic Analyst扫描图表,并将复杂的数学计算转化为任何初学者都能理解并用来做出一致交易决策的简单信号和颜色。 “Atomic Analyst”是专为新手和经验丰富的交易者量身定制的综合交易解决方案。它将高级指标和一流功能融合为一体的交易策略,使其成为所有类型交易者的多功能选择。 日内交易和剥头皮策略:专为快速准确的日内交易和短期交易而设计。 日内和摆动交易策略:可用作追求价格大幅波动的日内和摆动交易者的可靠工具。 多货币和市场:凭借其可靠的精度,在不同的工具和市场上运作。 多个时间框架:可在多个时间框架上使用,性能良好。 稳定性:所有指标均不重绘、不重绘和不滞后,确保可靠的信号。 信号清晰度:提供箭头信号,用于清晰的入场和出场点。 实时警报:通过交易入场、SL和TP警报通知交
首先,值得强调的是,这个交易系统是一个非重绘、非重画和非滞后的指标,这使得它非常适合手动和机器人交易。 在线课程,手册和下载预设。 “智能趋势交易系统 MT5”是专为新手和经验丰富的交易者量身定制的综合交易解决方案。它结合了超过 10 个优质指标,具有 7 多个强大的交易策略,使其成为适用于各种市场条件的多功能选择。 趋势跟随策略:提供精确的入场和止损管理,以有效地跟随趋势。 反转策略:识别潜在的趋势反转,使交易者能够利用区域市场的机会。 剃头策略:专为快速准确的日内交易和短期交易而设计。 稳定性:所有指标都不会重绘、不会重画和不会滞后,确保可靠的信号。 定制:支持自定义策略,以满足个人交易偏好。超过 7 种策略和组合可帮助您找到最佳策略。 信号清晰度:提供箭头信号,以指示清晰的入场和退出点。 实时警报:通过交易进出警报使交易者保持了解。 深入分析:提供更高时间框架的趋势分析和实时交易监控。 自适应颜色编码:利用蜡烛颜色编码来显示成交量、趋势和反转蜡烛信号。通过蜡烛颜色分析市场方向。 “智能趋势交易系统 MT5”赋予交易者必要的工具,以便在各种市场条件下做出明智和战略性的交易决策。无论
Quantum Trend Sniper
Bogdan Ion Puscasu
4.92 (48)
介绍   量子趋势狙击指标 ,突破性的 MQL5 指标,正在改变您识别和交易趋势反转的方式!由拥有超过13年交易经验的资深交易员团队开发,     量子趋势狙击指标   旨在通过其创新的方式以极高的准确度识别趋势反转,将您的交易之旅推向新的高度。 ***购买量子趋势狙击指标,即可免费获得量子突破指标!*** 当量子突破指标识别出趋势反转时,它会向您发出警报和信号箭头,并建议您三个止盈水平。 它既适合新手交易者,也适合专业交易者。 量子 EA 通道:       点击这里 MT4版本:       点击这里 建议: 时间范围: 所有时间范围。为了获得最佳结果,我们建议在 M15、M30 和 H1 时间范围内使用它。 货币对:欧元兑美元、英镑兑美元、澳元兑美元、欧元兑英镑、, EURAUD,  XAUUSD 账户类型:ECN、Raw 或 Razor,点差极低 经纪时间:任意 经纪商:IC Markets、Pepperstone with Raw 和 Razor 的点差最低 建议止损:50 点 建议止盈水平:20 点、50 点和
Gold Stuff mt5
Vasiliy Strukov
4.9 (181)
Gold Stuff mt5 是专为黄金设计的趋势指标,也可用于任何金融工具。 该指标不会重绘,也不会滞后。 推荐时间框架 H1。 购买后立即联系我以获得设置和个人奖励!   你可以在我的个人资料中找到它。   重要! 购买后立即与我联系,以获得说明和奖金!   您可以免费收到我们的强力支持和趋势扫描指标的副本,请私信。大部头书!   设置 绘制箭头 - 打开关闭。 在图表上绘制箭头。 警报 - 打开关闭声音警报。 电子邮件通知 - 打开关闭。 电子邮件通知。 Puch-notification - 打开关闭。 推送通知。 接下来,调整色域。 Gold Stuff mt5 是专为黄金设计的趋势指标,也可用于任何金融工具。 该指标不会重绘,也不会滞后。 推荐时间框架 H1。 购买后立即联系我以获得设置和个人奖励!   设置 绘制箭头 - 打开关闭。 在图表上绘制箭头。 警报 - 打开关闭声音警报。 电子邮件通知 - 打开关闭。 电子邮件通知。 Puch-notification - 打开关闭。 推送通知。 接下来,调整色域。
AT Forex Indicator MT5
Marzena Maria Szmit
5 (4)
The AT Forex Indicator MT5 is a sophisticated trading tool designed to provide traders with a comprehensive analysis of multiple currency pairs. This powerful indicator simplifies the complex nature of the forex market, making it accessible for both novice and experienced traders. AT Forex Indicator uses advanced algorithms to detect trends, patterns and is an essential tool for traders aiming to enhance their forex trading performance. With its robust features, ease of use, and reliable signal
介绍     Quantum Breakout PRO   ,突破性的 MQL5 指标,正在改变您交易突破区域的方式!由拥有超过13年交易经验的资深交易员团队开发,     量子突破 PRO     旨在通过其创新和动态的突破区域策略将您的交易之旅推向新的高度。 量子突破指标将为您提供带有 5 个利润目标区域的突破区域的信号箭头,以及基于突破框的止损建议。 它既适合新手交易者,也适合专业交易者。 量子 EA 通道:       点击这里 重要的!购买后请私信我领取安装手册。 建议: 时间范围:M15 货币对:GBPJPY、EURJPY、USDJPY、NZDUSD、XAUUSD 账户类型:ECN、Raw 或 Razor,点差极低 经纪商时间:GMT +3 经纪商:IC Markets、Pepperstone with Raw 和 Razor 的点差最低 规格: 不重漆! 最多 5 个建议利润目标区域 建议止损水平 可定制的盒子。您可以设置自己的 Box Time Start 和 Box Time End。 接触 如果您有任何疑问或需要帮
Entry Points Pro for MT5
Yury Orlov
4.55 (160)
这款指标用于 MT5,可提供准确的入场交易信号,且无重绘。 它可应用在任何金融资产:外汇、加密货币、贵金属、股票、指数。 它将提供极其精准的评估,并告诉您何时开仓和平仓的最佳时机。 观看 视频 (6:22),其中包含一个仅处理单一信号的示例,该信号即可值回指标购价! 大多数交易者在 Entry Points Pro 指标的帮助下,在第一个交易周内即改善了他们的交易结果。 订阅我们的 Telegram 群 ! Entry Points Pro 指标的益处。 入场信号无重绘 如果信号出现,并得到确认,则它不会再消失;不像是重绘指标,它会导致重大的财产损失,因为它们可以在显示信号后再将其删除。 无差错开仓 指标算法可令您找到入场交易(买入或卖出资产)的理想时机,从而提高每位交易者的成功率。 Entry Points Pro 可操作任何资产 它允许您在 MT5 平台上交易任何经纪商的加密货币、股票、贵金属、指数、大宗商品和货币。 提供任何方向的信号 Entry Points Pro 指标提供针对任意价格走势的入场交易信号 - 上涨、下跌或横盘(横向)。
首先,值得强调的是,这个交易工具是非重绘、非重画和非滞后的指标,非常适合专业交易。 在线课程,用户手册和演示。 智能价格行动概念指标是一个非常强大的工具,既适用于新手,也适用于经验丰富的交易者。它将超过20个有用的指标合并到一个指标中,结合了高级交易思想,如内圈交易员分析和智能资金概念交易策略。该指标侧重于智能资金概念,提供有关大型机构交易方式的见解,帮助预测它们的动向。 它在流动性分析方面尤其擅长,有助于理解机构的交易方式。它擅长预测市场趋势,并仔细分析价格波动。通过将您的交易与机构策略对齐,您可以更准确地预测市场走向。该指标多才多艺,擅长分析市场结构,识别重要的订单区块,并识别各种模式。 它擅长识别BOS和CHoCH等模式,理解动量的转变,并突出显示供需强劲的关键区域。它还擅长发现强大的不平衡,并分析价格创造更高高点或更低低点的模式。如果您使用斐波那契回撤工具,该指标可以满足您的需求。它还可以识别相等的高点和低点,分析不同的时间框架,并通过仪表板显示数据。 对于使用更高级策略的交易者,该指标提供了工具,如公平价值差指标和优惠和折扣区域的识别。它特别关注高时间框架订单
TPSpro RFI Levels MT5
Roman Podpora
5 (8)
Reversal First Impulse levels (RFI)      INSTRUCTIONS        RUS       -       ENG              R ecommended to use with an indicator   -   TPSpro  TREND PRO -  Version MT4                 A key element in trading is zones or levels from which decisions to buy or sell a trading instrument are made. Despite attempts by major players to conceal their presence in the market, they inevitably leave traces. Our task was to learn how to identify these traces and interpret them correctly. Main functi
Trend Screener Pro MT5
STE S.S.COMPANY
4.88 (66)
使用趋势筛选指标释放趋势交易的力量:由模糊逻辑和多货币系统提供支持的终极趋势交易解决方案! 使用趋势筛选器(由模糊逻辑提供支持的革命性趋势指标)提升您的趋势交易。 它是一个强大的趋势跟踪指标,结合了超过 13 种高级工具和功能以及 3 种交易策略,使其成为使您的 Metatrader 成为趋势分析器的多功能选择。 限时优惠:趋势筛选指标终身仅需 50 美元。 ( 原价 125$ ) (优惠延长) 体验趋势筛选器 100% 无需重新绘制的准确性,确保您的交易决策不受过去价格变化的影响。 释放多时间框架和多货币功能的多功能性,使您能够以无与伦比的信心在外汇、商品、加密货币和指数领域进行交易。 利用 Trend Screener 的综合策略套件增强您的交易: - 趋势跟踪策略和趋势延续策略 :趋势筛选器的趋势跟踪策略提供清晰的趋势延续信号,让您有效捕捉趋势走势并管理风险。 - 反转策略和早期入场点策略 :趋势筛选器的反转策略可检测市场方向的潜在变化,使您能够预测趋势反转并利用疲弱的市场趋势。通过早期入场点,您可以在潜在的趋势变化之前定位自己 获取可观的利润。 - 倒卖策略: 趋势筛选器的倒卖
FX Volume MT5
Daniel Stein
4.94 (17)
通过 mql5 和 Telegram 上 的 " 晨间简报 "获取每日市场更新,包括详细信息和屏幕截图 ! 外汇交易量(FX Volume)是第一个也是唯一一个从经纪商角度真正洞察市场情绪的交易量指标。 直接在您的图表上看到这些信息是真正改变游戏规则和突破性的交易解决方案。 受益于独特的市场数据洞察,如 比率(Ratios )显示货币多头和空头头寸的比率(百分比 比率变化 显示所选时间段内的多头比率及其百分比变化 总交易量 显示货币的总交易量(多头和空头),以手为单位 多头 交易量显示货币所有多头头寸的交易量 空头 交易量显示所有货币空头头寸的交易量 净多头 显示净多头交易量,即所有多头头寸减去所有空头头寸(以手为单位)。 净多头百分比 显示货币净多头交易量的变化 请阅读我们的基本教程 -> "如何使用外汇交易量进行交易 " 获取更多信息,如常见问题、交易技巧和教程视频,请访问我们的 外汇交易量公共信息频道 请 安装并运行 SI Connect 以建立与我们数据中心的持续连接 背景信息 我们都知道,外汇是一个分散的市场。这就是为什么我们必须打破常规思维,开发一个独
FX Power MT5 NG
Daniel Stein
5 (6)
通过 mql5 和 Telegram 上 的晨间简报获取每日市场更新,包括详细信息和屏幕截图 ! FX Power MT5 NG 是我们长期以来非常受欢迎的货币强度计算器 FX Power 的下一代产品。 这款下一代强度计算器能提供什么?您所喜爱的原版 FX Power 的所有功能 附加功能 黄金/XAU 强度分析 更精确的计算结果 可单独配置的分析周期 可自定义计算限制,以获得更好的性能 为希望查看更多信息的用户提供特殊的多实例设置 无尽的图形设置,可在每个图表中设置您最喜欢的颜色 无数的通知选项,让您再也不会错过任何重要信息 采用 Windows 11 和 macOS 风格的全新圆角设计 神奇的移动指标面板 FX Power 主要功能 所有主要货币的完整强势历史 所有时间框架内的货币强弱历史 所有经纪商和图表的计算结果完全相同 100% 可靠的实时计算 -> 无重绘 可通过下拉列表选择分析时段 通过自定义模式单独配置分析时段 可在一个图表中使用多个实例 可移动 FX Power 显示屏(通过拖放) 适用于高分辨率 QHD、UHD 和 4K 显示器 自动终端配置 针对平板电脑
PZ Day Trading MT5
PZ TRADING SLU
2.83 (6)
该指标仅使用价格行为分析和donchian渠道以锯齿形检测价格反转。它是专门为短期交易而设计的,根本不需要重新粉刷或补漆。对于精明的交易者来说,这是一个绝佳的工具,旨在增加他们的运作时间。 [ 安装指南 | 更新指南 | 故障排除 | 常见问题 | 所有产品 ] 极易交易 它在每个时间段都提供价值 实施自我分析统计 它实现了电子邮件/声音/视觉警报 基于可变长度的突破和拥挤区域,该指标仅使用价格行为来选择交易并对市场快速做出反应。 显示过去信号的潜在利润 该指标分析其自身的质量和性能 突围的损失突出显示并解决 该指标是不可重涂和不可重涂的 该指标将帮助盘中交易者不要错过单个价格反转。但是,并非所有价格反转都是一样的,也不是具有相同的可行质量。决定要突破哪些突破而忽略哪些取决于交易者的良好判断。 如何解释统计数据 该指标研究其自身信号的质量,并在图表上绘制相关信息。将分析每笔交易,并在图表的左上角显示总体历史结果,这使您可以针对任何给定的工具和时间范围自行优化指标参数。每个乐器和时间表都有其自己的最佳设置,您可以自己找到它们。 最大优惠交易:对于任何给定的交易,MFE都是
ICT, SMC, SMART MONEY CONCEPTS, SMART MONEY, Smart Money Concept, Support and Resistance, Trend Analysis, Price Action, Market Structure, Order Blocks, BOS/CHoCH,   Breaker Blocks ,  Momentum Shift,   Supply&Demand Zone/Order Blocks , Strong Imbalance,   HH/LL/HL/LH,    Fair Value Gap, FVG,  Premium  &   Discount   Zones, Fibonacci Retracement, OTE, Buy Side Liquidity, Sell Side Liquidity, BSL/SSL Taken, Equal Highs & Lows, MTF Dashboard, Multiple Time Frame, BigBar, HTF OB, HTF Market Structure
Matrix Arrow Indicator MT5
Juvenille Emperor Limited
5 (14)
矩阵箭头指标 MT5   是一种独特的 10 合 1 趋势,遵循   100% 非重绘多时间框架指标 ,可用于所有符号/工具: 外汇 、 商品 、 加密货币 、 指数 、 股票 。 Matrix Arrow Indicator MT5 将在其早期阶段确定当前趋势,从多达 10 个标准指标中收集信息和数据,它们是: 平均定向运动指数 (ADX) 商品渠道指数 (CCI) 经典 Heiken Ashi 蜡烛 移动平均线 移动平均收敛散度 (MACD) 相对活力指数 (RVI) 相对强弱指数 (RSI) 抛物线SAR 随机振荡器 威廉姆斯的百分比范围 当所有指标给出有效的买入或卖出信号时,相应的箭头将打印在图表上,在下一根蜡烛/柱线开盘时,指示强劲的上升趋势/下降趋势。用户可以选择使用哪些指标,并可以单独调整每个指标的参数。 Matrix Arrow Indicator MT5 仅从选定的指标中收集信息,并仅根据其数据打印箭头。   Matrix Arrow Indicator MT5   还可以为所有新信号发送终端、推送通知或电子邮件警报。无论您是黄牛、日内交易者还是波段交易者, Mat
PZ Trend Trading MT5
PZ TRADING SLU
3.67 (3)
许多盈利交易者不仅知道如何识别市场趋势,而且也能把握趋势建立后的交易机会。 Pz 趋势交易 指标设计用来在趋势行情中尽可能的赚取利润。 已建立的趋势提供了一揽子交易机会,但大多数趋势交易指标完全忽视了它们,让交易者在趋势行情时完全不知道该如何做!一般趋势指标只通知有关的趋势变化,但根本不足以得到卓越的回报. Pz 趋势交易 指标比一般趋势指标显示多达 20 倍的交易 , 因为它注重所谓的市场时机。它不仅显示当前的市场趋势,也有回调,内柱线的突破和调整。它令您在趋势回调之后介入,安全的柱线内突破金字塔加仓,以及发现潜在的反转,和已知的调整。 趋势改变 一个趋势改变在市场方向变化时发生。趋势变化在图表上用带数字的彩色圆圈显示。蓝色 (1) 信号为上涨开始, 而红色 (1) 信号为下跌开始。趋势变化并非评估当前价格动作的结果, 它意味着交易设置是不定时地。如果您正确使用本指标, 在趋势变化时, 您将将已经入场 (参看下面的调整)。 回调 但凡趋势在运动中,行情上下抖动,盈利者收割利润,且其它参与者入场。趋势回调代表好的买入机会,通常是由主力获利离场导致。如果行情在回调后回归上行, 指
XQ Indicator MetaTrader 5
Marzena Maria Szmit
5 (1)
Step into the realm of Forex trading with confidence and precision using XQ, a cutting-edge Forex indicator designed to elevate your trading game to unprecedented heights. Whether you're a seasoned trader or just stepping into the world of currency exchange, XQ Forex Indicator empowers you with the insights and signals needed to make informed trading decisions. The signal conditions are a combination of three indicators, and XQ Forex Indicator only display  medium and long-term trends . The ind
RelicusRoad Pro MT5
Relicus LLC
4.83 (23)
现在$ 147(更新后增加到$ 499) - 无限帐户(PC或Mac) RelicusRoad 用户手册 + 培训视频 + 访问 Private Discord Group + VIP 身份 一种看待市场的新方式 RelicusRoad 是世界上最强大的外汇、期货、加密货币、股票和指数交易指标,为交易者提供保持盈利所需的所有信息和工具。我们提供技术分析和交易计划,帮助每一位交易者取得成功,从初学者到高级。它是一个关键的交易指标,可以提供足够的信息来预测未来的市场。我们相信一个完整的解决方案,而不是图表上几个没有意义的不同指标。这是一个多合一指标,显示无与伦比且非常准确的信号、箭头 + 价格行为信息。 RelicusRoad 基于强大的人工智能,提供缺失的信息和工具来教育您并使您成为交易专家,成为成功的交易者。 几乎所有技术指标都滞后,这意味着它们只能报告已经发生的事情。因此,他们只确认您过去可以看到的价格已经在哪里。我们相信领先指标可以预测未来价格,而无需重新绘制,也不要过度依赖可能改变并导致重新绘制的滞后指标。如果您根据滞后指标进行交易并建立头寸,您就知道您已
IX Power MT5
Daniel Stein
4.2 (5)
IX Power 终于将 FX Power 的无与伦比的精确性带到了非外汇交易符号中。 它能准确判断您喜爱的指数、股票、商品、ETF 甚至加密货币的短期、中期和长期趋势强度。 您可以 分析 终端提供的 一切 。试试吧,体验一下您在交易时如何把握 时机 。 IX Power 主要功能 100% 精确的非重绘计算结果 - 适用于您终端中的所有交易符号 下拉式选择预配置以及可单独配置的强度分析周期 通过电子邮件、消息和手机通知的无数种通知选项 可访问的 EA 请求缓冲区 可自定义计算限制,以获得更好的性能 为希望查看更多信息的用户提供特殊的多实例设置 无尽的图形设置,让您在每个图表中都能找到最喜欢的颜色 采用 Windows 11 和 macOS 风格的圆角新面板设计 神奇的移动指标面板,可在子窗口和主图表之间无缝移动 适用于高分辨率 QHD、UHD 和 4K 显示器,并针对平板电脑和触摸屏进行了优化 IX Power 参数 最重要的参数不言自明,但我们很快会在另一篇文章中为您提供所有 IX Power 参数的完整说明。 使用别名 "参数可为技术交易符号
Advanced Supply Demand MT5
Bernhard Schweigert
4.53 (15)
任何新手或专业交易者的最佳解决方案! 该指标是一款独特、高质量、且价格合理的交易工具,因为我们已经整合了许多专有功能和新公式。 依据此更新,您将能够显示双重时间帧区域。 您不仅可以显示一个较高的时间帧,还可以同时显示图表时间帧,加上更高的时间帧:显示嵌套时区。 供需双方所有交易者都会喜欢它。 :) 重要信息披露 高级供需的最大潜力,请访问 https://www.mql5.com/zh/blogs/post/720245   想象您的交易如何得以改善,是因为您能够精准定位入场或目标位吗? 构建于新的底层算法,它可以更轻松地识别出买卖双方之间的潜在失衡。 这是因为它以图形方式展示供需最强劲区域,及其过去的表现(显示旧区域)。 这些功能旨在帮助您更轻松地发现最佳入场区域和价位。 现在您可以针对您的交易品种和时间帧来优化和编辑区域强度! 高级供需指标适用于所有产品和时间帧。 它是一个新的公式,非常新的功能是两个区域强度函数可由用户输入进行调整! 这在交易中是一大优势。 当您学习如何使用专有功能,例如带有价格游离最小 X 因子的区域强度时,您能够判断该区域强劲与否。 供需区域用作警报触发器
成為突破者,隨著價格反轉,市場結構會改變利潤。 訂單突破者指示器可以識別趨勢或價格走勢何時接近枯竭並準備好逆轉。它會提醒您市場結構的變化,通常會在發生逆轉或重大回調時發生。 該指標使用專有計算來確定突破和價格動能。每當在可能的耗盡點附近形成新的高點時,指標就會繪製最後一個生成該高點的順序塊。然後,它將隨價格移動隨價格跟隨定單。然後,當價格轉向相反方向並突破該訂單塊時,它會提醒您,從而創建新的市場結構並開始趨勢或重大回調的可能逆轉。 訂單塊是在創建高/低之前的最後一個相反的彩色蠟燭,並且當價格跌破這些關鍵區域以下時,這表明趨勢可能會發生短期或長期反轉。 特徵 提醒您關鍵耗盡點的市場結構變化 價格接近耗盡水平時自動提取訂單塊 在一個方向繼續移動時,在價格後面跟踪定單,以提醒您最佳的反轉輸入 將顏色更改為純色塊,以顯示何時發生市場結構中斷。 適用於所有交易品種和時間範圍 內置集成的彈出窗口和電子郵件警報 策略和如何與定單破壞者指標進行交易 當斷路器塊發生時,您有兩個選擇。 看左邊!我們正在尋求供應/需求或支撐/阻力位嗎?市場結構轉變(逆轉)通常發生在價格重新測試舊水平或
Quantum Heiken Ashi PRO MT5
Bogdan Ion Puscasu
4.5 (8)
Quantum Heiken Ashi PRO 简介 Heiken Ashi 蜡烛旨在提供对市场趋势的清晰洞察,以其过滤噪音和消除虚假信号的能力而闻名。告别令人困惑的价格波动,迎接更流畅、更可靠的图表表示。 Quantum Heiken Ashi PRO 的真正独特之处在于其创新公式,它将传统烛台数据转换为易于阅读的彩色条。红色和绿色条分别优雅地突出了看跌和看涨趋势,让您能够以非凡的精度发现潜在的进入和退出点。 量子 EA 通道:       点击这里 MT4版本:       点击这里 这一卓越的指标具有以下几个关键优势: 增强清晰度:通过平滑价格波动,Heiken Ashi 金条可以更清晰地反映市场趋势,使您更容易识别有利的交易机会。 减少噪音:告别经常导致错误信号的不稳定价格变动。 Quantum Heiken Ashi 指标可过滤噪音,使您能够做出更明智的交易决策 无缝集成:Heiken Ashi 指标专为 MetaTrader 开发,可无缝集成到您的交易平台中。它用户友好、高度可定制,并且与您的其他交易指标和过滤器兼容 无论您是寻求新优势的经验丰富的交易者,
Trend Line Map Pro MT5
STE S.S.COMPANY
4.3 (10)
趋势线图指标是趋势筛选器指标的插件。它用作趋势筛选器(趋势线信号)生成的所有信号的扫描仪。 它是基于趋势筛选器指标的趋势线扫描仪。如果您没有 Trend Screener Pro Indicator,Trend Line Map Pro 将无法使用。 It's a Trend Line Scanner based on Trend Screener Indicator. If you don't have Trend Screener Pro Indicator,     the Trend Line Map Pro will not work . 通过访问我们的 MQL5 博客,您可以下载趋势线图指标的免费版本。购买前试用,不受 Metatrader Tester 限制。 :  点击这里 1. 容易获得的优势 根据货币和时间范围显示买入和卖出信号。 评估自图表中出现箭头以来价格上涨或下跌的点数。 (趋势筛选指标箭头) 显示信号的时序。 获取多时间范围和多货币警报以购买和出售警报。 2. 如何使用趋势线图 如何显示买卖信号仪表板? 如果您有任何问题或需
Auto Order Block with break of structure based on ICT and Smart Money Concepts (SMC) Futures Break of Structure ( BoS )             Order block ( OB )            Higher time frame Order block / Point of Interest ( POI )    shown on current chart           Fair value Gap ( FVG ) / Imbalance   -  MTF      ( Multi Time Frame )    HH/LL/HL/LH  -  MTF      ( Multi Time Frame )  Choch  MTF      ( Multi Time Frame )  Volume Imbalance     ,  MTF          vIMB Gap’s Power of 3 Equal High
Trend Reversal Scanner MT5
Reza Aghajanpour
5 (4)
**   All Symbols   x   All Timeframes   scan just by pressing scanner button ** *** Contact me after the purchase to send you instructions and add you in "Trend Reversal group" for sharing or seeing experiences with other users. Introduction: Trendlines are the most famous technical analysis in trading . Trendlines continually form on the charts of markets across all the different timeframes providing huge opportunities for traders to jump in and profit on the action. In the other hand,  The tre
Gartley Hunter Multi
Siarhei Vashchylka
5 (7)
Gartley Hunter Multi - An indicator for searching for harmonic patterns simultaneously on dozens of trading instruments and on all possible timeframes. Manual (Be sure to read before purchasing) | Version for MT4 Advantages 1. Patterns: Gartley, Butterfly, Shark, Crab. Bat, Alternate Bat, Deep Crab, Cypher 2. Simultaneous search for patterns on dozens of trading instruments and on all possible timeframes 3. Search for patterns of all possible sizes. From the smallest to the largest 4. A
Legacy of Gann for MT5
Pavel Zamoshnikov
5 (6)
The indicator very accurately determines the levels of the possible end of the trend and profit fixing. The method of determining levels is based on the ideas of W.D.Gann, using an algorithm developed by his follower Kirill Borovsky. Extremely high reliability of reaching levels (according to K. Borovsky  - 80-90%) Indispensable for any trading strategy – every trader needs to determine the exit point from the market! Precisely determines targets on any timeframes and any instruments (forex, met
精密指数振荡器(Pi-Osc)由Precision Trading Systems的Roger Medcalf开发 版本2经过精心重新编码,以在您的图表上加载速度非常快,还加入了一些其他技术改进,以提高体验。 Pi-Osc旨在提供准确的交易定时信号,旨在找到极端的耗尽点,这些点是市场被迫去触及,以清理每个人的止损单。 该产品解决了一个古老的问题,即知道极端点在哪里,这使得交易员的生活变得更加简单。 这是一个高度复杂的共识指标,与行业标准的振荡器相比,具有一些强大的区别。 它使用的一些特征包括需求指数、资金流动、RSI、随机指标、模式识别、成交量分析、标准偏差极端点以及不同长度上述各种变化的分歧。 乍一看,对于未经培训的人来说,它似乎与任何其他振荡器没有什么不同,但当与其他振荡器(如RSI或动量等)相对比时,这个指标的真正威力开始显现。 据我所知,没有其他振荡器可以频繁地精确指出顶部和底部,具有相同的定期效率。 精密指数振荡器由许多不同的数学方程组成,用于测量多个时间框架采样中的价格和成交量变动,从而高度准确地预测趋势可能发生转折的位置。 PTS P
TPA True Price Action indicator reveals the true price action of the market makers through 100% non-repainting signals strictly at the close of a candle! TPA shows entries and re-entries, every time the bulls are definitely stronger than the bears and vice versa. Not to confuse with red/green candles. The shift of power gets confirmed at the earliest stage and is ONE exit strategy of several. There are available now two free parts of the TPA User Guide for our customers. The first "The Basics"
作者的更多信息
Heikin Ashi Dashboard
Taras Slobodyanik
5 (3)
多货币和多时间框架 Heikin Ashi 指标。 显示了当前的市场状况。 在扫描仪面板上,您可以看到当前趋势的方向、强度和条形数量。 盘整/反转蜡烛也用颜色显示。 您可以在参数中指定任何所需的货币和期间。 此外,当趋势发生变化或出现反转和盘整蜡烛(十字星)时,指标可以发送通知。 通过单击单元格,将打开该符号和句点。 这是 MTF 扫描仪。 Heikin-Ashi 是日本的交易指标和金融图表,意思是“平均速度”。 Heikin-Ashi 图表类似于烛台图,但具有更平滑的外观,因为它们跟踪一系列价格变动,而不是像烛台那样跟踪每个价格变动。 Heikin-Ashi 由 Munehisa Homma 在 1700 年代创建,他还创建了烛台图。 交易者和投资者使用这些图表来帮助确定和预测价格变动。 参数 Averaging Method for Smoothing — 选择平滑蜡烛价格的方法。 — Simple MA — 简单 MA — Exponential MA — 指数 MA — Smoothed MA — 平滑 MA — Linear weighted MA — 线性加权
Heikin Ashi Dashboard MT5
Taras Slobodyanik
5 (2)
多货币和多时间框架 Heikin Ashi 指标。 显示了当前的市场状况。 在扫描仪面板上,您可以看到当前趋势的方向、强度和条形数量。 盘整/反转蜡烛也用颜色显示。 您可以在参数中指定任何所需的货币和期间。 此外,当趋势发生变化或出现反转和盘整蜡烛(十字星)时,指标可以发送通知。 通过单击单元格,将打开该符号和句点。 这是 MTF 扫描仪。 Heikin-Ashi 是日本的交易指标和金融图表,意思是“平均速度”。 Heikin-Ashi 图表类似于烛台图,但具有更平滑的外观,因为它们跟踪一系列价格变动,而不是像烛台那样跟踪每个价格变动。 Heikin-Ashi 由 Munehisa Homma 在 1700 年代创建,他还创建了烛台图。 交易者和投资者使用这些图表来帮助确定和预测价格变动。 参数 Averaging Method for Smoothing — 选择平滑蜡烛价格的方法。 — Simple MA — 简单 MA — Exponential MA — 指数 MA — Smoothed MA — 平滑 MA — Linear weighted MA — 线性加权
Fractals Dashboard MT4
Taras Slobodyanik
5 (3)
分形指标的多货币和多时间框架修改。 显示最后两个分形 - 它们的序列(以及哪一个被破坏),或它们之间的距离。 您可以在参数中指定任何所需的货币和时间范围。 此外,该面板还可以发送有关分形突破的通知。 通过单击带有句点的单元格,将打开该符号和句点。 这是 MTF 扫描仪。 默认情况下,从图表中隐藏仪表板的键是“D”。 参数 Calculation of fractals based on — 分形搜索模式; — standart indicator — 按标准指标; — user bars — 按自定义栏的数量(可调整分形); Bars before (user calc) — 分形之前的柱数; Bars after (user calc) — 分形后的条数; Indicator mode — 显示模式 — Arrows — 分形的最后两个箭头; — Distance — 最后两个分形之间的距离; Show fractals on the chart — 在图表上显示当前分形; Clear the chart at startup — 启动时清除图表。 Set of Pa
Time Scale for MT5
Taras Slobodyanik
4.88 (17)
The indicator draws the time scale on the chart. You can specify the time offset, adjust the size and font to display on the chart ( it is displaying your local time on your chart instead of MT time ). You can also select the desired format for displaying the date and time. You may be interested in my other product , which contains a more advanced version of the Time Scale . Parameters Hours (time shift) — time shift (hours); Minutes (time shift) — time shift (minutes); Show time on mouse — sh
FREE
Symbol Manager
Taras Slobodyanik
5 (5)
Symbol Manager or Grid Manager, designed to group orders into one position (by symbol and by direction). This utility will be useful to multi-currency traders, who can have multiple orders on several pairs. You will be able to see the total number of lots, the total profit, and set virtual stop loss and virtual take profit. To set a real TP (or SL), you must first set the virtual value, and then enter the command in this cell: "set". If you want to set real TP/SL for all orders at once, then en
随机振荡器的多货币和多时间框架修改。 您可以在参数中指定任何所需的货币和时间范围。 该面板显示当前值和线的交点 - 信号线和主线(随机交叉)。 此外,该指标还可以在跨越超买和超卖水平时发送通知。 通过单击带有句点的单元格,将打开该符号和句点。 这是 MTF 扫描仪。 与货币强度计类似,仪表板可以自动选择包含指定货币的货币对,或以该货币为基础货币的货币对。该指标在“货币对集合”中指定的所有货币对中搜索货币;其他货币对将被忽略。并根据这些货币对计算该货币的总随机指标。您可以看到该货币的强弱程度。 默认情况下,从图表中隐藏仪表板的键是“D”。 参数 %K Period — K 线的周期。 %D Period — D 线的周期。 Slowing — 放慢; Method — 平均法; Price field — 价格类型。 Line of indicator — 线索引。 Clear the chart at startup — 启动时清除图表。 Set of Pairs — 符号集: — Market Watch — 来自“市场观察”的配对。 — Specified man
ZigZag Lines MTF
Taras Slobodyanik
4.27 (11)
多时间框架锯齿形调整浪指标。 它显示支撑/阻力水平线及其突破,并绘制当前的市场目标。 它还可以显示分形指标的线条和其他时期(最多季度)的蜡烛。 该指标重新绘制最后一个(当前)点,并且在某些情况下可以更改最后 2-3 个点。 所有线条均绘制为对象(不是指标缓冲区,但有可能接收 EA 的数据)。 在 Expert Advisor 中使用时,您可以使用 iCustom 读取 ZigZag 点。 设置 Mode — 根据以下因素绘制支撑位和阻力位: —  Zig Zag — ZigZag 指标; —  ZigZag Close — 之字折线收盘指标; —  Fractals — 分形指标; —  High-Low of the period — 通过高低水平构建指标。 时间范围在Period参数中指定; —  Candles only — 仅绘制蜡烛; Depth — 如果最后一根蜡烛的偏差小于(或大于)前一根,则 Zigzag 将不会绘制第二个最大值(或最小值)的烛台的最小数量; Deviation — 锯齿形形成局部顶部/底部的两个相邻烛台的最高点/最低点之间的最小点数; B
News Dashboard MT4
Taras Slobodyanik
4.43 (7)
该仪表板显示来自三个来源的当前新闻:来自 ForexFactory.com 网站(FFC 日历)、来自 Investing.com 网站和来自 mql5.com 的经济日历。 您可以按影响力和国家对新闻进行排序,并一键将其显示在图表上。 通过按住“Ctrl”键,您可以选择几种不同的“货币”或“影响”进行排序。 此外,该实用程序不仅显示预测,还显示它们出现在网站上后的实际值。 您可以为每条新闻设置单独的通知。 来自 mql5.com 的新闻,采用您的 MT5 语言。 您可以使用 EA 或指标来阅读新闻。 更多详情请参阅评论中的描述。 EA 可以在新闻发布前关闭市场头寸和挂单,将止损移至盈亏平衡点并在当天结束时平仓。 另外,在评论中,您可以找到一个脚本,该脚本可以从仪表板读取新闻,并通过单击“Algo Trading”按钮停止所有 EA 的交易。 该程序从互联网获取信息,因此您需要在终端设置中启用对 ForexFactory 和 Investing.com 网站的访问。 按“ctrl+O”、“Expert Advisors”、“Allow WebRequest”,然后将链接复
Fractals Dashboard MT5
Taras Slobodyanik
5 (3)
分形指标的多货币和多时间框架修改。 显示最后两个分形 - 它们的序列(以及哪一个被破坏),或它们之间的距离。 您可以在参数中指定任何所需的货币和时间范围。 此外,该面板还可以发送有关分形突破的通知。 通过单击带有句点的单元格,将打开该符号和句点。 这是 MTF 扫描仪。 默认情况下,从图表中隐藏仪表板的键是“D”。 参数 Calculation of fractals based on — 分形搜索模式; — standart indicator — 按标准指标; — user bars — 按自定义栏的数量(可调整分形); Bars before (user calc) — 分形之前的柱数; Bars after (user calc) — 分形后的条数; Indicator mode — 显示模式 — Arrows — 分形的最后两个箭头; — Distance — 最后两个分形之间的距离; Show fractals on the chart — 在图表上显示当前分形; Clear the chart at startup — 启动时清除图表。 Set of Pa
ADX Dashboard
Taras Slobodyanik
5 (4)
ADX 指标用于确定趋势及其强度。 价格的方向由 +DI 和 -DI 值显示,ADX 值显示趋势的强度。 如果+DI高于-DI,则市场处于上升趋势,如果相反,则市场处于下降趋势。 如果 ADX 低于 20,则没有明确的方向。 一旦指标突破该水平,中等强度的趋势就会开始。 值高于 40 表示强劲趋势(下降趋势或上升趋势)。 平均方向运动指数 (ADX) 指标的多货币和多时间框架修改。 您可以在参数中指定任何所需的货币和时间范围。 此外,当趋势强度水平被交叉时,以及当 +DI 和 -DI 线被交叉时,指标可以发送通知。 通过单击带有句点的单元格,将打开该符号和句点。 这是 MTF 扫描仪。 与货币强度计类似,仪表板可以自动选择包含指定货币的货币对,或以该货币为基础货币的货币对。该指标在“货币对集合”中指定的所有货币对中搜索货币;其他货币对将被忽略。并根据这些货币对计算该货币的总 ADX。您可以看到该货币的强弱程度。 默认情况下,从图表中隐藏仪表板的键是“D”。 参数 ADX Period — 平均周期。 ADX Applied Price — 价格类型。 Clear th
Dashboard RSI Multicurrency
Taras Slobodyanik
5 (6)
相对强弱指数 (RSI) 指标的多货币和多时间框架修改。 您可以在参数中指定任何所需的货币和时间范围。 此外,该面板还可以在跨越超买和超卖水平时发送通知。 通过单击带有句点的单元格,将打开该符号和句点。 这是 MTF 扫描仪。 默认情况下,从图表中隐藏仪表板的键是“D”。 与货币强度计类似,仪表板可以自动选择包含指定货币的货币对,或以该货币为基础货币的货币对。该指标在“货币对集合”中指定的所有货币对中搜索货币;其他货币对将被忽略。并根据这些货币对计算该货币的总 RSI。您可以看到该货币的强弱程度。 参数 RSI Period — 平均周期。 RSI Applied price — 价格类型。 Clear the chart at startup — 启动时清除图表。 Set of Pairs — 符号集 — Market Watch — 来自“市场观察”的配对。 — Specified manually — 在参数“Pairs”中手动指定对。 — Current pair — 仅显示当前对。 Pairs (separated by a space or semic
ZigZag Lines MTF for MT5
Taras Slobodyanik
5 (7)
多时间框架锯齿形调整浪指标。 它显示支撑/阻力水平线及其突破,并绘制当前的市场目标。 它还可以显示分形指标的线条和其他时期(最多季度)的蜡烛。 该指标重新绘制最后一个(当前)点,并且在某些情况下可以更改最后 2-3 个点。 所有线条均绘制为对象(不是指标缓冲区,但有可能接收 EA 的数据)。 在 Expert Advisor 中使用时,您可以使用 iCustom 读取 ZigZag 点。 设置 Mode — 根据以下因素绘制支撑位和阻力位: —  Zig Zag — ZigZag 指标; —  ZigZag Close — 之字折线收盘指标; —  Fractals — 分形指标; —  High-Low of the period — 通过高低水平构建指标。 时间范围在Period参数中指定; —  Candles only — 仅绘制蜡烛; Depth — 如果最后一根蜡烛的偏差小于(或大于)前一根,则 Zigzag 将不会绘制第二个最大值(或最小值)的烛台的最小数量; Deviation — 锯齿形形成局部顶部/底部的两个相邻烛台的最高点/最低点之间的最小点数; B
Lines Profit Loss MT5
Taras Slobodyanik
4.59 (17)
该指标显示当前交易品种的盈利(亏损)。 您可以自由拖放线条来显示当前的盈利或亏损。 参数 Calculation in money or in points — 以点数或货币计算利润/损失。 Add pending orders to calculate — 在计算中考虑挂单。 Magic Number (0 - all orders on symbol) — 幻数,如果需要评估特定订单。 Offset for first drawing (points from the average price) — 线距第一次开始时的平均价格的偏移量。 Decimal places for calculating the Sum — 显示总和的小数点后的位数。 Decimal places for calculating the Percentage — 显示百分比的小数点后的位数。 Tuning 调音 Color of the profit line — 利润线的颜色。 Color of the loss line — 损失线的颜色。 Line style — 线条样式。 L
FREE
Pro Sessions MT4
Taras Slobodyanik
4.25 (4)
这是一个交易时段指标,可以显示四个交易时段的所有级别(开盘价-最高价-最低价-收盘价)。 该指标还可以预测会话级别。 会话可以用线条或矩形(空的或填充的)绘制,线条可以延伸到下一个会话。 您可以通过按热键(默认为“1”、“2”、“3”、“4”)轻松隐藏/显示每个会话。 您可以看到 ASR(平均会话范围)线(默认热键“A”) 。 这与 ADR 计算类似,只是它是根据最后一个 X 交易时段计算的,这使您可以看到当前(和之前)交易时段的潜在范围(今天价格可以移动多远)。 平均值的计算方式为之前会话的总和除以会话数(参数“ASR 周期(计算平均值的会话数)”),每个会话都有自己的 ASR 值。 该指标计算并绘制未来的会话及其大小。 正确识别报价历史记录中的漏洞。 它还可以在每个会话开始时绘制垂直分隔符。 指标自动确定图表的配色方案。 当价格触及会话水平或价格突破已关闭会话指定距离时,它还会发送警报。 可以禁用每个会话的警报。 参数“如果其他会话启动则停止会话”(热键“S”)允许您停止过时的会话,并在新会话中断时接收警报。 该指标可以绘制枢轴水平并就其发送警报。 这些级
Lines Profit Loss
Taras Slobodyanik
4.82 (22)
该指标显示当前交易品种的盈利(亏损)。 您可以自由拖放线条来显示当前的盈利或亏损。 参数 Calculation in money or in points — 以点数或货币计算利润/损失。 Add pending orders to calculate — 在计算中考虑挂单。 Magic Number (0 - all orders on symbol) — 幻数,如果需要评估特定订单。 Offset for first drawing (points from the average price) — 线距第一次开始时的平均价格的偏移量。 Decimal places for calculating the Sum — 显示总和的小数点后的位数。 Decimal places for calculating the Percentage — 显示百分比的小数点后的位数。 Tuning 调音 Color of the profit line — 利润线的颜色。 Color of the loss line — 损失线的颜色。 Line style — 线条样式。 L
FREE
Pro Sessions MT5
Taras Slobodyanik
5 (1)
这是一个交易时段指标,可以显示四个交易时段的所有级别(开盘价-最高价-最低价-收盘价)。 该指标还可以预测会话级别。 会话可以用线条或矩形(空的或填充的)绘制,线条可以延伸到下一个会话。 您可以通过按热键(默认为“1”、“2”、“3”、“4”)轻松隐藏/显示每个会话。 您可以看到   ASR(平均会话范围)线(默认热键“A”) 。 这与 ADR 计算类似,只是它是根据最后一个 X 交易时段计算的,这使您可以看到当前(和之前)交易时段的潜在范围(今天价格可以移动多远)。 平均值的计算方式为之前会话的总和除以会话数(参数“ASR 周期(计算平均值的会话数)”),每个会话都有自己的 ASR 值。 该指标计算并绘制未来的会话及其大小。 正确识别报价历史记录中的漏洞。 它还可以在每个会话开始时绘制垂直分隔符。 指标自动确定图表的配色方案。 当价格触及会话水平或价格突破已关闭会话指定距离时,它还会发送警报。 可以禁用每个会话的警报。 参数“如果其他会话启动则停止会话”(热键“S”)允许您停止过时的会话,并在新会话中断时接收警报。 该指标可以绘制枢轴水平并就其发送警报。 这
Inside Bar Dashboard
Taras Slobodyanik
5 (2)
多货币和多时间范围指标 Inside Bar (IB)。 在参数中,您可以指定任何所需的货币和时间范围。 该面板显示最后找到的内部柱线(和母柱线)形态、当前价格位置以及母线和内部柱线水平的突破。 您可以设置单元格中的条形和文本的大小和颜色。 当水平被突破时,该指标还可以发送通知。 通过单击带有句点的单元格,将打开指定的交易品种和句点。 这是 MTF 扫描仪。 默认情况下,从图表中隐藏仪表板的键是“D”。 参数 How long pattern will be valid after first breakout (bars) — 信号将在单元格中显示多少柱。 IB body must be inside of the MB body - IB 主体必须位于 MB 主体内部。 IB body and wicks must be inside the MB body - IB 主体和灯芯必须位于 MB 主体内。 If MB is IB, choose the next MB — 如果找到的母柱是前一个信号的内柱,则将显示前一个信号。 MB body must be larg
CCI Dashboard for MT4
Taras Slobodyanik
5 (3)
商品通道指数 (CCI) 指标的多货币和多时间框架修改。 您可以在参数中指定任何所需的货币和时间范围。 此外,该面板还可以在跨越超买和超卖水平时发送通知。 通过单击带有句点的单元格,将打开该符号和句点。 这是 MTF 扫描仪。 默认情况下,从图表中隐藏仪表板的键是“D”。 参数 CCI Period — 平均周期。 CCI Applied price — 价格类型。 Clear the chart at startup — 启动时清除图表。 Set of Pairs — 符号集 — Market Watch — 来自“市场观察”的货币对; — Specified manually — 在参数“Pairs”中手动指定对。 — Current pair — 当前对。 Pairs (separated by a space or semicolon) — 由空格或分号分隔的符号列表。 货币名称的书写方式应与经纪商的名称完全相同,并保留大小写和前缀/后缀。 Time Frames (separated by a space or semicolon) — 由空格或分号分隔的时
ADX Dashboard MT5
Taras Slobodyanik
5 (3)
ADX 指标用于确定趋势及其强度。 价格的方向由 +DI 和 -DI 值显示,ADX 值显示趋势的强度。 如果+DI高于-DI,则市场处于上升趋势,如果相反,则市场处于下降趋势。 如果 ADX 低于 20,则没有明确的方向。 一旦指标突破该水平,中等强度的趋势就会开始。 值高于 40 表示强劲趋势(下降趋势或上升趋势)。 平均方向运动指数 (ADX) 指标的多货币和多时间框架修改。 您可以在参数中指定任何所需的货币和时间范围。 此外,当趋势强度水平被交叉时,以及当 +DI 和 -DI 线被交叉时,指标可以发送通知。 通过单击带有句点的单元格,将打开该符号和句点。 这是 MTF 扫描仪。 与货币强度计类似,仪表板可以自动选择包含指定货币的货币对,或以该货币为基础货币的货币对。该指标在“货币对集合”中指定的所有货币对中搜索货币;其他货币对将被忽略。并根据这些货币对计算该货币的总 ADX。您可以看到该货币的强弱程度。 默认情况下,从图表中隐藏仪表板的键是“D”。 参数 ADX Period — 平均周期。 ADX Applied Price — 价格类型。 Clear th
Stochastic Oscillator displays information simultaneously from different periods in one subwindow of the chart. Parameters %K Period — K-period (number of bars for calculations). %D Period — D-period (period of first smoothing). Slowing — final smoothing. Method — type of smoothing. Price field — stochastic calculation method . Timeframes for Stochastic — list of periods, separated by a space or comma or semicolon. Number of bars for each period — the number of bars displayed for each period.
ZigZag Dashboard for MT4
Taras Slobodyanik
4.75 (4)
ZigZag 指标的多货币和多时间框架修改。 显示市场的当前方向、上次走势的高度、本次走势中的柱数以及锯齿形调整浪(水平线)的前一个点的突破。 这是 MTF 扫描仪。 您可以在参数中指定任何所需的货币和时间范围。 此外,当之字折线改变方向或突破前一点时,面板可以发送通知。 通过单击带有句点的单元格,将打开该符号和句点。 参数 Depth — 如果最后一根蜡烛的偏差小于(或大于)前一根,则 Zigzag 将不会绘制第二个最大值(或最小值)的烛台的最小数量; Deviation — 锯齿形形成局部顶部/底部的两个相邻烛台的最高点/最低点之间的最小点数; Backstep — 局部高点/低点之间的最小烛台数量; Bars to calculate ZZ — 历史中用于查找 ZigZag 点的柱的数量; ZZ-wave info — 表格中显示有关波形的哪些信息 — 仅当前波形或当前波形 + 上一个波形; Highlight the symbol when all periods are in the same direction — 方向时突出显示该符号; Symbol highl
Symbol Manager for MT5
Taras Slobodyanik
5 (1)
Symbol Manager or Grid Manager, designed to group orders into one position (by symbol and by direction). This utility will be useful to multi-currency traders, who can have multiple orders on several pairs. You will be able to see the total number of lots, the total profit, and set virtual stop loss and virtual take profit. To set a real TP (or SL), you must first set the virtual value, and then enter the command in this cell: "set". If you want to set real TP/SL for all orders at once, then en
该仪表板显示来自三个来源的当前新闻:来自 ForexFactory.com 网站(FFC 日历)、来自 Investing.com 网站和来自 mql5.com 的经济日历。 您可以按影响力和国家对新闻进行排序,并一键将其显示在图表上。 通过按住“Ctrl”键,您可以选择几种不同的“货币”或“影响”进行排序。 此外,该实用程序不仅显示预测,还显示它们出现在网站上后的实际值。 您可以为每条新闻设置单独的通知。 来自 mql5.com 的新闻,采用您的 MT5 语言。 您可以使用 EA 或指标来阅读新闻。 更多详情请参阅评论中的描述。 EA 可以在新闻发布前关闭市场头寸和挂单,将止损移至盈亏平衡点并在当天结束时平仓。 另外,在评论中,您可以找到一个脚本,该脚本可以从仪表板读取新闻,并通过单击“Algo Trading”按钮停止所有 EA 的交易。 该程序从互联网获取信息,因此您需要在终端设置中启用对 ForexFactory 和 Investing.com 网站的访问。 按“ctrl+O”、“Expert Advisors”、“Allow WebRequest”,然后将链接复
Bollinger Bands Dashboard MT5
Taras Slobodyanik
5 (1)
布林带指标的多货币和多时间框架修改。 在仪表板上,您可以看到布林带的突破和触及。 在参数中,您可以指定任何所需的货币和时间范围。 当价格触及布林线、当前波动率发生变化(扩大或下跌)以及价格触及所有布林线时,该指标还可以发送通知。 通过单击带有句点的单元格,将打开该符号和句点。 这是 MTF 扫描仪。 默认情况下,从图表中隐藏仪表板的键是“D”。 参数 Bollinger Bands Settings Averaging period — 计算指标的平均周期。 Standard deviations — 与主线的标准差数。 Bands shift — 指标相对于价格图表的移动。 Applied price — 用于计算的价格。 Show BB on the current chart — 在当前图表上显示 BB。 仪表板 Clear the chart at startup — 启动时清除图表。 Set of Pairs — 符号集 — Market Watch — 来自“市场观察”的配对。 — Specified manually — 在参数“Pairs”中手动指定对。
MA Dashboard
Taras Slobodyanik
4.5 (2)
移动平均线 (MA) 指标的多货币和多时间范围修改。 在仪表板上,您可以看到指标的当前状态 - 快速 MA 和慢速 MA 的突破和触及(按价格),以及 MA 线彼此之间的交叉点(移动平均线交叉)。 在参数中,您可以指定任何所需的货币和时间范围。 此外,该指标还可以发送有关价格触及线及其交叉的通知。 通过单击带有句点的单元格,将打开该符号和句点。 这是 MTF 扫描仪。您可以在图表上运行多个仪表板。 该指标在当前图表上显示快速 MA 线和慢速 MA 线。 您可以为图表选择 MA 时间范围并从其他时间范围观察 MA (MTF MA)。 两组MA的热键默认为“1”和“2”。 默认情况下,从图表中隐藏仪表板的键是“D”。 参数 Fast MA — 快速MA Averaging period — 平均周期。 Shift — 转移。 Averaging method — 平均法。 Applied price — 适用价格。 Slow MA — 慢MA Averaging period — 平均周期。 Shift — 转移。 Averaging method — 平均法。 Ap
随机振荡器的多货币和多时间框架修改。 您可以在参数中指定任何所需的货币和时间范围。 该面板显示当前值和线的交点 - 信号线和主线(随机交叉)。 此外,该指标还可以在跨越超买和超卖水平时发送通知。 通过单击带有句点的单元格,将打开该符号和句点。 这是 MTF 扫描仪。 与货币强度计类似,仪表板可以自动选择包含指定货币的货币对,或以该货币为基础货币的货币对。该指标在“货币对集合”中指定的所有货币对中搜索货币;其他货币对将被忽略。并根据这些货币对计算该货币的总随机指标。您可以看到该货币的强弱程度。 默认情况下,从图表中隐藏仪表板的键是“D”。 参数 %K Period — K 线的周期。 %D Period — D 线的周期。 Slowing — 放慢; Method — 平均法; Price field — 价格类型。 Line of indicator — 线索引。 Clear the chart at startup — 启动时清除图表。 Set of Pairs — 符号集: — Market Watch — 来自“市场观察”的配对。 — Specified man
Time Scale
Taras Slobodyanik
4.8 (10)
The indicator draws the time scale on the chart. You can specify the time offset, adjust the size and font to display on the chart (it is displaying your local time on your chart instead of MT time). You can also select the desired format for displaying the date and time. While holding down the middle mouse button, and moving the cursor, a slider will appear on the scale. You may be interested in my other product , which contains a more advanced version of the Time Scale. Parameters Hours (tim
FREE
MACD Dashboard
Taras Slobodyanik
多货币和多时间框架指标 MACD。 仪表板可以显示传统(真实)MACD 和 MetaTrader 中内置的 MACD。 在面板上,您可以看到指标的当前状态 - MACD 线的移动方向、它们的交点以及带有指标图表的弹出窗口。 在参数中,您可以指定任何所需的交易品种和时间范围。 扫描仪还可以发送有关线相互交叉以及线穿过零电平的通知。 通过单击单元格,将打开给定的符号和句点。 因此,您可以轻松扫描所有时间范围的所有货币对和交易品种,以找到 MACD 主线和信号线或零水平的交叉点。 显示/隐藏仪表板的热键默认为“D”。 默认情况下,启用/禁用弹出图表的热键为“C”。 用于切换图表“1”和“2”上的箭头的热键。 MACD(移动平均收敛/发散)指标(或“振荡指标”)是根据历史价格数据(最常见的是收盘价)计算得出的三个时间序列的集合。 这三个系列是:MACD 系列本身、“信号”或“平均”系列以及“背离”系列(两者之间的区别)。 MACD 系列是价格系列的“快速”(短期)指数移动平均线 (EMA) 和“慢速”(较长周期)EMA 之间的差异。 平均数系列是 MACD 系列本身的 EMA。
相对强弱指数 (RSI) 指标的多货币和多时间框架修改。 您可以在参数中指定任何所需的货币和时间范围。 此外,该面板还可以在跨越超买和超卖水平时发送通知。 通过单击带有句点的单元格,将打开该符号和句点。 这是 MTF 扫描仪。 默认情况下,从图表中隐藏仪表板的键是“D”。 与货币强度计类似,仪表板可以自动选择包含指定货币的货币对,或以该货币为基础货币的货币对。该指标在“货币对集合”中指定的所有货币对中搜索货币;其他货币对将被忽略。并根据这些货币对计算该货币的总 RSI。您可以看到该货币的强弱程度。 参数 RSI Period — 平均周期。 RSI Applied price — 价格类型。 Clear the chart at startup — 启动时清除图表。 Set of Pairs — 符号集 — Market Watch — 来自“市场观察”的配对。 — Specified manually — 在参数“Pairs”中手动指定对。 — Current pair — 仅显示当前对。 Pairs (separated by a space or semic
Inside Bar Dashboard for MT5
Taras Slobodyanik
5 (1)
多货币和多时间范围指标 Inside Bar (IB)。 在参数中,您可以指定任何所需的货币和时间范围。 该面板显示最后找到的内部柱线(和母柱线)形态、当前价格位置以及母线和内部柱线水平的突破。 您可以设置单元格中的条形和文本的大小和颜色。 当水平被突破时,该指标还可以发送通知。 通过单击带有句点的单元格,将打开指定的交易品种和句点。 这是 MTF 扫描仪。 默认情况下,从图表中隐藏仪表板的键是“D”。 参数 How long pattern will be valid after first breakout (bars) — 信号将在单元格中显示多少柱。 IB body must be inside of the MB body - IB 主体必须位于 MB 主体内部。 IB body and wicks must be inside the MB body - IB 主体和灯芯必须位于 MB 主体内。 If MB is IB, choose the next MB — 如果找到的母柱是前一个信号的内柱,则将显示前一个信号。 MB body must be larg
筛选:
Marek Borys
152
Marek Borys 2024.05.27 18:19 
 

ok

Alexander Eduardo Camarena Hermoso
305
 

Excelente indicador, lo mejor que eh visto, mil gracias

clausejmbm123
351
clausejmbm123 2020.11.23 22:02 
 

I am really pleased with this dashboard. It took my trading to the next level. The support is great. I requested a few changes on the system, which were realized on the same day. I am looking forward to buying the same dashboard for MT4. Thank you very much for this amazing tool. I really appreciate it.

回复评论
版本 4.70 2024.03.14
1) Changed the behavior of setting the timer at startup. Now the indicator tries to start the timer again when a new tick arrives. If there is no tick for a long time (or it’s a weekend), you can click on the button on the chart and restart the timer yourself.
版本 4.60 2023.11.30
1) Added alert "Previous and Current waves have the same number of bars".
2) Added the "Code Page for Characters" parameter. If your system uses a different encoding (for example, Chinese or Japanese), then you may need to change this setting in order to see the characters correctly in the dashboard.
版本 4.50 2023.11.11
1) Added automatic shifting of the dashboard to the foreground.
版本 4.40 2023.10.05
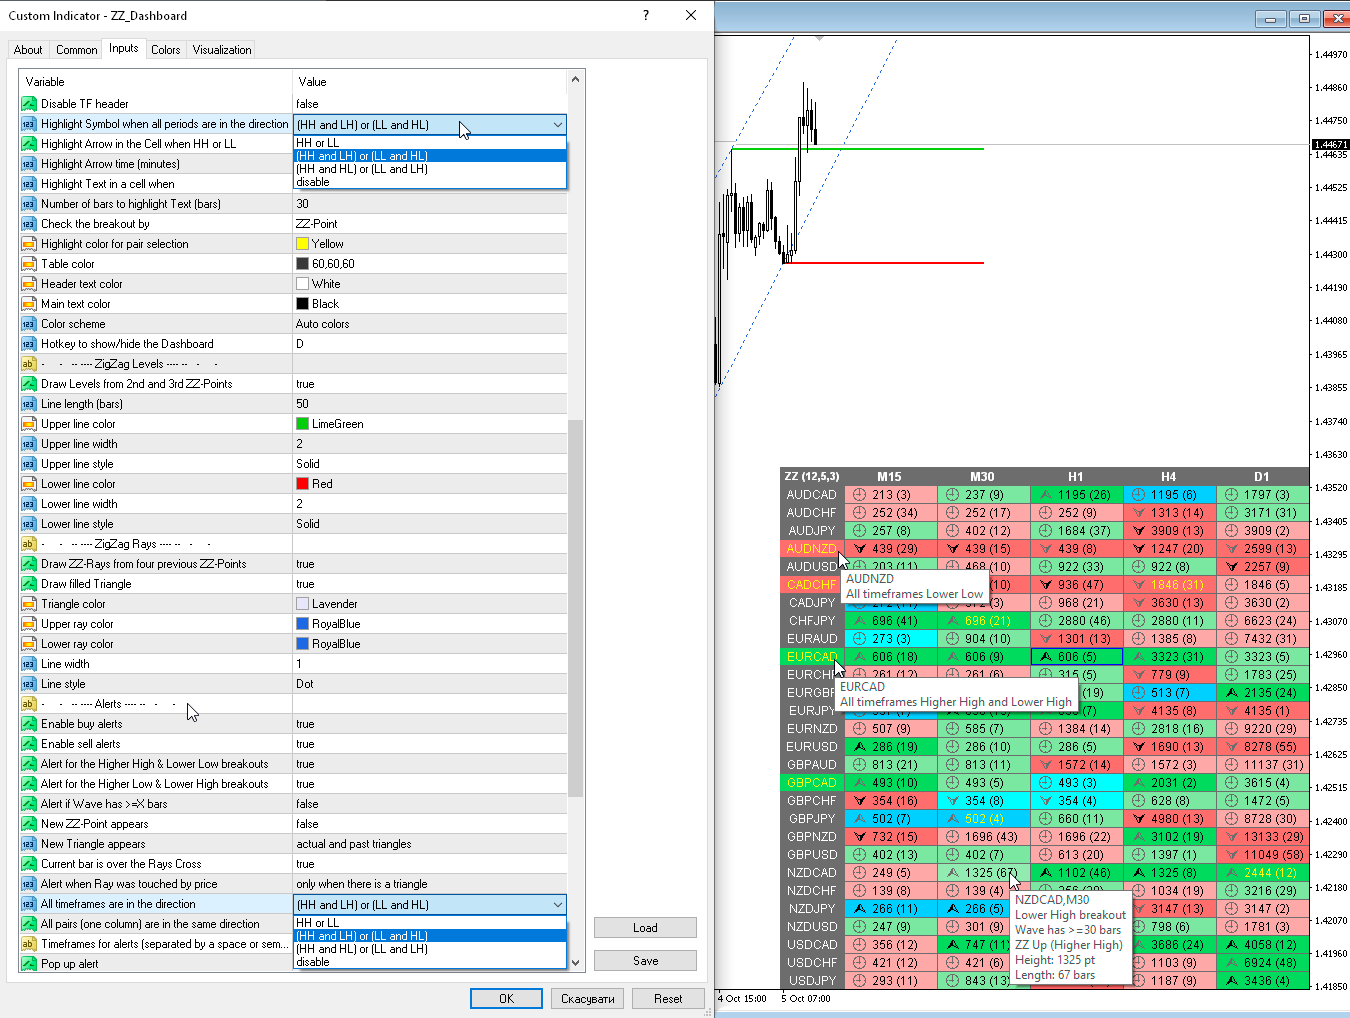
1) Added cell fill colors for Higher High (HH), Lower High (LH), Higher Low (HL), Lower Low (LL).
2) Added highlighting parameters for a Symbol (Pair) if all timeframes contain the specified combination HH-LH-HL-LL.
3) Added alert parameters for a Symbol (Pair) if all timeframes contain the specified combination HH-LH-HL-LL.
4) Tooltips have been changed.
版本 4.30 2023.09.03
1) Added "Hotkey to enable/disable the Popup chart" parameter for "Popup chart".
2) Added "Y-offset (pix)" parameter for "Popup chart".
3) Added a Dashboard recovery check when running multiple copies on the same chart.
版本 4.20 2023.08.25
1) Returned the deletion of the dashboard from the chart at startup.
版本 4.10 2023.08.18
1) Optimization of pop-up windows for MT5.
版本 4.0 2023.07.26
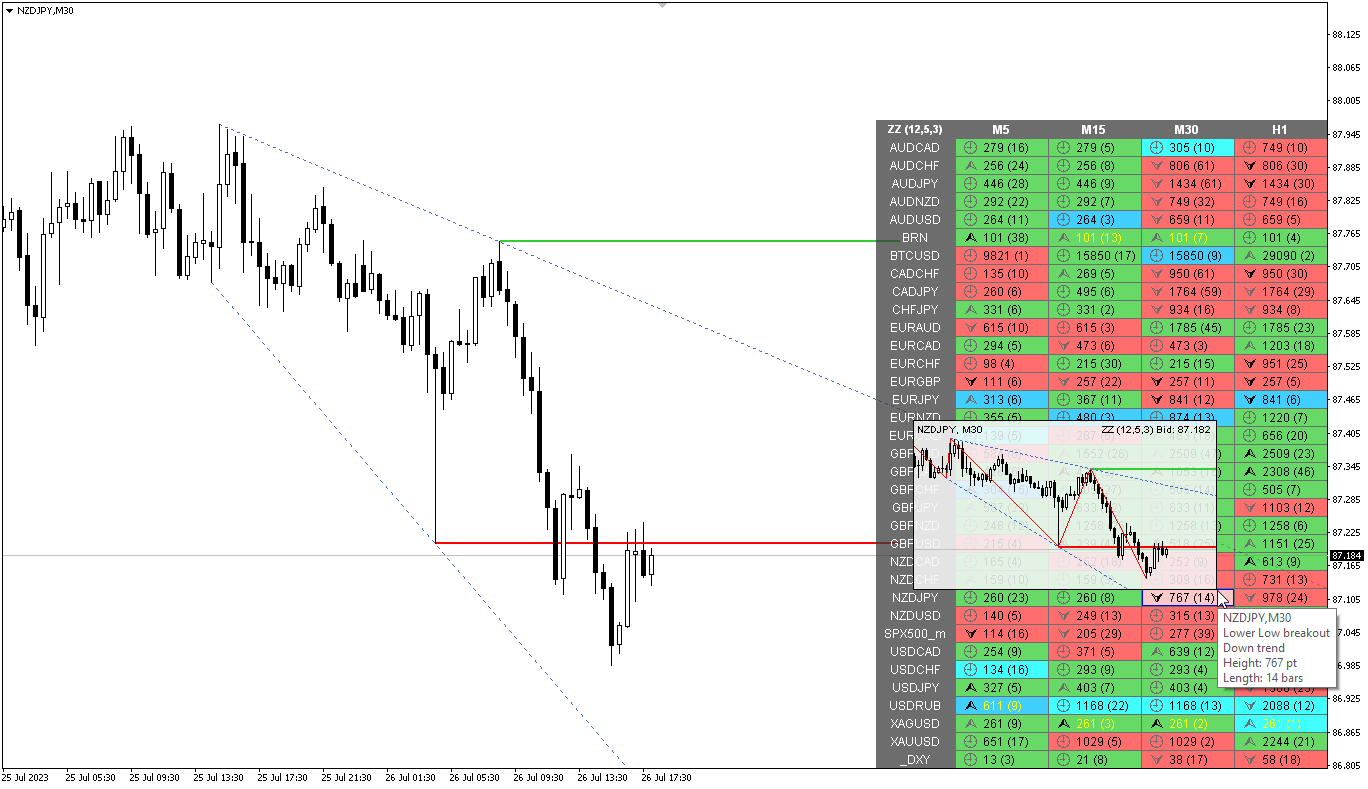
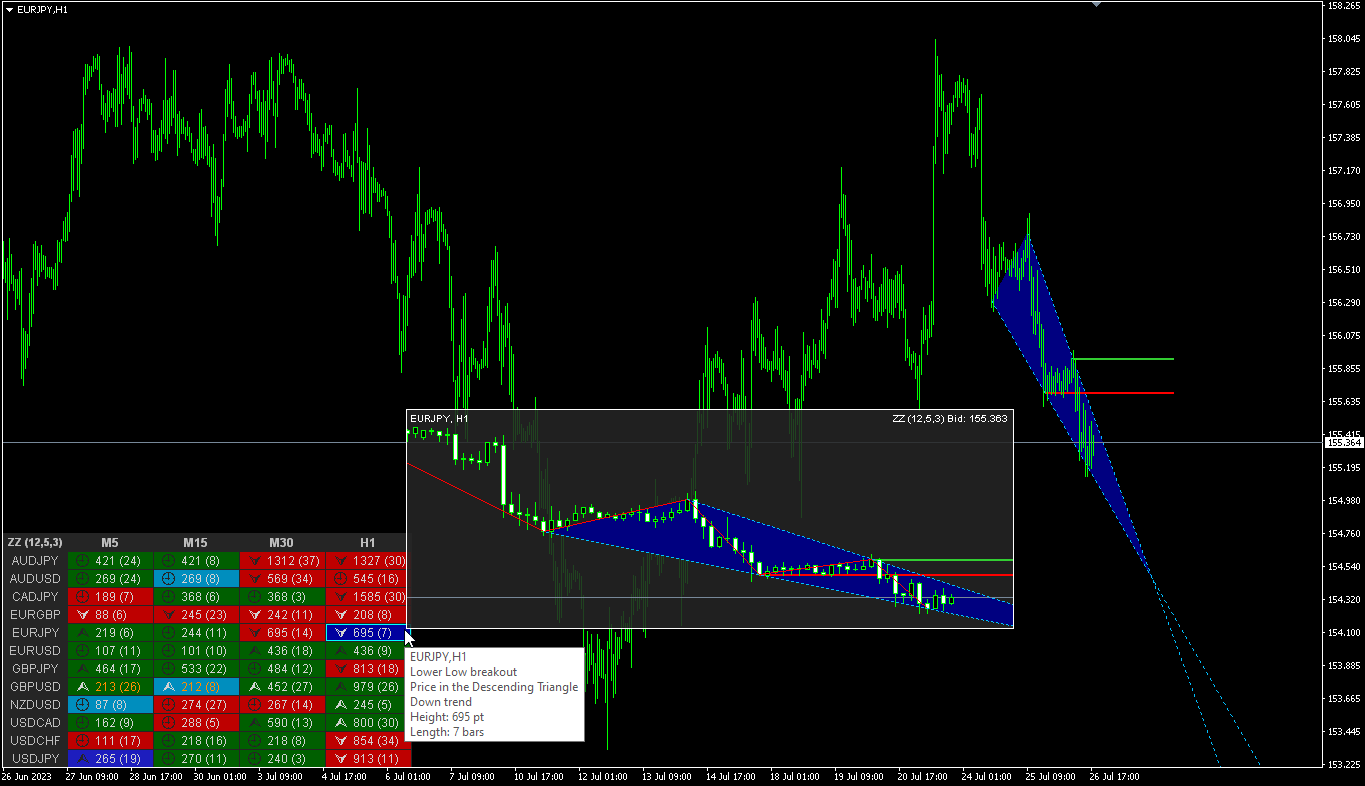
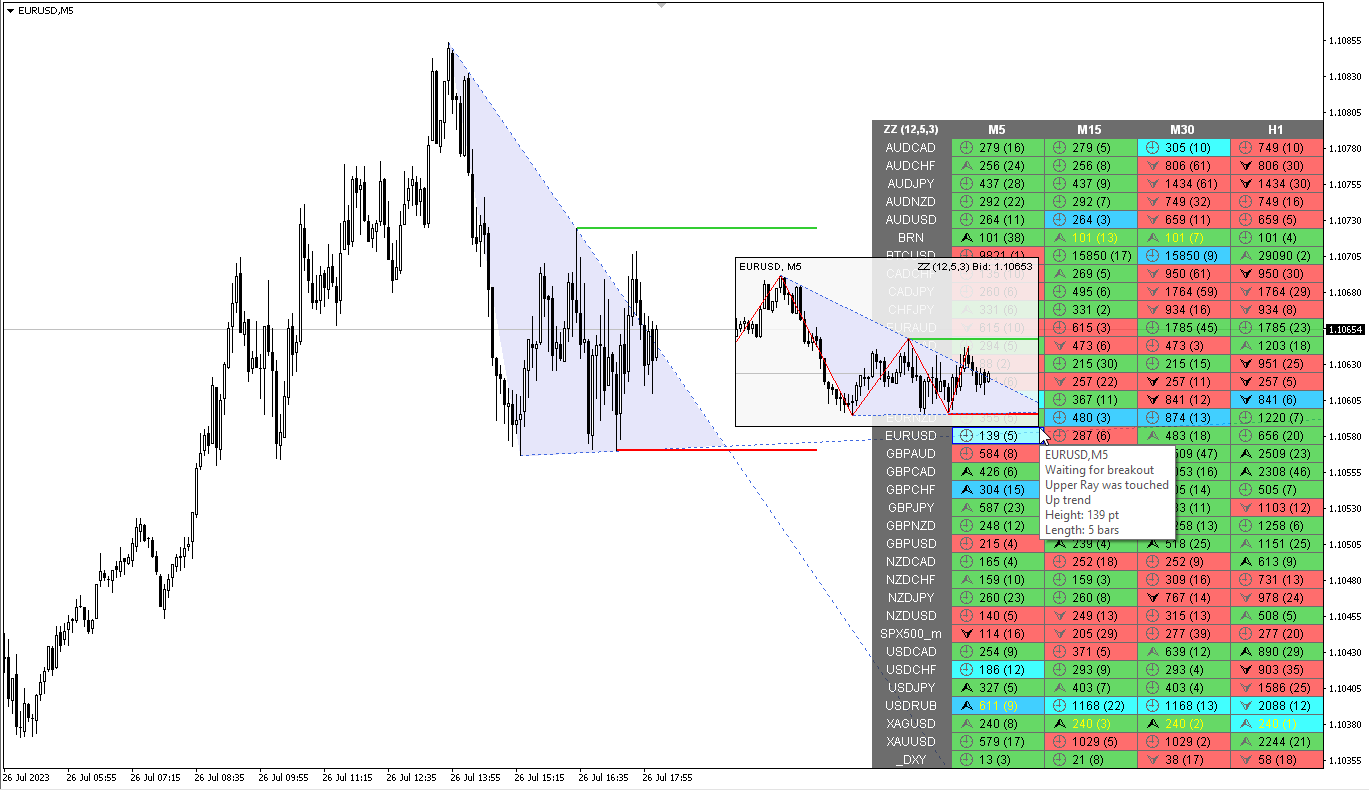
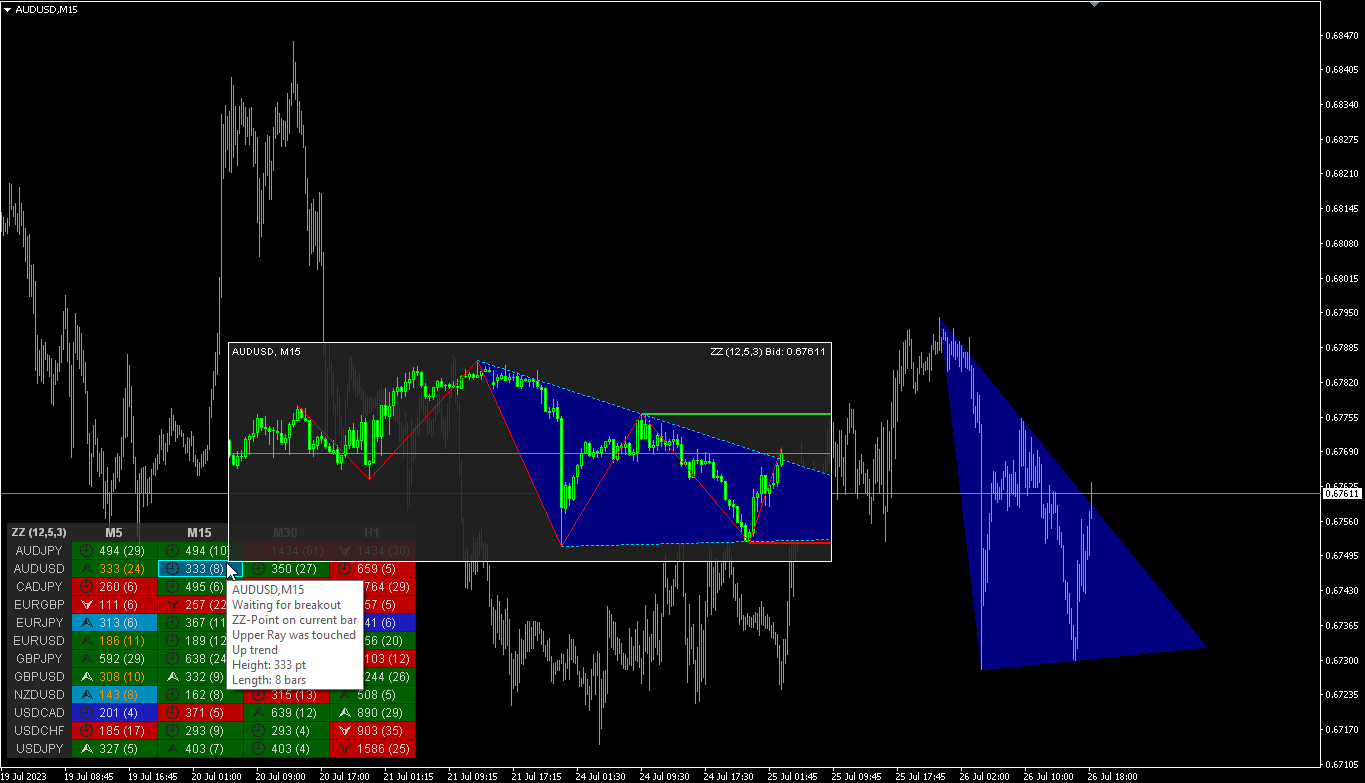
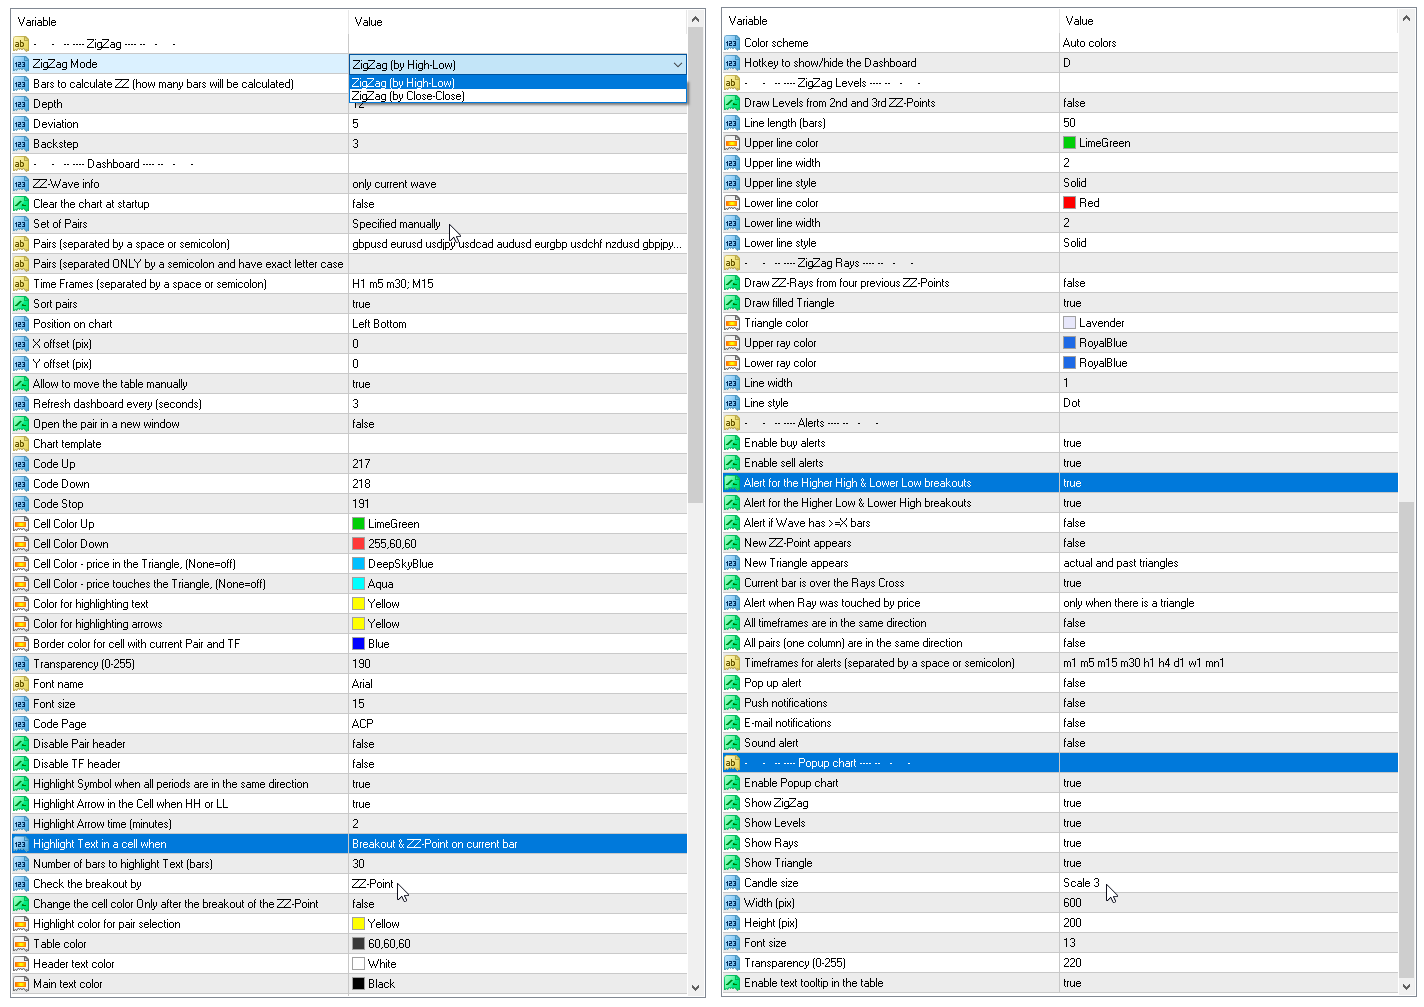
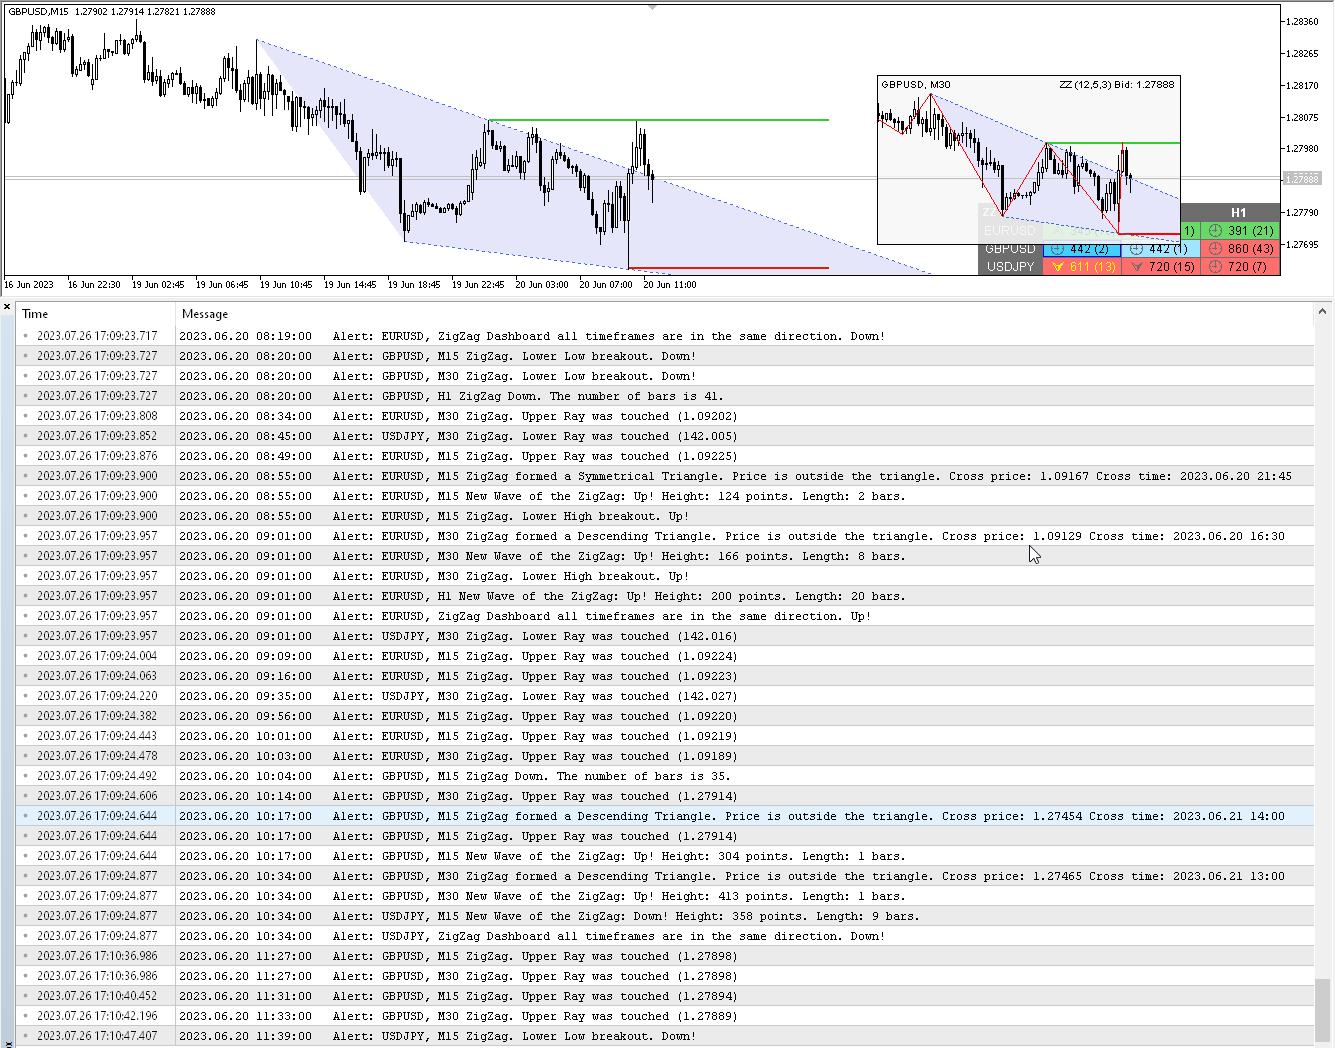
1) Various alerts have been added for the Triangle. Also cell fill colors when the price is in the Triangle.
2) Added more tooltips, fixed some text descriptions.
3) Added "Color scheme" parameter.
4) Added a hotkey to hide the dashboard, by default "D".
5) Added "Popup chart" parameters. Now, when you hover the mouse over the cells, you can see a pop-up chart from this timeframe.
6) The condition of the list of pairs for the second parameter has been changed. Pairs in the second parameter must be typed only with a semicolon and must be in exact case. "Pairs (separated ONLY by a semicolon and have exact letter case)"
7) Code optimization and bug fixes.
版本 3.90 2023.06.11
1) Added the ability to enable/disable alerts for each Symbol when clicking on the name of the Pair. If no Pair is selected then alerts are enabled for all Symbols.
版本 3.80 2022.12.10
1) Changed description of some parameters and tooltips.
版本 3.70 2022.09.21
1) Added parameters for displaying rays at the last ZigZag points ("Draw ZZ-Rays").
2) Added alerts for Rays (Alert when Ray was touched by price).
3) Added a new mode of text highlighting in a cell (Highlight Text in a cell when Price touched ZZ-Ray).
4) Added different colors for highlighting text and arrows.
5) Renamed some parameters for better understanding.
6) Changed the selection of the cell with the current Symbol/TF.
7) Added more description to tooltips.
版本 3.60 2022.08.19
1) Added a parameter to highlight the arrow in the cell at "Higher High breakout" and "Lower Low breakout".
版本 3.50 2022.06.24
1) Added a description of the parameters of the ZZ in the upper cell.
版本 3.40 2022.04.09
1) Cell selection is disabled if there is one pair and one timeframe in the table.
版本 3.30 2022.03.18
1) Added parameter: 'Alert for the Higher High & Lower Low breakouts'.
2) Added parameter: 'Alert for the Higher Low & Lower High breakouts'.
3) Added tooltip for cells.
4) Changed the color of the arrows for different breakouts.
版本 3.20 2021.08.24
1) Fixed a bug when launching many indicators with the "Current pair" parameter.
版本 3.10 2021.08.06
1) Added parameter "Change the cell brightness of current TF & Symbol (from -50 to 50)".
版本 3.0 2021.04.16
1) Added parameter "Allow to move the table manually".
版本 2.80 2021.04.10
1) Added calculation modes: "ZigZag (High-Low)" and "ZigZag (Close)".
2) Now, after double-clicking on the table headers, you can move it with the mouse. The binding to the corner of the chart remained unchanged.
版本 2.70 2021.04.08
1) Added a parameter: Change the cell color only after the breakout of the ZZ-point.
版本 2.60 2021.03.19
1) Added options to disable the table headers.
版本 2.50 2021.02.27
1) Added parameter: "Draw lines from 2nd and 3rd points".
版本 2.40 2021.02.20
1) Added parameters: "Enable buy alerts" and "Enable sell alerts".
版本 2.30 2020.12.08
1) Added alert "All pairs (one column) are in the same direction".
版本 2.20 2020.11.21
1) Added parameter: "Symbol highlight time (minutes, 0-all the time)".
版本 2.10 2020.11.19
1) Added parameter: "Highlight symbol when all periods are in the same direction".
版本 2.0 2020.11.18
1) Added alert when all timeframes show in the same direction.
版本 1.80 2020.11.15
1) For the parameter "Set of Pairs" added the option "Current pair".
2) Added cell highlighting modes.
版本 1.70 2020.06.08
1) Recompilation for the new MT5 build.
版本 1.60 2020.03.06
1) Added cell highlighting if the number of bars in the wave >= X bars.
2) Added alert if the number of bars in the wave >= X bars.
版本 1.50 2019.10.27
1) Added periods for alerts - "Timeframes for alerts".
2) Added parameter for clearing the chart at startup - "Clear the chart at startup".
3) Added center alignment of the panel - "Centered".
4) Added offsets for the panel - "X offset (pix)" and "Y offset (pix)".
5) Reverse the order of pairs of "Market Watch" without sorting.
版本 1.40 2019.05.01
1) Added parameter: "Bars to calculate ZZ".
2) Fixed incorrect display for high Depth.
版本 1.30 2019.02.19
1) Added modes for alerts.
2) Added the option to display information about the previous wave.
版本 1.20 2018.11.04
1) Added arrows showing the breaking through of the previous point and the corresponding alerts.
2) The number of bars is displayed in accordance with the cross on the MT toolbar.
版本 1.10 2018.11.04
1) Added the number of bars in the ZigZag.