Ultimate Price Action ultimate version
- 指标
- Indra Lukmana
- 版本: 1.0
- 激活: 10
Extended VERSION
Benefit You Get
How To Trade
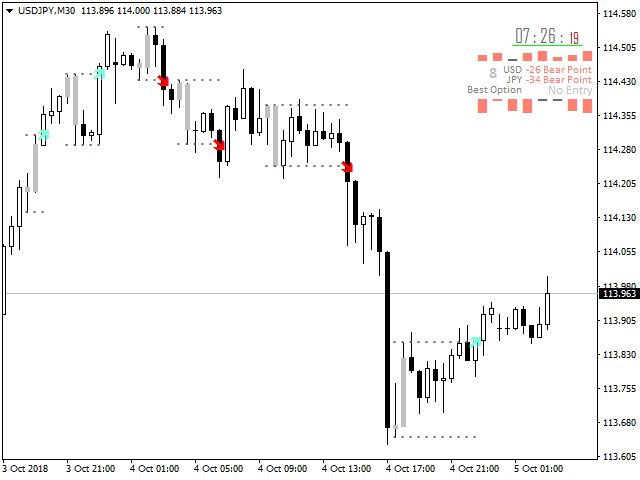
Ultimate solution on price action trade system Built Inside One Tool!
Our smart algorithm tool will detect the price action pattern and alert upon potential with entry signals and exit levels including stoploss and takeprofit levels based on dynamic and unique calculation.
This tool will also filters out market currency strength to ensure our entry are in a good currency conditions based on it's trend.
Benefit You Get
- Easy, visual and effective price action detection.
- Gives you the ability to filter and further improve your trading skills.
- Enhanced statistics calculation following the entry point, take profit and exit signal.
- Never repaints, never recalculates.
- Signals strictly on the "Close of the bar".
- Works in all symbols and all timeframes and all currency markets.
- Integrated pop-up, push notification and sound alerts.
- Auto currency suffix detection.
How To Trade
No complicated rules, Just follow 3 simple steps!
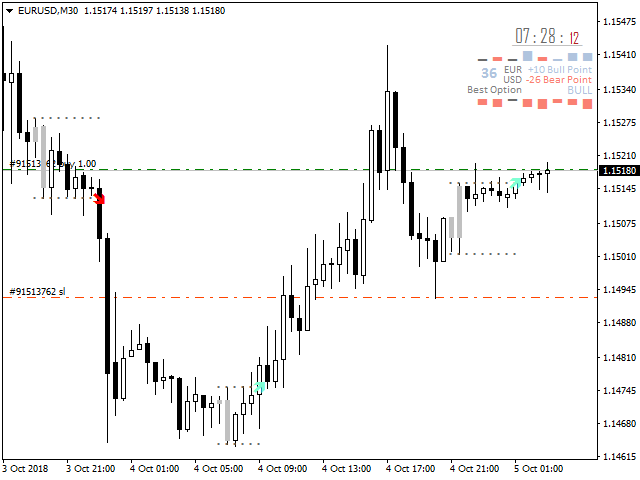
Step 1: Trade Setup
- Wait for the signal
- Enter a signal if the CSM (currency strength meter) differences point value is higher than 15 points in one currency to another currency, and it mentions bull/bear on the CSM.
- Set the pending limit order on the Entry level 1,2,3 or directly entry upon signal.
- Set the stoploss based on fibo level of stoploss
- Set the Take profit on TP1, TP2, TP3.
Cancellation of Pending limit order
- When the price hit the TP2 level you should cut off the pending orders
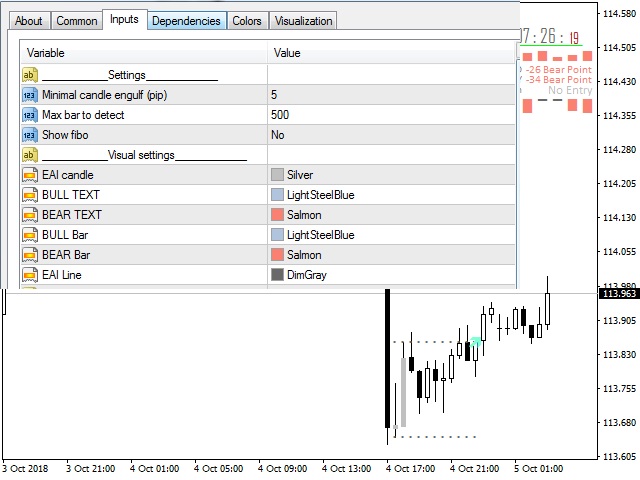
Parameters
- Minimal engulf in Pip - The minimum price action candle of engulf in pip.
- Max Bar to detect - maximum drawing to the left.
- EAI candle - color of price action candle.
- Bull Text - csm text for bull condition color.
- Bear Text - csm bear text color.
- Bull bar - csm bull bar condition color
- Bear bar - csm bear bar condition color.
- EAI Line - Price action dot line color.