Ichimoku Cloud at a Glance Multi
- 实用工具
- Robofx Technologies LLC
- 版本: 1.1
- 更新: 7 十月 2018
- 激活: 10
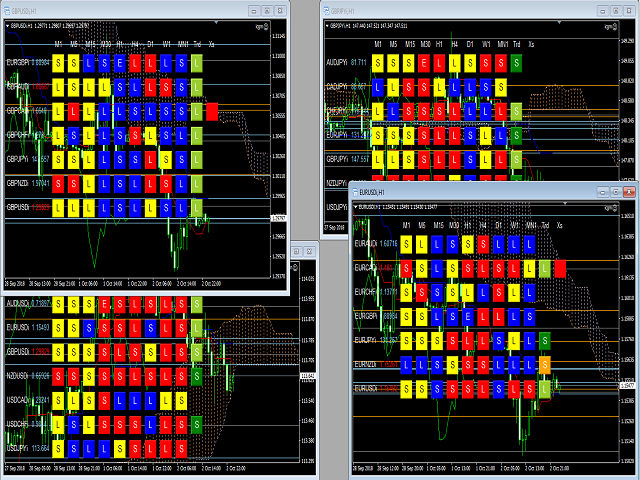
Ichimoku Cloud at a Glance Multi is the intuitive, powerful tool for analyzing the trend, support, resistance, pivots and the currency strength utilizing Ichimoku info from the multiple timeframe of the multiple cross currencies. It let you watch 7 cross currencies' stats in one screen. It also shows the base currency relative strength intuitively. Those 7 currencies' Ichimoku stats are shown in colors and several lines. It also alerts possible entry point and offers one click order entries. ICGM supports AUD, CAD, CHF, EUR, GBP, NZD,JPY and USD cross currencies monitoring. One window for 1 set of cross pairs. Opening 7 windows let you monitor all 7 crosses. Since the UI represents each timeframe Ichimoku status and each pivot in one screen, it makes it easy to analyze what the current price move means to a bigger timeframe and thus, to the current trend that helps you to create a strategy going forward.
ICGM looks at the currency relative strength by its price vs Ichimoku elements,Tenkansen, Kijunsen, SenkouspanA and B. The information will be shown in colors and letters by timeframes by currencies on the chart. In addition to those "multi currency version of At a glance", it gives an alert when a trend was established and further, possible entry points with a UI box and if it was chosen, sound and a dialog box. Clicking on the alert box will place an order in one click. Trend establishment was determined by number of pairs showing the same Ichimoku patterns across the cross pairs. Possible entry point was determined by Tenkansen and Kijunsen crossing in a shorter timeframe
UI:
Currency line: will show M1-MN1 Ichimoku at a glance information for each currency. It will help understanding which direction the base currency is heading intuitively.
M1-MN1 column: Color represents relative position to the cloud. Letter represents Senkouspan A and B relations.
Here's a bit confusing part. The Long and Short notion is relative to the core currency. For example, between EURUSD and USDJPY, USD long direction is opposite because when USD is strong, the chart goes down in EURUSD and goes up in USDJPY. In order to scale the core currency strength, we treat both short even it goes up in USDJPY chart. So in the USD selection, "S" indication on any pair start with USD like USDJPY, is actually long for the pair. Again it is a bit confusing first, but It makes easier to read the "currency strength" in our "At a Glance"
Having said above, Blue is the price above the cloud, Red is below cloud for the pairs ends with "USD" for above example. L represents SenkouspanA > B and S is A<B and E is A=B for the pairs end with "USD". Opposite for the pairs that start with "USD". Again, it sounds a bit confusing but will be easier when see it on the UI
Blue: Price is above Senkouspan A and B (above the cloud)
Yellow : Price is between Senkouspan A and B (in the cloud)
Red: Price is below Senkouspan A and B (below the cloud)
'L': SenkouspanA > B
'E': SenkouspanA = B
'S': SenkouspanA < B.
Note: again, above/below notion will be reversed for the pairs starts with the base currencies
Trd Column: Trend indicators. It will be shown only when the trend was detected and only for the currencies on the trend.
Green: Price is above Tenkansen and Kijunsen above SenkouspanA/B (Trending)
Orange: Price is below Tenkansen and Kijunsen and above SenkouspanA/B (in pull back)
YellowGreen. Price is between Tenkansend and Kijunsen.
L=Tenkansen is above Kijunsen,
S=Tenkansen is below Kijunsen
E=Tenkansen=Kijunsen
Note: again, above/below notion will be reversed for the pairs starts with the base currencies
Xs:
Only appears when the cross conditions met for possible entry points. Red=Short cross. Blue=Long cross. Will despair when it goes on to the next bar.
Note: Long/Short notion for here is for absolute. Long is buy, short is sell to make sure no confusions for order operations.
Horizontal Lines:
Charts will have number of horizontal lines that indicates Tenkansen, Kijunsen, SenkouspanA/B for H1 to MN1 timeframe in once place in addition to the Daily Pivot.
It helps to see where resistances and supports are easily. You may utilize one for tp and sl for your trades.
Input Parameters
Please refer the following link to my news feed for the input parameters. https://www.mql5.com/en/users/hideyau/news
