Cunning crocodile
- 指标
- Aleksey Ivanov
- 版本: 3.10
- 更新: 3 五月 2021
- 激活: 5
Structure of the indicator.
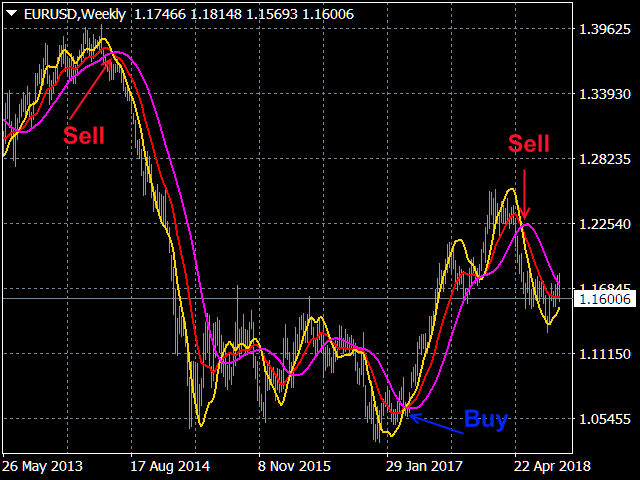
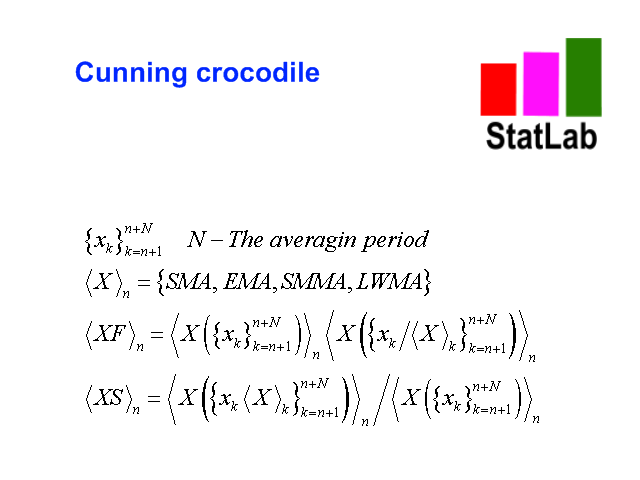
The Cunning crocodile indicator consists of three moving averages (applied to the price Median price = (high + low)/2): 1) the usual MA (SMA , EMA, SMMA, LWMA) or the mean <X> of the process X and her two generalizations 2) <XF> = <X / <X >> * <X> and 3) <XS> = <X * <X >> / <X> with the same averaging period. All three curves intersect at common points that (such an intersection in which the cunning crocodile, unlike the usual one, "never bites his tongue") indicates a change in the trend in the price movement. Formulas for these generalized averages, one of which <XF> is faster, and the other <XS> is slower than the usual MA, are presented in the last screenshot.
Using the Cunning crocodile indicator and its advantages.
The trade of the Cunning crocodile indicator is similar to that of the trade of the usual Alligator indicator, but it has the following advantages. First, averaging over the algorithm <XF> is less delay than behind the fast SMMA used in the classical Alligator. Secondly, the small slope of the slow <XS> is also faster achieved than the small slope of the slow SMMA of the normal Alligator. Therefore, the indicator Cunning crocodile more quickly indicates the transition to both trend and flat market conditions than the classic Alligator.
The indicator has all kinds of alerts.
Trade with the Cunning crocodile indicator.
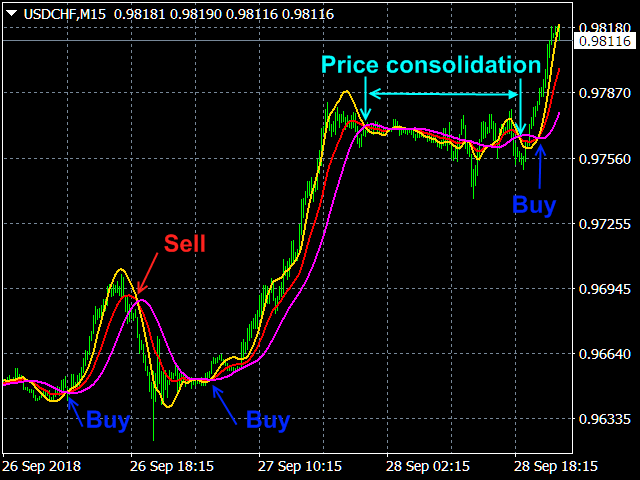
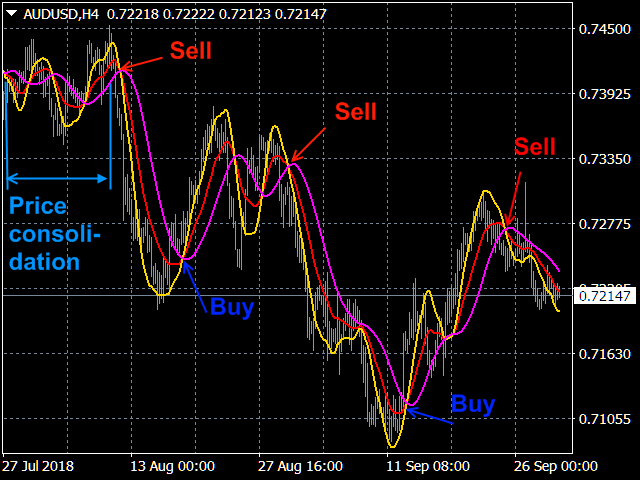
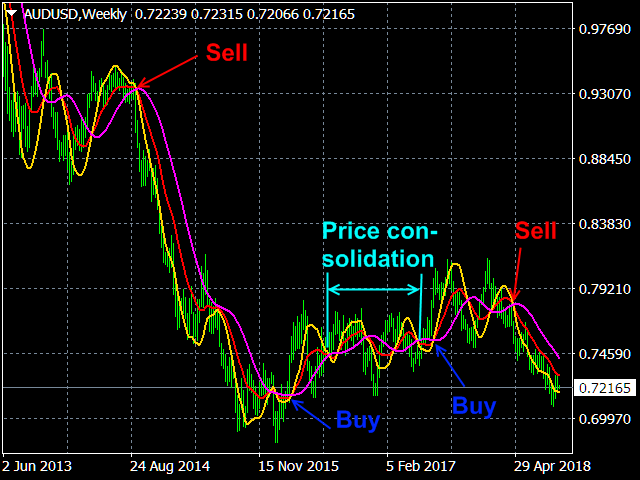
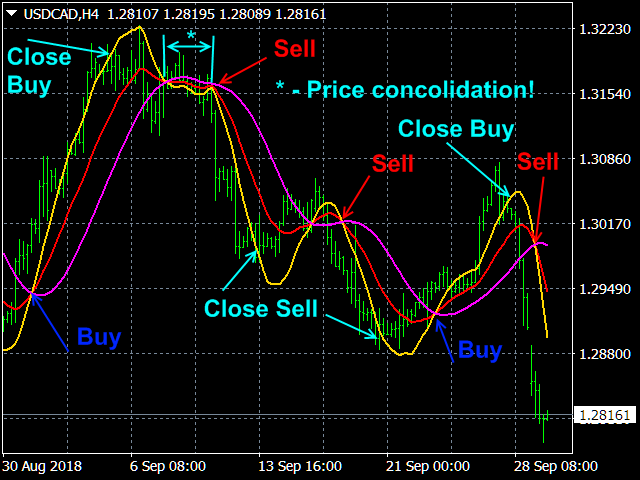
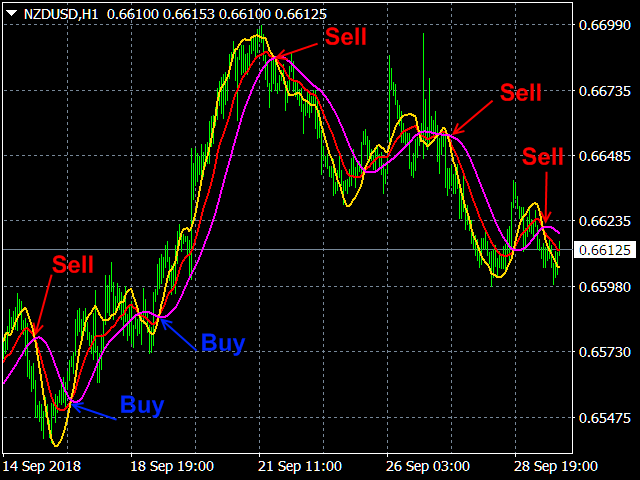
If after reaching a single point of intersection of all three curves "the mouth of the crocodile" is widely opened and the slow average <XS> acquires a significant slope, then there is a trend. In this case, the position on Buy (Sell) opens when the price is higher (lower) than the fast average <XF> and closes when it is below (above) <XF> (those. in the "mouth" Cunning crocodile).
If the slow mean <XS> is practically horizontal and (that occupies a significant section of the history) all three lines intersect repeatedly (3 to 6 times) at single points, then the price consolidation takes place. At the same time, the length of the subsequent trend is usually proportional to the length of the previous consolidation area, in which the market spends most of the time (70% -80%), which provides additional information for assessing the state of the market, i.e. it allows to judge whether the trend reversal starts or the trend ends. A rough estimate is as follows: if the trend lasted for 25% -40% of the time of the previous consolidation, then, most likely, there will be a trend end; if the trend lasted less than 20% of the time of the previous consolidation, then a rollback.
Indicator parameters.
- Price type - Values: Close price, Open price, High price, Low price, Median price ((high + low)/2 – default), Typical price ((high + low + close)/3), Weighted price ((high + low + 2*close)/4).
- The averaging method Values : SMA ( default ), EMA, SMMA , LWMA .
- The averaging period - Values: Integer. Default is 5.
- The Signal method - Type of trading signal alert. Values: No, Send alert, Print (in expert), Comment (in chart), Sound + Print, Sound + Comment, Sound, Push + Comment, Push, Mail + Comment, Mail.


