XOatrline
- 指标
- Ainur Sharipov
- 版本: 1.5
- 更新: 28 七月 2020
- 激活: 5
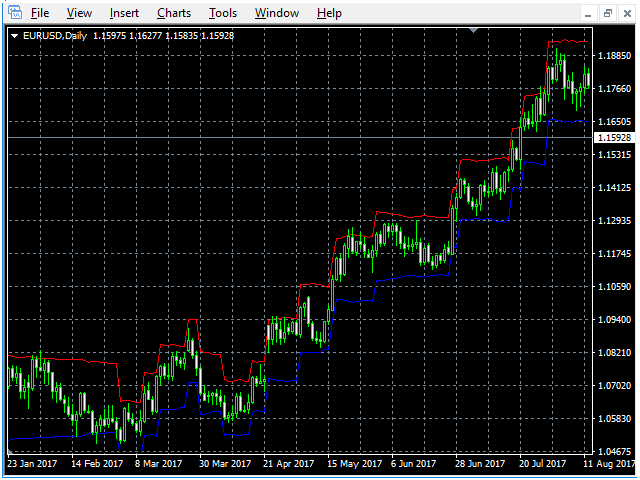
该指示器基于renko,但其周期等于ATR指示器的周期。
XOATRHIST版本指示器,在图表上显示波段。更加信息化。
关闭波段以外的柱形,会形成x或者o , 这时候报警指示灯会提示
参数:
ATRPeriod - 用于计算ATR的步骤周期。§
XOalert - 输出到终端信号。§
XOnotification - 向移动终端发送信号。§
XOmail -向电子邮件发送信号。
注意:指示器以收盘价格运作,因此需要考虑形成的柱形。
----------------------------------------------------------------------
----------------------------------------------------------------------

Хорошая работа, уровни пробоя адаптируются под рынок. Автору спасибо!