• 概述
  • 评论
  • 评论

Grade Day

Grade Day


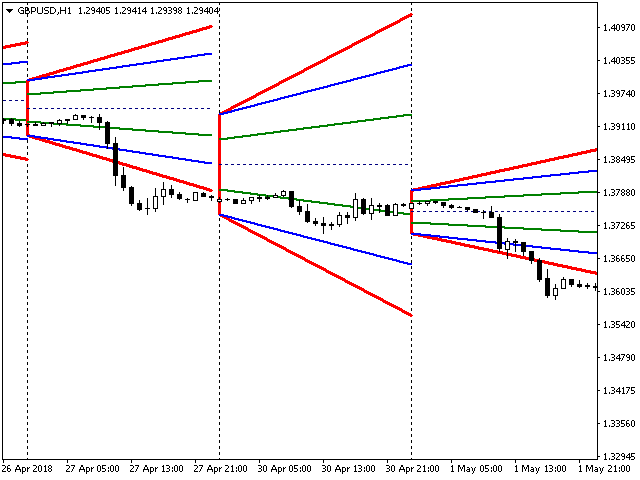
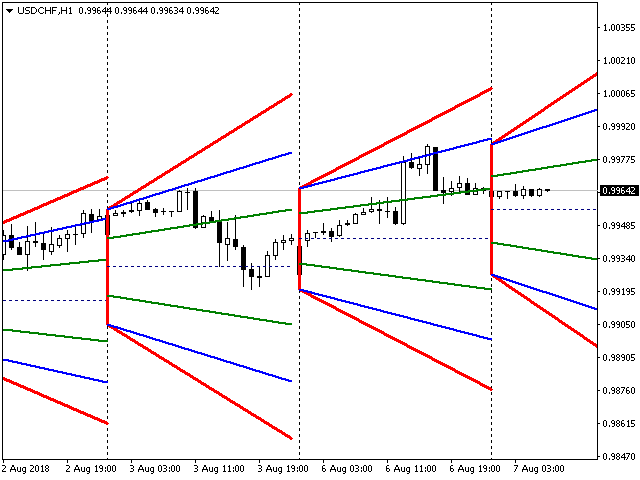
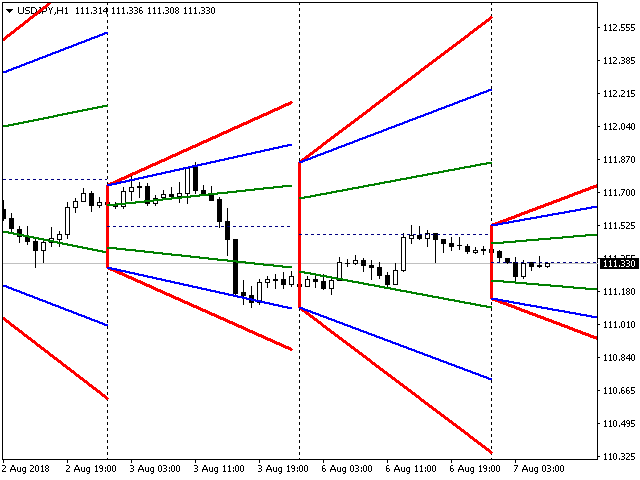
支撑和阻力趋势线的指标,计算一天。该指标不会在超过 4 小时的图表周期上显示其读数。

设置说明

  • color_1 - 第三条支撑线的颜色
  • width_1 - 第三条支撑线的粗细
  • style_1 - 第三条支撑线的样式
  • color_4 - 第二条支撑线的颜色
  • width_4 - 第二条支撑线的粗细
  • style_4 - 第二条支撑线的样式
  • color_6 - 第一条支撑线的颜色
  • width_6 - 第一条支撑线的粗细
  • style_6 - 第一条支撑线的样式
  • color_3 - 中心线颜色
  • width_3 - 中心线粗细
  • style_3 - 中心线样式
  • color_7 - 第一条阻力线的颜色
  • width_7 - 第一条阻力线的厚度
  • style_7 - 第一阻力线的风格
  • color_5 - 第二条阻力线的颜色
  • width_5 - 第二条阻力线的厚度
  • style_5 - 第二阻力线的风格
  • color_2 - 第三条阻力线的颜色
  • width_2 - 第三阻力线的厚度
  • style_2 - - 第三阻力线的风格
  • BarLimit - 在一定数量的柱线上显示指标


推荐产品
Multi Timeframe ZigZag Indicator
Salman A A A T Bakhash
5 (2)
Description: This indicator draw ZigZag Line in multiple time frame also search for Harmonic patterns before completion of the pattern. Features: Five instances of ZigZag indicators can be configured to any desired timeframe and inputs. Draw Harmonic pattern before pattern completion. Display Fibonacci retracement ratios. Configurable Fibonacci retracement ratios. Draw AB=CD based on Fibonacci retracement you define. You can define margin of error allowed in Harmonic or Fibonacci calculatio
FREE
QuantumAlert RSI Navigator is a free indicator available for MT4/MT5 platforms, its work is to provide "alerts" when the market is inside "overbought and oversold" regions in the form of "buy or sell" signals. This indicator comes with many customization options mentioned in the parameter section below, user can customise these parameters as needful. Join our   MQL5 group , where we share important news and updates. You are also welcome to join our private channel as well, contact me for the pri
FREE
SATL Candles 2 AM
Andriy Matviyevs'kyy
This indicator displays candle prices on the chart, colored in accordance with the data of the SATL digital filter built on closing prices. The indicator has no configurable parameters. Allows you to effectively follow a long-term trend. Usage: After the full formation of a candle colored in the opposite color to the previous candle, place a stop order at the high / low of such a candle. When the price overcomes such a high/low, a position will be opened. With the full formation of a candle pain
FREE
Triple RSI
Pablo Leonardo Spata
2.5 (2)
LOOK AT THE FOLLOWING STRATEGY   WITH THIS INDICATOR.   Triple RSI   is a tool that uses the classic Relative Strength Indicator, but in several timeframes to find market reversals.    1.  ️ Idea behind the indicator and its strategy: In Trading, be it Forex or any other asset, the ideal is   to keep it simple, the simpler the better . The   triple RSI   strategy is one of the simple strategies that seek market returns. In our experience, where there is more money to always be won, i
FREE
TMoney TrendCycle
Moises Orlando Urbina Sojo
The indicator plots the trend from an EMA of "n" periods and the cycle from another EMA of "k" periods from the previous EMA. This allows the crosses to be much more effective and the amplitude of the cycle allows to verify the strength of the trend. This indicator should be used as a complementary tool to confirm market entry signals. It is possible to add three times the indicator applied to maximum price, minimum price and median price in TimeFrame of one hour for example, in order to identif
QuantumAlert Stoch Navigator is a free indicator available for MT4/MT5 platforms, its work is to provide "alerts" when the market is inside "overbought and oversold" regions in the form of "buy or sell" signals. This indicator comes with many customization options mentioned in the parameter section below, user can customise these parameters as needful. Join our   MQL5 group , where we share important news and updates. You are also welcome to join our private channel as well, contact me for the p
FREE
NIGHTCrusher Lite FREE
Christian Opperskalski
4.5 (2)
NIGHTCRUSHER is a fully automated expert advisor, designed for scalping on quite market situation. The Lite - Version is limited to minimal Lot per Pair and dont has lot mulitplier and dynamic function you can also run different strategies like swing trading or grid different Trade Entry Signals different Exit Strategies included (MA Cut / Signal Change / Trailing TP) clever Risk & Money management - Balance based - Longrun trades tracking You can also use a Grid function or Lot multipier, if n
FREE
MASi Three Screens
Aleksey Terentev
5 (3)
MASi Three Screens is based on the trading strategy by Dr. Alexander Elder. This indicator is a collection of algorithms. Algorithms are based on the analysis of charts of several timeframes. You can apply any of the provided algorithms. List of versions of algorithms:     ThreeScreens v1.0 - A simple implementation, with analysis of the MACD line;     ThreeScreens v1.1 - A simple implementation, with analysis of the MACD histogram;     ThreeScreens v1.2 - Combines the first two algorithms
FREE
Super Auto Fibonacci
Muhammed Emin Ugur
Discover the power of precision and efficiency in your trading with the " Super Auto Fibonacci " MT4 indicator. This cutting-edge tool is meticulously designed to enhance your technical analysis, providing you with invaluable insights to make informed trading decisions. Key Features: Automated Fibonacci Analysis: Say goodbye to the hassle of manual Fibonacci retracement and extension drawing. "Super Auto Fibonacci" instantly identifies and plots Fibonacci levels on your MT4 chart, saving you tim
FREE
Zig Zag reading structure
Maria Cristina Sabatini
'Zig Zag Percentage strenght'   This indicator is awesome. Why? It's able to show the percentage of the last leg, compared with the previous leg. In this way you have a better understanding of the forces in play in that moment.   In fact, for example, if you see that the up extensions are, in percentage, greater of the down legs, that means that there is more bullish pressure or maybe the market is starting to reverse from downtrend to uptrend.   Hope you will ind it useful !
TrendPlus
Sivakumar Subbaiya
4.21 (14)
Trend Plus   Trendplus  Indicator   Time Frame: Suitable for any time frame.  Purpose: Trend Prediction. Blue and red candle indicate the buy and sell call respectively. Buy: When the blue candle is formed buy call is initiated. close the buy trades when the next red candle will formed.   Sell: When the Red candle is formed Sell call is initiated. close the Sell trades when the next blue candle will formed.   Happy trade!!
FREE
MT4 的外汇指标“ATR 追踪止损” 使用 MT4 强大的辅助 ATR 追踪止损指标升级您的交易方法。 该指标非常适合追踪止损目的 ATR 追踪止损自动适应市场波动 无延迟且易于设置 该指标非常适合与进入主要趋势方向的价格行为结合起来 ............................................................................................................. // 这里提供更多优秀的 EA 交易和指标: https://www.mql5.com/en/users/def1380/seller // 也欢迎您加入盈利、稳定、可靠的信号 https://www.mql5.com/en/signals/1887493 它是仅在该 MQL5 网站上提供的原创产品。
Are you tired of drawing trendlines every time you're analyzing charts? Or perhaps you would like more consistency in your technical analysis. Then this is for you. This indicator will draw trend lines automatically when dropped on a chart. How it works Works similar to standard deviation channel found on mt4 and mt5. It has 2 parameters: 1. Starting Bar 2. Number of bars for calculation The   starting bar   is the bar which drawing of the trend lines will begin, while the   number of bars for c
FREE
Universal Box
Sergey Ermolov
5 (2)
MT5版本   |  FAQ  |   EA Universal Breakout   Universal Box 在圖表上繪製價格範圍,稍後可用於在價格範圍突破時進行交易。 您可以使用多種策略來應用此指標。 該指標默認設置為在圖表上標記 亞洲、歐洲和美國交易時段 範圍。 範圍繪製為矩形,其邊界是交易時段的開始和結束時間,以及該時段的最高價和最低價水平。 Telegram 聊天: @it_trader_chat 新的 Expert Advisor Prop Master   - 在您的交易终端中进行测试 https://www.mql5.com/zh/market/product/115375 指標設置非常簡單。 Time Open - 交易時段開始的時間 Time Close - 交易時段結束的時間 Box color - 矩形的顏色 可以在指標中設置 4 個價格範圍。 您可以使用 On Box 參數啟用或禁用每個價格範圍的顯示。 如何在EA設置中正確設置GMT參數? 此參數定義終端時間與 GMT 時間之間的差異。 要確定終端的時間,請在您的終端中打開“數據窗口”,您將在該窗
FREE
Free automatic fibonacci
Tonny Obare
4.65 (62)
Free automatic Fibonacci is an indicator that automatically plots a Fibonacci retracement based on the number of bars you select on the BarsToScan setting in the indicator. The Fibonacci is automatically updated in real time as new highest and lowest values appears amongst the selected bars. You can select which level values to be displayed in the indicator settings. You can also select the color of the levels thus enabling the trader to be able to attach the indicator several times with differe
FREE
Email Drawdown Alert
Roman Starostin
5 (15)
Free informative Indicator-helper. It'll be usefull for traders who trade many symbols or using grid systems (Averaging or Martingale). Indicator counts drawdown as percent and currency separate. It has a number of settings: Count deposite drawdown according equity value and send e-mail or notifications to user if DD more than set; Sending e-mail when max open orders reached; Shows price and remaining pips amount before MarginCall on current chart and Account generally; Display summary trade lot
FREE
Follow The Line
Oliver Gideon Amofa Appiah
4.07 (14)
FOLLOW THE LINE GET THE FULL VERSION HERE: https://www.mql5.com/en/market/product/36024 This indicator obeys the popular maxim that: "THE TREND IS YOUR FRIEND" It paints a GREEN line for BUY and also paints a RED line for SELL.  It gives alarms and alerts of all kinds. IT DOES NOT REPAINT and can be used for all currency pairs and timeframes. Yes, as easy and simple as that. Even a newbie can use it to make great and reliable trades. NB: For best results, get my other premium indicators for more
FREE
Rainbow MT4
Jamal El Alama
Rainbow MT4 is a technical indicator based on Moving average with period 34 and very easy to use. When price crosses above MA and MA changes color to green, it’s a signal to buy. When price crosses below MA and MA changes color to red, it’s a signal to sell. The Expert advisor ( Rainbow EA MT4) based on Rainbow MT4 indicator, as you can see in the short video below is now available here .
FREE
VWap Bands EForex
Veridiana Adorno Kendrick
VWAP Bands Metatrader 4 Forex Indicator The VWAP Bands Metatrader 4 Forex indicator is a quite similar to the Bollinger bands, but it deploys volume weighted average as the core value of the bands. There is an option of using the tick volume or real volume for calculation when using the VWAP Bands Metatrader 5 custom forex indicator, especially when the forex broker displays symbol alongside real volume. Similarly, you can decide to have deviations calculated with the sample correction or not
Vanexio
Sayan Vandenhout
VANEXIO USES THE TREND WAVE INDICATOR AND IT CAN IDENTIFY THE BEGINNING AND THE END OF A NEW WAVE TREND MOVEMENT. AS AN OSCILLATOR, THE INDICATOR IDENTIFIES THE OVERBOUGHT AND OVERSOLD ZONES. IT WORKS GREAT TO CATCH THE SHORT TERM PRICE REVERSALS AND USES A MARTINGALE STRATEGY TO CLOSE ALL TRADES IN PROFIT. USE DEFAULT SETTINGS ON H1 OR HIGHER TIME FRAME ON ANY PAIR FOR MORE ACCURATE TRADES WHY THIS EA : Smart entries calculated by 5 great strategies The EA can be run on even a $20000
FREE
CyberZingFx Trend Reversal Lite
Afsal Meerankutty
4.61 (28)
CyberZingFx Trend Reversal Indicator - your go-to solution for accurate and reliable trend reversal signals. With its unique trading strategy, the indicator offers you Buy and Sell Arrow signals that do not repaint, making it a reliable tool for catching Swing Highs and Swing Lows. SCROLL DOWN TO VIEW SCREENSHOTS AND WATCH VIDEO ________________________________________________________________ Trading using CyberZingFx Trend Reversal is Simple Using the CyberZingFx Trend Reversal Indicator is e
FREE
RSI Dashboard Panel
Niravkumar Maganbhai Patel
5 (11)
This indicator helps you to scan symbols which are in the Market Watch window and filter out a trend according to RSI. The relative strength index (RSI) is a technical indicator used in the analysis of financial markets. It is intended to chart the current and historical strength or weakness of a stock or market based on the closing prices of a recent trading period. The indicator should not be confused with relative strength. The RSI is classified as a momentum oscillator, measuring the veloc
FREE
Extremum Reverse Bar
Yurij Izyumov
3.55 (11)
This indicator has been created for finding the probable reversal points of the symbol price. A small candlestick reversal pattern is used it its operation in conjunction with a filter of extremums. The indicator is not redrawn! If the extremum filter is disabled, the indicator shows all points that have a pattern. If the extremum filter is enabled, the condition works – if the history Previous bars 1 candles back contains higher candles and they are farther than the Previous bars 2 candle, such
FREE
T3 Heiken Ashi AM
Andriy Matviyevs'kyy
Implementation of the classic Heiken Ashi indicator using the T3 smoothing method. The indicator allows you to select the smoothing depth and the smoothing shift relative to the current price. The indicator also allows you to select the price at which the data will be smoothed, as well as the control price with which comparison is made. The proposed approach allows you to visualize the trend and simplify trading decisions.
FREE
PZ Penta O MT4
PZ TRADING SLU
2.25 (4)
The Penta-O is a 6-point retracement harmonacci pattern which usually precedes big market movements. Penta-O patterns can expand and repaint quite a bit. To make things easier this indicator implements a twist: it waits for a donchian breakout in the right direction before signaling the trade. The end result is an otherwise repainting indicator with a very reliable trading signal. The donchian breakout period is entered as an input. [ Installation Guide | Update Guide | Troubleshooting | FAQ | A
FREE
Trend Catcher with Alert
Issam Kassas
4.85 (61)
趋势捕捉器: 具有警示指标的趋势捕捉器策略是一种多功能的技术分析工具,可帮助交易员识别市场趋势和潜在的进出点。它采用动态趋势捕捉器策略,根据市场条件进行调整,清晰地呈现趋势方向。交易员可以自定义参数,以符合其偏好和风险容忍度。该指标有助于识别趋势,发出潜在的反转信号,充当跟踪止损机制,并提供实时警报,以便及时应对市场。 具有警示指标的趋势捕捉器策略是一种多功能的技术分析工具,可帮助交易员识别市场趋势和潜在的进出点。它采用动态趋势捕捉器策略,根据市场条件进行调整,清晰地呈现趋势方向。交易员可以自定义参数,以符合其偏好和风险容忍度。该指标有助于识别趋势,发出潜在的反转信号,充当跟踪止损机制,并提供实时警报,以便及时应对市场。 特点: 趋势识别:信号牛市趋势和熊市趋势。 趋势反转:当蜡烛颜色从牛市变为熊市,反之亦然时,提醒可能的反转。 实时警报:为新趋势识别生成警报。 建议: 货币和货币对:EURUSD,AUDUSD,XAUUSD... 时间框架:H1。 账户类型:任何ECN,低点差账户。
FREE
这种用于从无穷远衡量货币强弱的创新指标是长期交易的黄牛和交易者不可或缺的助手。 分析货币强弱的系统早已被世界领先的交易者所熟知并在市场上使用。 没有这种分析,任何套利交易都是不完整的。 我们的指标很容易确定基础货币相对于彼此的强弱。 它显示所有或当前货币对的折线图,允许即时分析和搜索最强的入口点。 该指标直观,允许您快速找到并切换到任何一对,具有可放置在地下室和主图表上的移动面板。 通知货币强度变化的计时器模式使交易者有机会在手机上收到通知。  使用货币功率计无穷大指示器的几种策略: 1. 使用货币强度的线性显示图表搜索交叉点作为新兴趋势的信号 2. 在趋势反转信号出现后,向强势货币方向反弹 3. 使用货币强度发散分析扭转当前趋势 4. 使用其他无限指标向强势货币方向交易 
FREE
Zigzag Extremum points
Oleg Popov
4.81 (32)
New version 8.00 is available. In this version, I tried to take into account the wishes of the user. Each of you can also take part in the improvement of this advisor. In the default settings, the adviser opens trades when the extremum point is broken       standard indicator       Zigzag. When the upper point of the zigzag extremum is broken, it opens a buy deal, and when the lower point of the zigzag extremum is broken, it opens a sell deal. In addition to the standard ZigZag indicator, whi
FREE
Adjustable Fractal MT4
Dmitry Timin
4.63 (30)
Adjustable Fractal MT4 is a modification of Bill Williams' Fractals indicator. The fractal consists of a two sets of arrows - up (upper fractals) and down (lower fractals). Each fractal satisfies the following conditions: Upper fractal - maximum (high) of a signal bar exceeds or is equal to maximums of all bars from the range to the left and to the right; Lower fractal - minimum (low) of a signal bar is less or equal to minimums of all bars from the range to the left and to the right. Unlike a s
FREE
Tipu Heikin Ashi Panel
Kaleem Haider
4.56 (25)
Tipu Heikin-Ashi Panel is the modified version of the original Heiken Ashi indicator published by MetaQuotes here . A professional version of this indicator is available here . Features An easy to use Panel that shows the Heiken Ashi trend of selected timeframe. Customizable Buy/Sell alerts, push alerts, email alerts, or visual on-screen alerts. Customizable Panel. The panel can be moved to any place on the chart or minimized to allow more space. Heikin means "the average", and Ashi means "foo
FREE
该产品的买家也购买
TPSpro RFI Levels
Roman Podpora
4.85 (20)
Reversal First Impulse levels (RFI)    INSTRUCTIONS        RUS       -       ENG              R ecommended to use with an indicator   -   TREND PRO -  Version MT5 A key element in trading is zones or levels from which decisions to buy or sell a trading instrument are made. Despite attempts by major players to conceal their presence in the market, they inevitably leave traces. Our task was to learn how to identify these traces and interpret them correctly. Main functions: Displaying active zones
Atomic Analyst
Issam Kassas
5 (3)
首先值得强调的是,该交易指标是非重绘、非延迟的指标,这使其成为手动和机器人交易的理想选择。 用户手册:设置、输入和策略。 Atomic Analyst是一种PA价格行动指标,利用价格的力量和动量来寻找市场上更好的机会。配备了高级过滤器,可帮助去除噪音和假信号,并提高交易潜力。使用多层复杂的指标,Atomic Analyst扫描图表,并将复杂的数学计算转化为任何初学者都能理解并用来做出一致交易决策的简单信号和颜色。 “Atomic Analyst”是专为新手和经验丰富的交易者量身定制的综合交易解决方案。它将高级指标和一流功能融合为一体的交易策略,使其成为所有类型交易者的多功能选择。 日内交易和剥头皮策略:专为快速准确的日内交易和短期交易而设计。 日内和摆动交易策略:可用作追求价格大幅波动的日内和摆动交易者的可靠工具。 多货币和市场:凭借其可靠的精度,在不同的工具和市场上运作。 多个时间框架:可在多个时间框架上使用,性能良好。 稳定性:所有指标均不重绘、不重绘和不滞后,确保可靠的信号。 信号清晰度:提供箭头信号,用于清晰的入场和出场点。 实时警报:通过交易入场、SL和TP警报通知交
Advanced Currency Strength28 Indicator
Bernhard Schweigert
4.91 (665)
目前26%的折扣 任何新手或专家交易者的最佳解决方案! 这个指标是一个独特的、高质量的、可负担得起的交易工具,因为我们纳入了一些专有的功能和一个新的公式。只需一个图表,你就可以读出28个外汇对的货币强度!想象一下,你的交易将如何得到改善,因为你的交易是在你的手中进行的。想象一下,你的交易将如何改善,因为你能够准确地确定新趋势或剥头皮机会的触发点? 用户手册:点击这里  https://www.mql5.com/en/blogs/post/697384 这是第一本,原版的! 不要买一个毫无价值的崇拜者的克隆品。 特别的 子窗口中的箭头显示强劲的货币势头GAP将指导你的交易! 当基础货币或报价货币处于超卖/超买区域(外盘斐波那契水平)时,在个人图表的主窗口中出现警告信号。 当货币力量从外围区间回落时,回撤/反转警报。 十字星模式的特别警报 可选择多个时间框架,以快速查看趋势! 货币强度线在所有的时间框架中都非常平稳,当使用较高的时间框架来识别总体趋势,然后使用较短的时间框架来确定精确的入口时,效果非常好。你可以根据自己的意愿选择任何时间框架。每个时间框架都由其自身进
Scalper Inside PRO
Alexey Minkov
4.74 (58)
An exclusive indicator that utilizes an innovative algorithm to swiftly and accurately determine the market trend. The indicator automatically calculates opening, closing, and profit levels, providing detailed trading statistics. With these features, you can choose the most appropriate trading instrument for the current market conditions. Additionally, you can easily integrate your own arrow indicators into Scalper Inside Pro to quickly evaluate their statistics and profitability. Scalper Inside
TPSproTREND PrO
Roman Podpora
4.78 (18)
TPSpro TRENDPRO  - is a trend indicator that automatically analyzes the market and provides information about the trend and each of its changes, as well as giving signals for entering trades without redrawing! The indicator uses each candle, analyzing them separately. referring to different impulses - up or down impulse. Exact entry points into transactions for currencies, crypto, metals, stocks, indices!  -  Version MT5               DETAILED DESCRIPTION                R ecommended to use with
FX Power MT4 NG
Daniel Stein
5 (11)
通过 mql5 和 Telegram 上 的晨间简报获取每日市场更新,包括详细信息和屏幕截图 ! FX Power MT4 NG 是我们长期以来非常受欢迎的货币强度计算器 FX Power 的下一代产品。 这款下一代强度计算器能提供什么?您所喜爱的原版 FX Power 的所有功能 附加功能 黄金/XAU 强度分析 更精确的计算结果 可单独配置的分析周期 可自定义计算限制,以获得更好的性能 为希望查看更多信息的用户提供特殊的多实例设置 无尽的图形设置,可在每个图表中设置您最喜欢的颜色 无数的通知选项,让您再也不会错过任何重要信息 采用 Windows 11 和 macOS 风格的全新圆角设计 神奇的移动指标面板 FX Power 主要功能 所有主要货币的完整强势历史 所有时间框架内的货币强弱历史 所有经纪商和图表的计算结果完全相同 100% 可靠的实时计算 -> 无重绘 可通过下拉列表选择分析时段 通过自定义模式单独配置分析时段 可在一个图表中使用多个实例 可移动 FX Power 显示屏(通过拖放) 适用于高分辨率 QHD、UHD 和 4K 显示器 自动终端配置 针对平板电脑
目前八折优惠! 对任何新手或专家交易者来说都是最好的解决方案! 这个仪表板软件适用于28种货币对。它基于我们的两个主要指标(高级货币强度28和高级货币冲动)。它对整个外汇市场提供了一个伟大的概述。它显示高级货币强度值,货币运动速度和28个外汇对在所有(9)时间段的信号。想象一下,当你可以使用图表上的单一指标观察整个市场,以确定趋势和或剥头皮的机会时,你的交易将得到改善 我们已经在这个指标中建立了一些功能,使你更容易识别强势和弱势货币,同时识别和确认潜在的交易。该指标以图形方式显示货币的强势或弱势是增加还是减少,以及它在所有时间段的表现。 增加的新功能是动态市场斐波那契水平,它适应当前的市场条件变化,这是一个已经在我们的高级货币强度28和高级货币冲动指标中使用的成熟的加分项。 在交易时,总是将弱势货币和强势货币配对,这个新指标将帮助你做到这一点。 用户手册:点击这里  https://www.mql5.com/en/blogs/post/708783 特点  显示每个时间段的ACS28和GAP-speed(冲动)的货币强度值。 列:颜色代码以7种颜色
Enigmera
Ivan Stefanov
5 (3)
ENIGMERA:市场核心 https://www.enigmera.com 简介 该指标和交易系统是金融市场的一种非凡方法。ENIGMERA 利用分形周期精确计算支撑位和阻力位。它能显示真实的累积阶段,并给出方向和目标。 该系统无论在趋势中还是在修正中都能发挥作用。 它是如何运行的? ENIGMERA 由三条线组成:支撑/阻力线、目标线和偏离线。与一般市场指标将过去的数据推断为现在和未来的情况不同,该系统能提供当前的完整情况。如果你处于支撑位,这意味着真正的支撑;如果你处于阻力位,这意味着真正的阻力。如果突破某一水平,则表示趋势发生变化。没有重绘。 由于市场在不断变化,ENIGMERA 不断调整其评估工具,定期修改策略。  这保证了每种情况都能得到全面评估。这一市场指标的独特性显而易见,其能力不言而喻。  ENIGMERA 为金融分析师和咨询师提供服务,他们需要可靠的见解与客户分享,也为投资者提供服务,他们需要最精确和最可靠的保证。 该系统能够达到最佳精度,使交易者能够自信、清晰地评估他们的选择。 ENIGMERA 将 20 年的交易专长和知识整合到一个综合软件
PRO Renko System
Oleg Rodin
5 (25)
PRO Renko Arrow Based System for trading renko charts.  准确的信号交易任何外汇工具. 另外,我将免费提供系统的附加模块! PRO Renko系统是RENKO图表上高度准确的交易系统。该系统是通用的。 该交易系统可应用于各种交易工具。 该系统有效地中和了所谓的市场噪音,打开了获得准确反转信号的通道。 该指标易于使用,只有一个参数负责产生信号。 您可以很容易地使算法适应您感兴趣的交易工具和renko酒吧的大小。 我很乐意通过提供任何咨询支持来帮助所有客户有效地使用该指标。 祝您交易成功!购买后,立即写信给我! 我将与您分享我的建议和我的renko发电机。 另外,我将免费提供系统的附加模块!
Quantum Trend Sniper Indicator MT4
Bogdan Ion Puscasu
4.6 (40)
介绍   量子趋势狙击指标 ,突破性的 MQL5 指标,正在改变您识别和交易趋势反转的方式!由拥有超过13年交易经验的资深交易员团队开发,     量子趋势狙击指标   旨在通过其创新的方式以极高的准确度识别趋势反转,将您的交易之旅推向新的高度。 ***购买量子趋势狙击指标,即可免费获得量子突破指标!*** 当量子突破指标识别出趋势反转时,它会向您发出警报和信号箭头,并建议您三个止盈水平。 它既适合新手交易者,也适合专业交易者。 量子 EA 通道:       点击这里 MT5版本:       点击这里 建议: 时间范围:  所有时间范围。为了获得最佳结果,我们建议在 M15、M30 和 H1 时间范围内使用它。 货币对:欧元兑美元、英镑兑美元、澳元兑美元、欧元兑英镑, EURAUD, XAUUSD 账户类型:ECN、Raw 或 Razor,点差极低 经纪时间:任意 经纪商:IC Markets、Pepperstone with Raw 和 Razor 的点差最低 建议止损:50 点 建议止盈水平:20 点、50 点和 1
Please send me Direct message on MQL5 CHAT after purchasing the Indicator for Training and Installation Support There are some additional files that is important to use with the Indicator . So be sure to contact me after purchasing the Indicator So that I can add you for training and support . If you find any difficulty with installation then send me Direct message here So that I can connect with you via Anydesk or Teamview for the product installation. " Smart Order Block Indicator " to find
FX Volume
Daniel Stein
4.6 (35)
通过 mql5 和 Telegram 上 的 " 晨间简报 "获取每日市场更新,包括详细信息和屏幕截图 ! 外汇交易量(FX Volume)是第一个也是唯一一个从经纪商角度真正洞察市场情绪的交易量指标。 直接在您的图表上看到这些信息是真正改变游戏规则和突破性的交易解决方案。 受益于独特的市场数据洞察,如 比率(Ratios )显示货币多头和空头头寸的比率(百分比 比率变化 显示所选时间段内的多头比率及其百分比变化 总交易量 显示货币的总交易量(多头和空头),以手为单位 多头 交易量显示货币所有多头头寸的交易量 空头 交易量显示所有货币空头头寸的交易量 净多头 显示净多头交易量,即所有多头头寸减去所有空头头寸(以手为单位)。 净多头百分比 显示货币净多头交易量的变化 请阅读我们的基本教程 -> "如何使用外汇交易量进行交易 " 获取更多信息,如常见问题、交易技巧和教程视频,请访问我们的 外汇交易量公共信息频道 请 安装并运行 SI Connect 以建立与我们数据中心的持续连接 背景信息 我们都知道,外汇是一个分散的市场。这就是为什么我们必须打破常规思维,开发一个独
Advanced Supply Demand
Bernhard Schweigert
4.92 (313)
现在优惠 33%! 任何新手或专业交易者的最佳解决方案! 该指标是一款独特、高质量、且价格合理的交易工具,因为我们已经整合了许多专有功能和新公式。 依据此更新,您将能够显示双重时间帧区域。 您不仅可以显示一个较高的时间帧,还可以同时显示图表时间帧,加上更高的时间帧:显示嵌套时区。 供需双方所有交易者都会喜欢它。 :) 重要信息披露 高级供需的最大潜力,请访问 https://www.mql5.com/zh/blogs/post/720245   想象您的交易如何得以改善,是因为您能够精准定位入场或目标位吗? 构建于新的底层算法,它可以更轻松地识别出买卖双方之间的潜在失衡。 这是因为它以图形方式展示供需最强劲区域,及其过去的表现(显示旧区域)。 这些功能旨在帮助您更轻松地发现最佳入场区域和价位。 现在您可以针对您的交易品种和时间帧来优化和编辑区域强度! 高级供需指标适用于所有产品和时间帧。 它是一个新的公式,非常新的功能是两个区域强度函数可由用户输入进行调整! 这在交易中是一大优势。 当您学习如何使用专有功能,例如带有价格游离最小 X 因子的区域强度时,您能够判断该区域强劲与否。 供
TakePropips Donchian Trend Pro
Eric John Pajarillaga Aldana
4.82 (17)
TakePropips Donchian Trend Pro   (MT4) 是一款功能强大且有效的工具,可使用 Donchian 通道自动检测趋势方向,并为您提供进场和退场交易信号! 这个多功能指标包括趋势扫描器、交易信号、统计面板、筛选器、交易时段和警报历史仪表板。它旨在为您提供交易信号并节省您分析图表的时间! 您可以在我们的博文中下载用户手册和安装指南:   https   :// www.mql5.com/en/blogs/post/751368 今天立减 50%!价格从 98 美元降到 49 美元! 您可以在 Strategy Tester 上测试该指标(启用可视模式) 视频教程也可在说明下方获得更多详细信息。 如果您有任何问题或需要任何帮助,请与我联系。 TakePropips Donchian Trend Pro 指标适用于所有外汇对、金属、商品、指数和加密货币。 主要特点 交易信号 - 检测多个时间范围内所有货币对的买卖机会。它将为您提供警报并在图表上绘制交易信号,最多 3 个止盈价和一个止损价。 Trend Scanner   - 用于快速扫描和识别跨多个时间
ECM Channel MT4
Paulo Rocha
5 (1)
ECM Elite Channel is a volatility-based indicator, developed with a specific time algorithm, which consists of finding possible corrections in the market. This indicator shows two outer lines, an inner line (retracement line) and an arrow sign, where the channel theory is to help identify overbought and oversold conditions in the market. The market price will generally fall between the boundaries of the channel. If prices touch or move outside the channel, it's a trading opportunity. The
Indicator : RealValueIndicator Description : RealValueIndicator is a powerful tool designed specifically for trading on the EURUSD pair. This indicator analyzes all EUR and USD pairs, calculates their real currency strength values, and displays them as a single realistic value to give you a head start on price. This indicator will tell you moves before they happen if you use it right. RealValueIndicator allows you to get a quick and accurate overview of the EURUSD currency pair tops and bottoms,
TrendDecoder Premium
Christophe Pa Trouillas
5 (6)
确定范围和下一步可能的走势   |  获得早期信号和趋势强度   |  在反转之前获得明确的退出   |  了解价格将测试哪些斐波水平 非重绘、非延迟指标 - 手动和自动交易的理想选择 - 适用于所有资产和所有时间单位 限时优惠 >>   50% OFF 购买后,  请联系我的频道  获取推荐设置 MT5   版本: 点击此处 使用   BladeSCALPER   和   PowerZONES   获取我们的完整方法 它是什么? TrendDECODER 集多种创新于一身,使趋势监测变得简单易行。 投射趋势线(Projective TrendLine)--快速参考即将到来的趋势 实时趋势线(RealTime TrendLine)与投射趋势线(Projective TrendLine)的对比 - 与之前的同方向走势相比,市场是加速还是放缓? 实时趋势线交叉 - 趋势正在偏离轨道 使用 GreyBox - 市场不再是趋势并进入新的过渡序列 使用 DecoderSignals 和 Blue/Orange Clouds - 利用作为动态支撑/阻力的 Blue/Orange
GOLD Impulse with Alert
Bernhard Schweigert
4.56 (9)
这个指标是我们2个产品 Advanced Currency IMPULSE with ALERT  +   Currency Strength Exotics 的一个超级组合。 它适用于所有时间框架,并以图形方式显示8种主要货币和一种符号的强势或弱势冲动! 该指标专门用于显示任何符号的货币强度加速,如黄金、异国货币对、商品、指数或期货。这是它的第一个指标,任何符号都可以被添加到第9行,以显示黄金、白银、石油、DAX、US30、MXN、TRY、CNH等的真实货币强度加速(冲动或速度)。 建立在新的基础算法上,它使识别和确认潜在的交易更加容易。这是因为它以图形方式显示了一种货币的强势或弱势是否正在加速,并测量了这种加速的速度--把它想象成你汽车中的速度表。当你加速时,事情显然会发生得更快,这在外汇市场上也是一样的,即如果你配对的货币正在向相反的方向加速,你就会发现一个潜在的有利可图的交易。 动态市场斐波那契28水平被用作警报触发器,将适应市场活动。如果冲动击中黄色触发线,你将收到警报。然后你就知道作为一个交易员应该做什么。货币对和方向已经给出。只需点击警报按钮,就可以
Gold Channel XAUUSD
Paulo Rocha
5 (2)
Gold Channel is a volatility-based indicator, developed with a specific timing algorithm for the XAUUSD pair, which consists of finding possible corrections in the market. This indicator shows two outer lines, an inner line (retracement line) and an arrow sign, where the theory of the channel is to help identify overbought and oversold conditions in the market. The market price will generally fall between the boundaries of the channel. If prices touch or move outside the channel it is a tra
Introduction to X3 Chart Pattern Scanner X3 Cherart Pattern Scanner is the non-repainting and non-lagging indicator detecting X3 chart patterns including Harmonic pattern, Elliott Wave pattern, X3 patterns, and Japanese Candlestick patterns. Historical patterns match with signal patterns. Hence, you can readily develop the solid trading strategy in your chart. More importantly, this superb pattern scanner can detect the optimal pattern of its kind. In addition, you can switch on and off individu
Currency Strength Exotics
Bernhard Schweigert
4.88 (33)
目前8折优惠! 对任何新手或专家交易者来说都是最好的解决方案! 这个指标是专门用来显示任何符号的货币强度,如异国货币对、商品、指数或期货。它是同类产品中的第一个,任何符号都可以添加到第9行,以显示黄金、白银、石油、DAX、US30、MXN、TRY、CNH等的真实货币强度。这是一个独特的、高质量的、负担得起的交易工具,因为我们已经纳入了一些专有的功能和一个新的公式。想象一下,你的交易将如何改善,因为你能够准确地确定新趋势或剥头皮机会的触发点? 用户手册:点击这里   https://www.mql5.com/en/blogs/post/708876 它适用于所有时间框架。你将很快能够看到TREND! 根据新的基础算法设计,它使识别和确认潜在交易变得更加容易。这是因为它以图形方式显示了8种主要货币和一种符号的强弱。 该指标显示了8种主要货币(澳元加元瑞士法郎欧元英镑日元新西兰美元)的强弱线,再加上一个符号! 该指标显示了符号的真实价值。例如:对于XAUUSD(黄金):价格以美元报价。如果黄金在上涨,你怎么能知道是黄金的强势还是美元的弱势?只有当黄金走强时,我们才会进行
TrendMaestro
Stefano Frisetti
5 (3)
note: this indicator is for METATRADER4, if you want the version for METATRADER5 this is the link:  https://www.mql5.com/it/market/product/108106 TRENDMAESTRO ver 2.4 TRENDMAESTRO recognizes a new TREND in the bud, he never makes mistakes. The certainty of identifying a new TREND is priceless. DESCRIPTION TRENDMAESTRO identifies a new TREND in the bud, this indicator examines the volatility, volumes and momentum to identify the moment in which there is an explosion of one or more of these data a
Advanced Currency IMPULSE with ALERT
Bernhard Schweigert
4.91 (495)
目前31%的折扣!! 对任何新手或专家交易者来说都是最好的解决方案! 这个指标是一个独特的、高质量的、负担得起的交易工具,因为我们已经纳入了一些专有的功能和一个秘密的公式。只需一张图表,它就能给出所有28种货币对的警报。想象一下,你的交易将如何改善,因为你能够准确地确定新趋势或剥头皮机会的触发点 建立在新的基础算法上,它使识别和确认潜在交易变得更加容易。这是因为它以图形方式显示了一种货币的强势或弱势是否正在加速,并测量了这种加速的速度--把它想象成你汽车中的速度表。当你加速时,事情显然会发生得更快,这在外汇市场上也是一样的,即如果你配对的货币正在向相反的方向加速,你就会发现一个潜在的有利可图的交易。 货币动量的垂直线和箭头将指导你的交易! 动态的市场斐波那契23水平被用作警报触发器,将适应市场活动。如果冲动触及黄色触发线,您将在MetaTrader或您的电子邮件或推送警报中收到警报。然后你就知道作为一个交易员应该做什么。货币对和方向已经给出。只要点击警报按钮,就可以切换到该货币对或打开一个新的图表,以便进一步分析。警报级别可以通过用户输入来改变,可以选择3个敏感度级别
Up down v6T
Guner Koca
5 (1)
Thise indicator is up down v6  comes with tradingwiev pinescript. purchased people, after installed on terminal ,contact me on mql5  to get BONUS  TradingView pinescript. up-down indicator is no repaint and works all pairs and lower than weekly time frames charts. it is suitable also 1 m charts for all pairs. and hold long way to signal. dont gives too many signals. when red histogram cross trigger line that is up signal.and price probably will down when blue histogram cross trigger line that
SNR LEVEL INDICATOR Accurate Snr level indicator will only display Fresh Levels that are close to the Current Market Price. This indicator is very accurate in mapping Support & resistance levels. there is an alert feature when the price TOUCHES the SNR LEVEL, WHEN CLOSE CANDLE BREAK/REJECT SNR LEVEL. INDICATOR MARKING :: - SUPPORT LEVEL == V SHAPE - RESISTANCE LEVEL == APEX LEVEL - GAP RESISTANCE & GAP SUPPORT == OPEN CLOSE CANDLE - SUPPORT BECAME RESISTANCE & RESISTANCE BECAME SUPPORT INDIC
Automated Trendlines
Georgios Kalomoiropoulos
5 (17)
趋势线是外汇交易中最重要的技术分析工具。不幸的是,大多数交易者没有正确绘制它们。自动趋势线指标是专业交易者的专业工具,可帮助您可视化市场的趋势运动。 有两种类型的趋势线看涨趋势线和看跌趋势线。 在上升趋势中,外汇趋势线是通过价格变动的最低摆动点绘制的。 连接至少两个“最低点”将创建一条趋势线。 在下跌趋势中,趋势线是通过价格走势的最高摆动点绘制的。 连接至少两个“最高点”将创建一条趋势线。 趋势线何时突破? 当看跌蜡烛收于看涨​​趋势线下方并且蜡烛的高点在趋势线上方时,看涨趋势线会被打破。 当看涨蜡烛收于看跌趋势线上方并且蜡烛的低点低于趋势线时,看跌趋势线会被打破。 趋势线何时删除? 当一根完整的蜡烛在看涨趋势线下方形成时,看涨趋势线将被删除。 当完整的蜡烛在看跌趋势线上方形成时,看跌趋势线将被删除。 您可以从输入参数更改看涨和看跌趋势线的颜色和宽度。
All in One Trade
Alexey Minkov
4.48 (27)
The All-in-One Trade Indicator (AOTI) determines daily targets for EURUSD, EURJPY, GBPUSD, USDCHF, EURGBP, EURCAD, EURAUD, AUDJPY, GBPAUD, GBPCAD, GBPCHF, GBPJPY, AUDUSD, and USDJPY. All other modules work with any trading instruments. The indicator includes various features, such as Double Channel trend direction, Price channel, MA Bands, Fibo levels, Climax Bar detection, and others. The AOTI indicator is based on several trading strategies, and created to simplify market analysis. All-in-One
The Supply and Demand with Swap zones MTF indicator is a powerful tool for technical analysis that has been modified and enhanced to provide traders with even more valuable information. This tool is based on the rule of supply and demand and allows traders to analyze a chart on three different timeframes at once, providing a more comprehensive view of the market. One of the key features of this indicator is the so-called swap zones, which are areas that have been broken through by the price but
"The Squeeze indicator attempts to identify periods of consolidation in a market. In general the market is either in a period of quiet consolidation or vertical price discovery. By identifying these calm periods, we have a better opportunity of getting into trades with the potential for larger moves. Once a market enters into a "squeeze," we watch the overall market momentum to help forecast the market direction and await a release of market energy." Modified TTM Squeeze Indicator is a modifica
Entry Points Pro
Yury Orlov
4.7 (225)
这是一款 MT4 的趋势指标,可提供准确的入场交易信号,且无重绘或延迟。 它可应用在任何金融资产:外汇、加密货币、贵金属、股票、指数。 最好的结果出现在 M15+ 的时间帧内。 指标的 MT5 版本 重要! 购买后请联系我,以便获取详细指南和奖励。 视频 (6:22) - 一个信号赢取的利润等于指标价格的三倍。 视频 (4:44) - 它如何在测试器中工作,我的提示和技巧。 视频 (1:44) - 有关它如何处理加密货币和指数的几句话。 大多数交易者在 Entry Points Pro 指标的帮助下,在第一个交易周内就改善了他们的交易结果。 Entry Points Pro 指标的益处 入场信号无重绘或延迟 如果信号出现,并得到确认(如果信号所在烛条已收盘),则它不会再消失;不像是重绘指标,它会导致重大的财产损失,因为它们可以在显示信号后再将其删除。 无差错开仓 指标算法可令您找到入场交易(买入或卖出资产)的理想时机,从而提高每位交易者的成功率。 Entry Points Pro 可操作任何资产 它允许您在 MT4 平台上交易任何经纪商提供的加密货币、股票、
作者的更多信息
Line Profit
Iurii Tokman
5 (4)
Line Profit   存款货币的可视利润线指标。仅当市场上有安装指标的符号的未平仓头寸时才有效。您可以用鼠标移动线或启用自动跟踪买入价。 指标设置说明: colotLine - 线条颜色 WidthLine - 线宽 colotText - 文本颜色 FontSize - 文本的高度 Anchor - 文本的锚点方法 FollowBid - 跟随买入价 Line Profit   存款货币的可视利润线指标。仅当市场上有安装指标的符号的未平仓头寸时才有效。您可以用鼠标移动线或启用自动跟踪买入价。 指标设置说明: colotLine - 线条颜色 WidthLine - 线宽 colotText - 文本颜色 FontSize - 文本的高度 Anchor - 文本的锚点方法 FollowBid - 跟随买入价
FREE
ChannelRSI5
Iurii Tokman
5 (4)
ChannelRSI5   具有超买和超卖区域动态水平的相对强弱指数 (RSI) 指标。 动态水平随指标和价格的当前变化而变化和调整,代表一种通道。 指标设置 period_RSI - 计算 RSI 指数的平均周期。 Applied_RSI - 应用价格。它可以是任何价格常数:PRICE_CLOSE - 收盘价,PRICE_OPEN - 开盘价,PRICE_HIGH - 期间的最高价,PRICE_LOW - 期间的最低价,PRICE_MEDIAN - 中间价(高 + 低) / 2, PRICE_TYPICAL - 典型价格(最高价 + 最低价 + 收盘价)/ 3, PRICE_WEIGHTED - 加权平均价,(最高价 + 最低价 + 收盘价 + 收盘价)/ 4。 period_channel - 超买超卖区域动态通道的计算周期。
FREE
StopLevel
Iurii Tokman
5 (2)
StopLevel   仪表控制 STOPLEVEL 水平。当液位发生变化时,它会发出警报信号。 STOPLEVEL - 设置止损订单的当前收盘价的最小抵消点数,或允许的最小止损/止盈点数。 STOPLEVEL 的零值意味着没有限制止损/止盈的最小距离,或者交易服务器使用外部机制进行动态水平控制,无法传输到终端。在第二种情况下,STOPLEVEL 实际上是“浮动的”。 指标设置: color_ - 级别的区域颜色 draw_bars - 用于显示级别区域的条数 width_price - 价格标签的厚度   仪表控制 STOPLEVEL 水平。当液位发生变化时,它会发出警报信号。 STOPLEVEL - 设置止损订单的当前收盘价的最小抵消点数,或允许的最小止损/止盈点数。 STOPLEVEL 的零值意味着没有限制止损/止盈的最小距离,或者交易服务器使用外部机制进行动态水平控制,无法传输到终端。在第二种情况下,STOPLEVEL 实际上是“浮动的”。 指标设置: color_ - 级别的区域颜色 draw_bars - 用于显示级别区域的条数 width_price - 价格标签的厚度
FREE
Robo T
Iurii Tokman
Robo T   Robo T Expert Advisor 是一个非指标交易系统。 顾问设置说明: Level_ord   - 与当前价格的距离,用于放置开始挂起的 Buy Stop 和 Sell Stop 订单,默认为 22。 Lot_1   - 一系列购买的初始手数,默认为 0.1。 Lot_2   - 一系列销售的初始手数,默认为 0.1。 TakeProfit   - 利润水平,默认为 30。 TSProfitOnly   - 仅拖网利润。禁用时,尾随也会出现在止损的负区域。默认值为真。 TStop.Buy   - 购买的尾随点数,默认为 13。 TStop.Sell   - 以点为单位的跟踪销售点数,默认为 13。 TrailingStep   - 以点为单位的尾随步长,默认为 2。 level_1   - 放置平均订单的回撤距离,默认为 40。 level_2   - 放置平均挂单的当前价格的距离,默认为 15。 сoef_lot_1   - 平均订单的手数倍增因子,默认为 1.5。 Lot_Digits   - 手数中小数点后的位数。如果最小手数 = 0.1,则 Lot
MovingInWL
Iurii Tokman
MovingInWL   Expert Advisor 旨在在达到某个预定利润水平时将未平仓头寸的止损移至无亏损。 顾问设置说明: MagicNumber - 订单标识符 LevelProfit - 位置必须达到的利润水平,以点为单位,以便将其止损移动到没有损失的水平。 LevelWLoss - 不亏损的点数水平,当其盈利达到 LevelProfit 点数 水平后,止损头寸将转移到该水平。 MovingInWL   Expert Advisor 旨在在达到某个预定利润水平时将未平仓头寸的止损移至无亏损。 顾问设置说明: MagicNumber - 订单标识符 LevelProfit - 位置必须达到的利润水平,以点为单位,以便将其止损移动到没有损失的水平。 LevelWLoss - 不亏损的点数水平,当其盈利达到 LevelProfit 点数 水平后,止损头寸将转移到该水平。
FREE
Shadow Height mt5   阴影指示器。 将烛台阴影的大小(以点为单位)显示为直方图。在两种模式下工作,用户可选择。 指标设置说明 Mode - 指标操作模式,两种模式:第一种高度 - 上下烛台阴影的显示模式;第二个区别是显示烛台阴影差异的模式,上下烛台阴影之间的差异。 Shadow Height mt5   阴影指示器。 将烛台阴影的大小(以点为单位)显示为直方图。在两种模式下工作,用户可选择。 指标设置说明 Mode - 指标操作模式,两种模式:第一种高度 - 上下烛台阴影的显示模式;第二个区别是显示烛台阴影差异的模式,上下烛台阴影之间的差异。   阴影指示器。 将烛台阴影的大小(以点为单位)显示为直方图。在两种模式下工作,用户可选择。 指标设置说明 Mode - 指标操作模式,两种模式:第一种高度 - 上下烛台阴影的显示模式;第二个区别是显示烛台阴影差异的模式,上下烛台阴影之间的差异。
FREE
Comb
Iurii Tokman
3.5 (2)
Comb   指示器显示蜂窝网格或正六边形。替代标准交易终端网格。 指标设置说明: color_comb - 网格颜色 width - 宽度,例如:22为1920*1080分辨率的屏幕,15为1366*768分辨率的屏幕等。 height - 高度,例如:6代表分辨率为1920*1080的屏幕,4代表分辨率为1366*768的屏幕等。   指示器显示蜂窝网格或正六边形。替代标准交易终端网格。 指标设置说明: color_comb - 网格颜色 width - 宽度,例如:22为1920*1080分辨率的屏幕,15为1366*768分辨率的屏幕等。 height - 高度,例如:6代表分辨率为1920*1080的屏幕,4代表分辨率为1366*768的屏幕等。
FREE
Hammering
Iurii Tokman
Hammering   Hammering 是一种自动交易系统,旨在处理任何货币对。交易时,使用多币种和单币种模式。 为了做出交易决策,EA 使用来自 斜率方向线 指标的信号。 设置说明。 Profit_Percent_AccountEquity = 0.4; - 利润水平占可用资金的百分比 Fix_AccountEquity = 0; - 免费资金的强制性水平 FIX_PROFIT = 1000; - 强制利润水平 周期 = 55; - 指标期。 过滤器编号 = 2; - 指标过滤器。 ma_method = 3; - 指标的平均方法。 应用价格 = 0;是指标的使用价格。 TF = 15; - 指标的图表周期。 PAIRS = "EURUSD, GBPUSD, USDCHF, USDJPY"; - 一组用于多货币交易的货币对。 幻数 = 6; - 顾问的订单标识符 TrailingStart = 9.5; - 以点为单位的利润水平。拖网的起始水平,在此之后进行拖网,即开启拖网。 追踪止损 = 0.5; - 以存款货币为单位的固定拖网规模 尾随步长 = 0.5; - 存款货币的尾随步
Robo Grid FX
Iurii Tokman
Robo Grid FX   ROBO GRID FX 是一个网格专家顾问。 专为活跃市场和快速货币对的日内交易而设计。它是一个具有封闭平均系统的网格顾问。在快速和激进的货币对出现存款减少的情况下,闭环平均系统是一种稳定的盈亏平衡策略。 EA 在两个方向放置一个挂单网格,如果出现负仓位,则在价格波动突破 40-60 点走廊时将其锁定。并且它开始显示在网格内部(无需在两个方向移除暴露的网格)以达到盈亏平衡。并且报价在哪个方向(向上或向下)中断通道并不重要。 EA 不会让市场头寸回撤超过 25-40 点,止损和止盈会根据情况和报价的方向或反转不断修改。随着强劲的趋势运动,机器人只是跟随趋势。 所有计算都是根据专家核心内部的预定算法执行的。因此,“EA 交易”具有最少的设置集,这使其更易于使用。 EA 还具有针对浮动点差的保护,这使其运行更加稳定,并确保在浮动点差快速变化的情况下正确放置网格。智能交易系统显示反弹、强劲趋势和重要经济新闻的最佳结果。 设置说明: 批量 - 数量。 步骤 - 订单之间的步骤。 Steps Sell - 第一个村庄和第一个购买之间的距离。 TakeProfit -
Crazy Scalper
Iurii Tokman
3.5 (4)
Crazy Scalper   Crazy Scalper 是一种非指标交易机器人,它使用剥头皮系统同时在两个方向进行交易(买入和卖出)。同时,多向仓位无法盈利,其中一个仓位必然会亏损。如果有亏损仓位,则使用锁(lock)。反过来,如果锁定头寸没有完成其作用并且报价反转,则根据平均系统,使用挂单无损失地使用提款。 MT5 终端 智能交易系统 设置说明 止盈 = 3;   - 以点为单位的利润水平; Lock_Level = 22;   - 下锁订单的距离,以点为单位; coef_l = 1.8;   - 大量锁定订单的乘数; 止盈_Av = 10;   - 所有未结订单的总利润水平; AV_Level = 50;   - 触发平均顺序的距离,以点为单位; OR_Level = 24;   - 从当前价格到放置平均挂单水平的距离; coef_av = 2.0;   - 很多平均订单的乘法系数; 手数 = 0;   - 订单量,如果= 0,MM有效; 风险 = 0.3;   - MM 工作的百分比水平; Choice_method = false;   - MM的工作方法,来自免费资金
Pyramid MA
Iurii Tokman
5 (1)
Pyramid MA   金字塔 MA   - 顾问特性:它使用移动平均线 (MA) 指标。当趋势逆转时更改订单网格。主要交易网格的订单量相对于平均仓位增加的指数。处理挂单 BUYSTOP 和 SELLSTOP。使用损失平均系统来控制未平仓交易的余额并使它们达到收支平衡。有关未完成和已完成交易的声音通知。您可以基于 PYRAMID MA Expert Advisor 轻松创建自己的交易策略。 顾问设置说明: koef_grid = 0.5 - 大量网格订单的倍增因子 指标设置: tf_grid = 0 - 下单时接收指标信号的图表周期。可以是图表上的期间之一。 0 表示当前图表的周期。 1分钟。 5 - 5 分钟。 15-15 分钟。 30 - 30 分钟。 60 - 1 小时240 - 4 小时。 1440 - 1 天。 10080 - 1 周。 43200 - 1 个月。 tf_lock = 60 - 锁定订单时从指标接收信号的图表周期 tf_aw = 60 - 平均订单时从指标接收信号的图表周期 shift = 1 - 从指标缓冲区接收值的索引(相对于当前柱移动指定的周期数)
Boom
Iurii Tokman
Boom   交易机器人基于指标分析。交易决策是根据移动平均线的读数做出的,指标可以使用外部变量进行配置: TF = 0 - 选择图表的工作周期。可以是图表上的期间之一。 0 表示当前图表的周期。 1分钟。 5 - 5 分钟。 15-15 分钟。 30 - 30 分钟。 60 - 1 小时240 - 4 小时。 1440 - 1 天。 10 080 - 1 周。 43,200 - 1 个月。 shift = 0 - 从指标缓冲区接收值的索引(相对于当前柱移动指定的周期数)。 period_fast = 5 - 快速移动平均线指标的周期。 period_slow = 12 - 缓慢移动平均线指标的周期。 mehod = 0 - 平均法。可以是任何移动平均法值。 0 - (SMA) 简单移动平均线。 1 - (EMA) 指数移动平均线。 SMMA 2 - (SMMA) 平滑移动平均线。 LWMA 3 - (LWMA) 线性加权移动平均线。 应用 = 0 - 应用价格。可以是任何价格常数。 0 - (CLOSE) 收盘价。 1 - (OPEN) 开盘价。 2 - (HIGH) 最高价。 3
Forex Jumper
Iurii Tokman
1 (1)
Forex Jumper   Forex Jumper   - 设计用于处理 EURJPY 货币对的智能交易系统。烛台形态分析是做出交易决策的信号。 EA 在交易时使用挂单 BUYSTOP 和 SELLSTOP。 设置: Lot = 0 - 手动设置已开订单的数量 Risk = 13 - MM 的风险百分比,适用于 Lot = 0 MagicNumber = 208 - 顾问的订单和仓位标识符,幻数 TP = 20 - 当市场上有一个单向未平仓头寸时的虚拟利润水平(以点为单位) TP2 = 20 - 当市场上有多个单向持仓时,以点为单位的虚拟利润水平 StopLoss = 500 - 以点为单位的损失水平,如果值为 0(零),则不设置该水平 count_BUY = 1 - 限制市场上同时存在的买单数量,0 时不下单 count_SELL = 1 - 限制市场中同时存在的卖单数量,0 时不下单 滑点 = 3 - 滑点水平,以点为单位 优化顾问外部设置的建议: Start Step Stop TP 1 1 300 TP2 1 1 300 StopLoss 10 2 1000 coun
Bands Jazz
Iurii Tokman
Bands Jazz   Bands Jazz   - EA 交易基于对 布林带 指标信号的分析。 Expert Advisor 的算法很简单,它使用 SL、TP 和未平仓头寸的拖网。 设置说明 TimeBeginHour   - 数字,设置交易开始时间的小时。值从 0 - 24。 TimeBeginMinute   - 数字,设置交易开始时间的分钟数。值从 0 - 60。 TimeEndHour   - 数字,设置交易结束的小时。值从 0 - 24。 TimeEndMinute   - 数字,设置交易结束时间的分钟数。值从 0 - 60。 period   - 计算布林带指标的平均周期。 偏差 - 布林带指标主线的标准偏差数。 band_shift   - 指标相对于布林带指标价格图表的移动。 Applied_price   - 布林带指标的应用价格。 shift   - 从指标缓冲区接收的值的索引(相对于当前柱向回移动指定的周期数),用于布林带指标。 SL   - 损失水平限制,以点为单位 TP   - 预期利润水平,以点为单位 MN   - 订购幻数。用作用户定义的标识符。
Smart YTG
Iurii Tokman
4.67 (6)
Smart YTG   MT5 终端的顾问版本。   |   所有产品 Smart YTG 用于处理 GBPUSD 货币对,图表周期 H1。从本质上讲,该系统具有趋势并且在带有 STOP 订单的价格变动趋势部分完美运行,趋势是通过分析 内置于 EA 内部的价格通道 指标来确定的;无需额外安装该指标。在平盘区,当行情优柔寡断且行情进一步走势确定时,提现系统开始运行而不会亏损,如果市场上有与价格走势方向相反的头寸,则为价格变动方向与订单重叠,当达到总利润时平仓整个系列仓位,而Equity不下跌,保持平衡线,从测试结果可以看出。 代码中的大量计算,以及其中最大的一部分,恰好属于市场形成平台的时刻,您需要在没有回撤和亏损的情况下摆脱它进入趋势。为此,有一个用于动态平仓和静态平仓的块。 动态平仓 - 当强制平仓订单达到设定的总利润时平仓。 静态 - 计算价格水平,当达到该水平时,所有未平仓头寸将产生利润,并将所有未平仓头寸的止盈和止损修改为该水平。两个区块都有自己的设置,可以相互独立工作。使用 EA 交易时,可以同时使用这两个块,因为它们弥补了缺点并在工作中相互补充。 例如:假设由于各种原因,例
Eureka Lock
Iurii Tokman
Eureka Lock   Eureka Lock   - EA 确定相对于指定设置的价格变动的平坦区域。交易是通过从指定平面的边界挂单 BUY STOP 和 SELL STOP 进行的。使用增加的交易量锁定亏损头寸,而不是限制损失。还使用了虚拟利润水平。 设置说明: TF_flet = 15 - 将确定平台的图表周期 Bars_flet = 25 - 确定平盘的柱数 extern int Size_flet = 30 - 限制平面(高度)上下边界之间的距离,以磅为单位 otstyp = 5 - 用于放置挂单的平面边界的偏移量 手数 = 0.1 - 订单量 koef_lot = 2 - 锁定订单的乘数 TakeProfit = 100 - 为设置的手数设置计算虚拟利润水平,以点为单位 MagicNumber = 1975 - 订单的幻数 NumberOfTry = 5 - 经纪人重新报价的交易尝试次数 滑点 = 3 - 滑点水平,以点为单位
Orders Info
Iurii Tokman
Orders Info   该指标在一个图表窗口中显示摘要、一般信息。方便同时交易多个货币对。 该指标指示市场头寸和挂单总数。 单独表示未平仓头寸: 对于货币对, 对于该货币对的未平仓购买数量及其在存款货币中的总利润, 关于公开销售的数量及其总利润, 未平仓买入和卖出头寸的总利润。 对于挂单,表示: 对于货币对,挂单的名称及其编号。   该指标在一个图表窗口中显示摘要、一般信息。方便同时交易多个货币对。 该指标指示市场头寸和挂单总数。 单独表示未平仓头寸: 对于货币对, 对于该货币对的未平仓购买数量及其在存款货币中的总利润, 关于公开销售的数量及其总利润, 未平仓买入和卖出头寸的总利润。 对于挂单,表示: 对于货币对,挂单的名称及其编号。
Adaptive MA
Iurii Tokman
Adaptive MA   移动平均线。计算方法是柱形定义中使用的所有价格的平均值。 指标外部设置说明: MA_period   - 计算指标的平均周期。推荐值:5、13、21、34。 ma_method   - 平均方法。可以是任何移动平均法值。 0 - (SMA) 简单移动平均线。 1 - (EMA) 指数移动平均线。 SMMA 2 - (SMMA) 平滑移动平均线。 LWMA 3 - (LWMA) 线性加权移动平均线。   移动平均线。计算方法是柱形定义中使用的所有价格的平均值。 指标外部设置说明: MA_period   - 计算指标的平均周期。推荐值:5、13、21、34。 ma_method   - 平均方法。可以是任何移动平均法值。 0 - (SMA) 简单移动平均线。 1 - (EMA) 指数移动平均线。 SMMA 2 - (SMMA) 平滑移动平均线。 LWMA 3 - (LWMA) 线性加权移动平均线。
Cardiogram Market   设置说明: MA_period_fast   - 用于计算快速移动平均线的平均周期。 MA_period_slow   - 计算慢速移动平均线的平均周期。 price   - 要使用的价格。可以是任何价格常数。 0 - (CLOSE) 收盘价。 1 - (OPEN) 开盘价。 2 - (HIGH) 高价。 3 -(低)最低价格。 4 - (MEDIAN) 平均价格,(高 + 低)/ 2。 5 -(典型)典型价格,(最高价 + 最低价 + 收盘价)/ 3。 6 - (加权)加权收盘价,(最高价 + 最低价 + 收盘价 + 收盘价)/ 4。 方法 - 平均方法。可以是任何移动平均法值。 0 - (SMA) 简单移动平均线。 1 - (EMA) 指数移动平均线。 SMMA 2 - (SMMA) 平滑移动平均线。 LWMA 3 - (LWMA) 线性加权移动平均线。
Piramida Grid
Iurii Tokman
Piramida Grid   Piramida Grid - 进入市场,顾问分析 斜率方向线 指标的读数。当市场反转时改变订单网格。处理挂单 BUYSTOP 和 SELLSTOP。使用损失平均系统来控制未平仓交易的余额及其无损失的输出。自动检测 6 位和 5 位数字。 顾问设置: 周期 = 32; - 斜坡方向线指示器的周期 过滤器编号 = 2; - 设置坡度方向线指示器的过滤器 ma_method = 3; - 平滑斜率方向线指标读数的方法 应用价格 = 0; - 用于计算斜率方向线指标的价格 TF = 15; - 斜率方向线指标的图表周期 止损 = 0; - 限制点数的损失水平 Order_Step = 20; - 以点为单位的网格订单之间的距离 Count_Order = 5; - 网格中的订单数量 Lock_Pips = 22; - 以点为单位打开平均订单的距离 克夫 = 2; - 乘以大量平均订单的系数 利润 = 10; - 以点为单位的利润水平 手数 = 0.1; - 起始手数 MN = 100; - 顾问订单的幻数 UseSound = True; - 启用或禁用顾
Martin Pristine
Iurii Tokman
5 (1)
Martin Pristine   Martin Pristine 是一个交易机器人,一个使用 价格通道中心 指标读数的分析作为做出交易决策的信号的顾问。不需要在图表上额外安装指标,指标内置于“EA 交易”内部。 每次亏损交易后,交易量乘以 2。 EA 自动检测货币对报价中的 5 位和 6 位数字。 一次只能在市场上持有一个头寸。 顾问设置说明: TF = 15;   - 为价格通道中心指标 选择图表周期 Bars_Count = 100;   - 价格通道中心指标 的分析柱数 止损 = 50; - 限制点数损失 止盈 = 50; - 以点数限制利润 手数 = 0.1; - 顾问订单的起始量 MN = 2808; - 顾问订单的幻数 UseSound = True; - 在顾问中启用或禁用事件的声音伴奏 市场观察 = 真; - 通过修改方法设置损益水平 滑点 = 30; - 最大允许价格滑点
Future Price
Iurii Tokman
Future Price   未来价格 - 该指标根据报价历史中的匹配搜索显示未来价格变动的预期选项。该指标以两种模式运行,第一种 - 枚举和显示指定数量的选项,第二种 - 指标显示一组选项。 设置说明 静态变量 = 0; - 设置要显示的所需选项,如果= 0,则选项的迭代有效 TOTAL_VARIANTS = 20; - 设置一组选项的数量,建议不要超过30 Time_Seconds_Show = 3; - 给定集合中一个选项的最小显示时间,最大时间受下一个报价到达时间的限制 Future_Bars = 50; - 未来显示的柱数,建议不超过60 History_Bars = 636; - 历史中分析柱的数量   未来价格 - 该指标根据报价历史中的匹配搜索显示未来价格变动的预期选项。该指标以两种模式运行,第一种 - 枚举和显示指定数量的选项,第二种 - 指标显示一组选项。
Reanimator
Iurii Tokman
Reanimator   半自动交易机器人。要打开/关闭头寸,请使用按钮。根据虚拟利润水平自动进行头寸的进一步跟踪。还使用了一种用减少/增加的手数来平均无利可图的头寸的系统。策略测试器中顾问的按钮控制不起作用;顾问只能在演示或真实账户上进行全面测试。在策略测试器中,可以使用特殊设置 OPEN_BUY 和 OPEN_SELL 来测试顾问程序。 设置 colorBUY - 购买方向的线条颜色 colorSELL - 销售方向的线条颜色 _width - 线宽 MagicNumber - 顾问订单的标识符。机器人只会处理只有这样一个数字的订单。 LOT - 固定手数。在 0 MM 工作(资金管理) Choice_method - MM 方法。 true - AccountBalance, false - AccountFreeMargin 风险 - MM 的利率风险。仅适用于 LOT = 0 drawdown_pip - 以增加/减少手数开仓的点数距离 koef_martingale - 许多平均位置的乘法因子 利润点 - 以点为单位的虚拟利润水平,相对于起始手数计算 Show_Sco
FletBoxPush
Iurii Tokman
FletBoxPush   该指标根据指定的参数确定价格变动的平坦区域。 设置: TimeFrames - 图表周期的选择。 FlatPips - 确定平面的点数限制 FlatBars - 用于确定平面的柱线数量限制 CountBars - 用于分析价格变动的历史柱数,在 0 时分析历史中的所有柱 颜色 - 定义为平面的价格段的颜色 PriceTag - 价格标签的附加绘图 警报 - 显示包含用户数据的对话框 文本 - 警报的自定义文本 Send_Mail - 向“邮件”选项卡上的设置窗口中指定的地址发送电子邮件 主题 - 电子邮件标题 Send_Notification - 向移动终端发送通知,其 MetaQuotes ID 在“通知”选项卡的设置窗口中指定。 该指标根据指定的参数确定价格变动的平坦区域。
Bar Boss
Iurii Tokman
5 (1)
Bar Boss   Expert   Advisor 使用 FletBoxPush 指标来分析市场并确定交易信号。该指标内置于“EA 交易”中,不需要在图表上额外安装。交易发生在定义为平台边界的水平上。使用损失限制。 顾问设置说明 TimeFrames - 图表周期,指标设置 颜色 - 定义为平面的价格区域的颜色,为指标设置 矩形 - 显示定义为平坦的价格区域,为指标设置 手数 - 起始交易量 MagicNumber - 订单的幻数 Count_LOSS - 连续亏损交易的数量,之后将设置为零利润(退出为零) FlatPips - 以点为单位确定平台,设置指标 FlatBars - 用于确定平面的柱数限制,为指标设置 MinBarsClosedOutside - 收盘价固定在特定平面水平之上/之下的柱数 CoefficientLot - 亏损后后续交易手数的乘数 CoefficientTakeProfit - 根据确定的平台的通道宽度计算的利润乘数 PercentLoss - 损失百分比,如果顾问带来的总损失低于此值,交易停止,该值必须设置为负数,例如:-33.3 顾问如何工
BarKhan
Iurii Tokman
BarKhan   BarKhan - 该指标计算为三个数字移动平均线的差值之和。计算公式如下:数字移动平均线#1和#2的差值与数字移动平均线#2和#3的差值相加 指标设置说明: MA_Period1 - 第一个数字移动平均线的周期 MA_Period2 - 第二个数字移动平均线的周期 MA_Period3 - 第三个数字移动平均线的周期   BarKhan - 该指标计算为三个数字移动平均线的差值之和。计算公式如下:数字移动平均线#1和#2的差值与数字移动平均线#2和#3的差值相加 指标设置说明: MA_Period1 - 第一个数字移动平均线的周期 MA_Period2 - 第二个数字移动平均线的周期 MA_Period3 - 第三个数字移动平均线的周期
Octet
Iurii Tokman
Octet   该指标是多货币的,它同时分析 56 种货币对。重要的是,所有货币对都在市场概览中并为其加载报价。 该指标以一条线的形式显示某种货币相对于其他7种货币的涨跌。指标值以百分比表示。 指标设置说明 Type_Calculation - 计算货币增长或下跌百分比的三个选项 前缀 - 当货币对的名称中有前缀时使用,例如:EURUSD.fxp,则设置 Prefix = .fxp Show_AUD - 显示澳元货币相对于其他 7 种货币的总计算值 Show_EUR - 显示欧元货币相对于其他 7 种货币的总计算值 Show_GBP - 显示英镑货币相对于其他 7 种货币的总计算值 Show_NZD - 显示新西兰元货币相对于其他 7 种货币的总计算值 Show_CAD - 显示 CAD 货币相对于其他 7 种货币的总计算值 Show_CHF - 显示 CHF 货币相对于其他 7 种货币的总计算值 Show_JPY - 显示日元货币相对于其他 7 种货币的总计算值 Show_USD - 显示美元货币相对于其他 7 种货币的总计算值 Show_NAME - 显示指标线的货币名称 ca
Strong Weak
Iurii Tokman
Strong Weak   多货币指标同时分析 56 个货币对: AUD EUR GBP NZD CAD CHF JPY USD AUD SUMM EURAUD GBPAUD AUDNZD AUDCAD AUDCHF AUDJPY AUDUSD EUR EURAUD SUMM EURGBP EURNZD EURCAD EURCHF EURJPY EURUSD GBP GBPAUD EURGBP SUMM GBPNZD GBPCAD GBPCHF GBPJPY GBPUSD NZD AUDNZD EURNZD GBPNZD SUMM NZDCAD NZDCHF NZDJPY NZDUSD CAD AUDCAD EURCAD GBPCAD NZDCAD SUMM CADCHF CADJPY USDCAD CHF AUDCHF EURCHF GBPCHF NZDCHF CADCHF SUMM CHFJPY USDCHF JPY AUDJPY EURJPY GBPJPY NZDJPY CADJPY CHFJPY SUMM USDJPY USD AUDUSD EURUSD GBPUSD
Firm
Iurii Tokman
Firm   EA 不使用指标,它一直在市场中。顾问的逻辑基于对市场上已打开订单的分析。 顾问设置说明: StopLoss_Percent - 损失水平,百分比 TakeProfit - 利润水平,以点为单位 风险 - 自动确定 EA 订单量的设置,适用于 LOT = 0 LOT - 固定数量的订单 Slippage - 最大允许的价格滑点 MagicNumber - 顾问订单的幻数 Show_Information - 启用或禁用信息板 color_background - 背景颜色 color_text - 文本颜色 color_negative - 负值的颜色 color_positive - 正值的颜色 EA 不使用指标,它一直在市场中。顾问的逻辑基于对市场上已打开订单的分析。
Grid Flat
Iurii Tokman
Grid Flat   EA 以指定的步骤放置一个订单网格。对于所有相同类型的订单,订单具有网格步距的利润水平和一般亏损水平。交易仅在设置中指定的时间段内进行,在时间结束时删除所有挂单并强制关闭所有未平仓头寸。不建议将 EA 用作长期交易的全自动交易系统,仅用于在某些市场情况下工作,例如发布重要新闻或其他类似市场情况。 顾问设置说明 Open_BuyStop - 打开/不打开待处理的 Buy Stop 订单网格 Open_SellStop - 打开/不打开挂单的卖出止损订单网格 Open_BuyLimit - 打开/不打开待定买入限价订单网格 Open_SellLimit - 打开/不打开挂单的卖出限价订单网格 TIME_HOUR_START - 顾问开始工作的小时数,值从 0 到 23 TIME_MINUTE_START - 顾问开始工作的分钟数,值从 0 到 59 TIME_HOUR_STOP - EA 交易结束的小时数,值从 0 到 23 TIME_MINUTE_STOP - 顾问结束的分钟数,值从 0 到 59 Grid_levels - 网格中的级别数 Step_Grid
筛选:
无评论
回复评论