Multi Time Frame RSI Indicator
- 指标
- Valeriy Medvedev
- 版本: 1.0
- 激活: 5
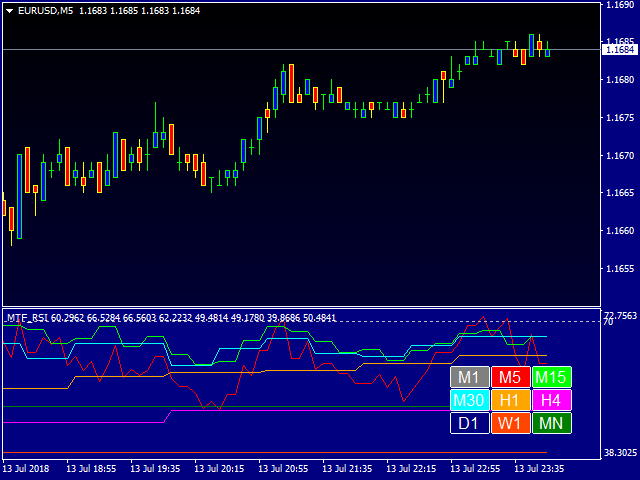
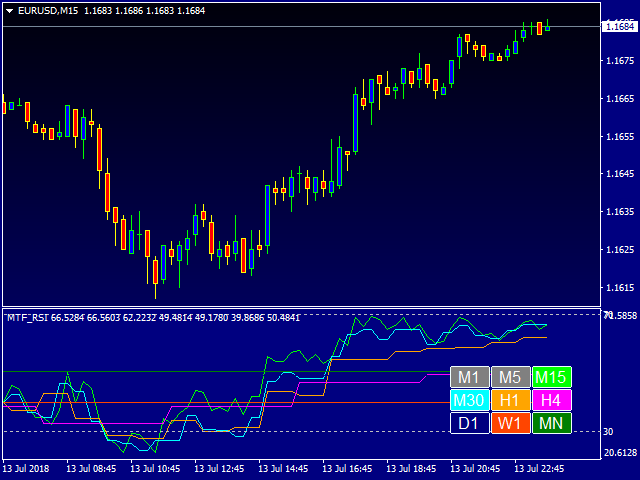
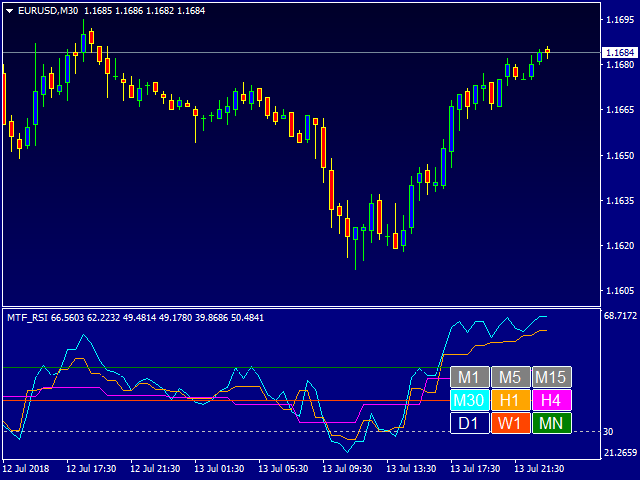
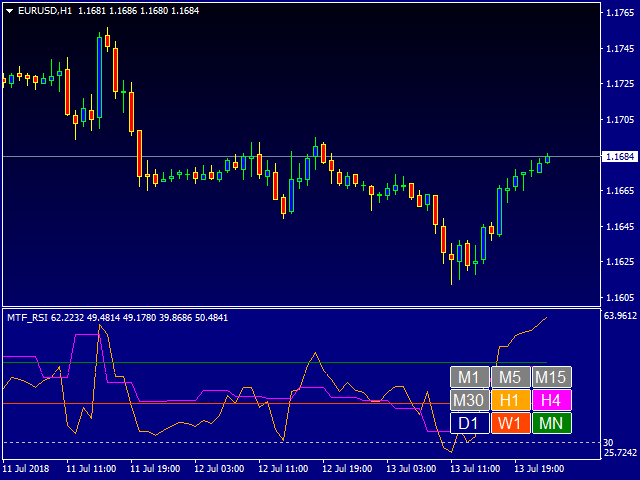
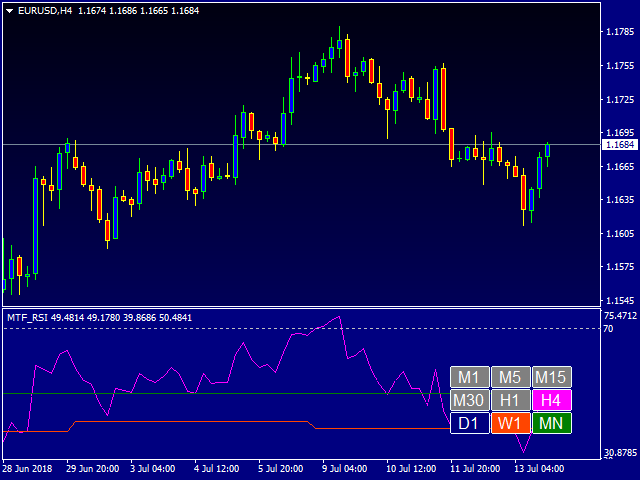
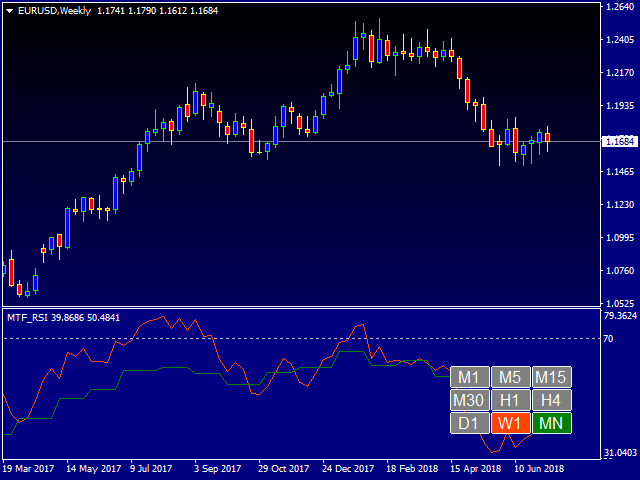
This indicator is designed for monitoring RSI levels on the current and higher timeframes. The control panel is user friendly and consists of buttons, with which you can control the display of lines as per the names of the buttons. The button color matches the line color.
Parameters
"___| Settings of the main indicator "
- RSI Period - averaging period for index calculation (default is 14);
- RSI Price type - price used for calculations (default is the Close price);
"___| Color palette "
- Text color - default is White;
- ColorM1 - line color for the M1 timeframe (default is DodgerBlue);
- ColorM5 - line color for the M5 timeframe (default is Red);
- ColorM15 - line color for the M15 timeframe (default is Lime);
- ColorM30 - line color for the M30 timeframe (default is Aqua);
- ColorH1 - line color for the H1 timeframe (default is Orange);
- ColorH4 - line color for the H4 timeframe (default is Magenta);
- ColorD1 - line color for the D1 timeframe (default is Navy);
- ColorW1 - line color for the W1 timeframe (default is OrangeRed);
- ColorMN - line color for the MN timeframe (default is Green);
Specify the averaging period for the index calculation, and the indicator will show you RSI on all higher periods. Alternatively, you can set the display of index values of required timeframes.















用户没有留下任何评级信息