RedYGreem
一个简明的趋势与震荡的标示指标。
版本升级:增加预警及通知,增加买卖方向建议,优化界面显示。
更多编程服务可加微信 luolin9687
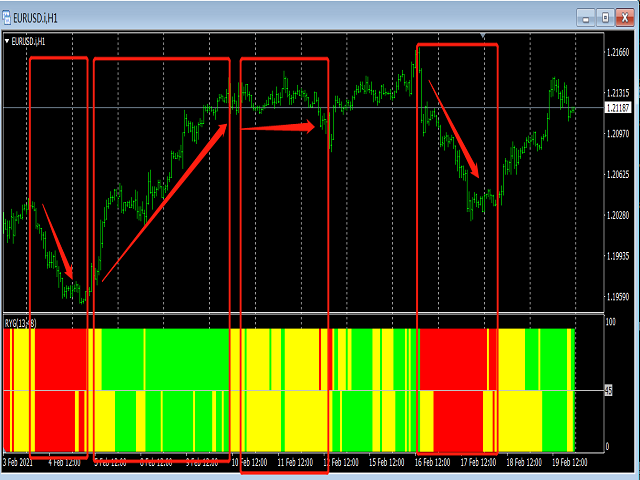
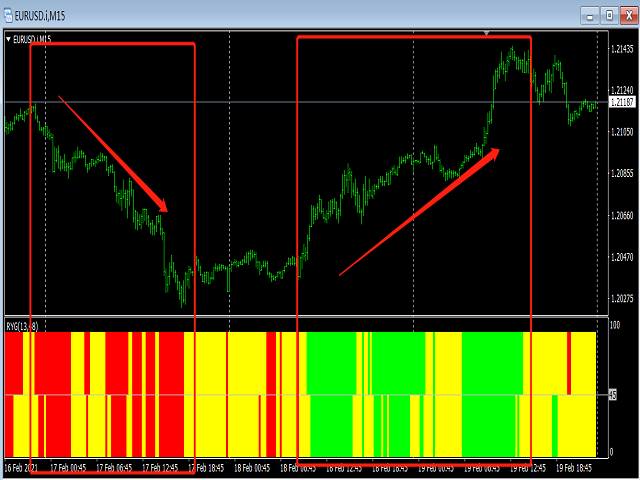
使用红黄绿三色来标示。
红色表示空头趋势(下跌)。
绿色表示多头趋势(上涨)。
黄色表示震荡区域。
从黄色转变为红色时,行情可能从震荡转变为下跌趋势。一段连续的红色,说明下跌趋势很强。
从黄色转变为绿色时,行情可能从震荡转变为上升趋势。一段连续的绿色,说明上升趋势很强。
指标的上半部分区域和下半部分区域若同步为红色,表明下跌趋势已经形成共振,接下来大概率走出一段空头趋势。
若上下 同时为绿色,表明上涨趋势已经形成共振,接下来大概率走出一段多头趋势。
若上下同时为黄色,表明当前行情为震荡。
参数可调。
//+-------------------------------------------------------------------------------------------+
特别提示
市场行情是不确定的,任何指标都是根据行情价格的演变而来,不保证使用此指标的盈利性。
middel