Average Daily Range Marker
- 指标
- Stoyan Roev
- 版本: 1.0
- 激活: 5
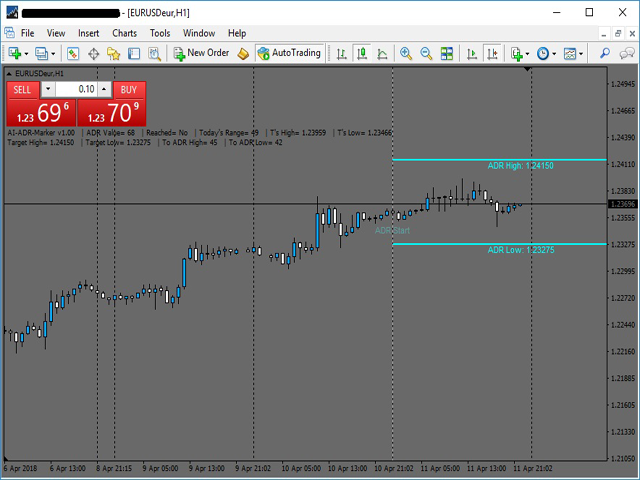
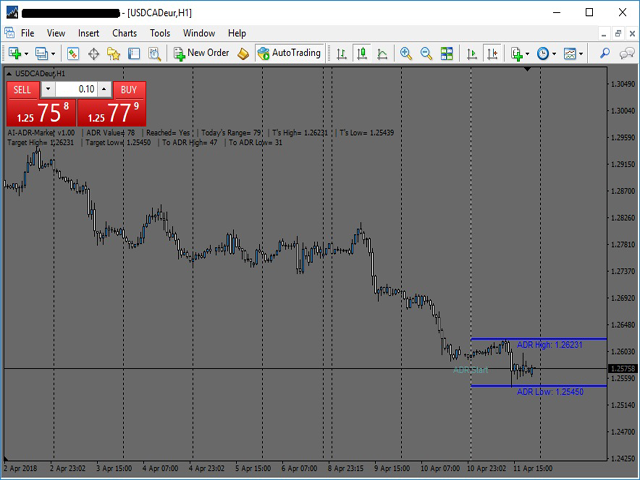
- The Average Daily Range shows the dynamic levels of average pip range on a pair measured based on the daily Highs and Lows over a certain periods.
- You can use the ADR to visualize potential price action outside the average daily move. When ADR is above average, it means that the daily volatility is higher than usual.
- The ADR can be helpful in setting targets for positions. If the ADR shows you that a pair has an average daily range of 80 pips, then it might be wise to tighten up your target in this range.
- ADR Marker is also useful for trading intraday reversals. If a currency pair reaches the top of a daily range, then it could be due for a reversal, and you could capture a potential retracement.
Indicator parameters
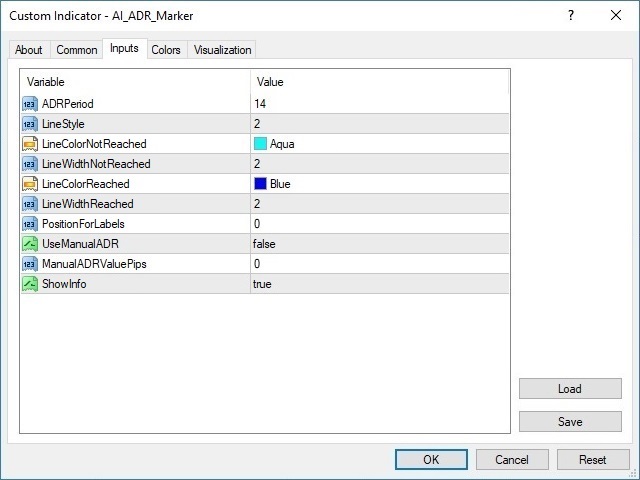
- ADRPeriod - calculating the period of average daily range in days (default 14)
- LineStyle - style of the displayed lines (default 2)
- LineColorNotReached - the color of the lines when ADR are not reached (default Aqua)
- LineWidthNotReached - width of the lines when ADR are not reached (default 2)
- LineColorReached - the color of the lines when ADR are reached (default Blue)
- LineWidthReached - width of the lines when ADR are reached (default 2)
- PositionForLabels - position of the price value labels under the lines (default 0)
- UseManualADR - option for usage of manual ADR value(default false)
- ManualADRValuePips - input your ADR value in pips (default 0)
- ShowInfo - display the information text (default true)
How to configure the indicator
- The indicator is provided with option for manual input of ADR, which allows you to use your own ADR value in pips.
- If you want to give a try with different settings you can open Indicator list, choose AI_ADR_Marker and click on "Inputs" tab.



On all my charts very handy detail.