Balance Channel
- 指标
- Rustem Bigeev
- 版本: 1.20
- 激活: 5
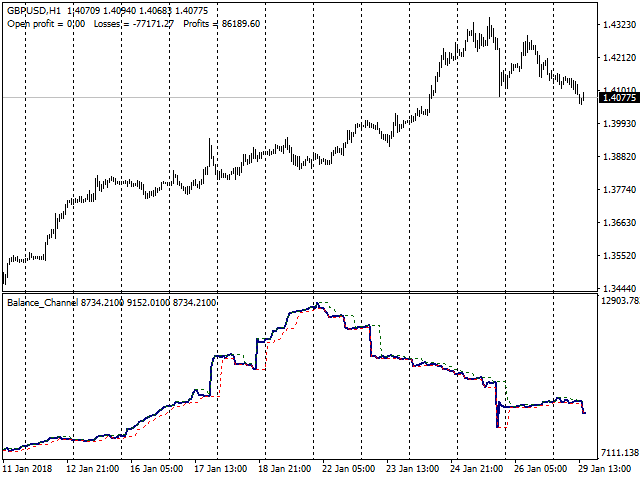
The Balance Channel indicator shows changes in the dynamics of the account balance on closed deals, and also graphically displays the current result of open positions in the form of the last segment on the line.
The balance line is enclosed in the boundaries of the price range, the period of which can be set by a separate parameter "Period". This option can clearly show when the drawdown reaches a given critical value.
The balance line can be calculated both in the account currency and deals made taking into account the volume and in points, without taking the volume into account. This makes it possible to evaluate the quality of signals of your trading system or trading rules. The parameter "Calculate Type" is responsible for switching this option.
The indicator allows you to display the balance line calculated on the basis of deals on all instruments and on a single instrument. To do this, you set the indicator on the chart of the selected instrument and set the "Instrument" parameter to "Current". To display the balance line for all instruments, this parameter should be set to "All".
The parameters "Use Buy" and "Use Sell" allow you to analyze the balance line separately for Buy or Sell deals. This can be done both for deals on all instruments, and on a single instrument.
Parameter explanation
- Period - Sets the period of the price range for the balance line similar to the PriceChannel indicator, but for the balance curve in this case.
- Calculate Type - Set the balance curve calculation mode. If "in money", the calculation is carried out in the account currency based on deals made taking the volume into account. If "in points", the calculation is carried out in points without taking into account the volume of deals as the difference between the opening and closing prices of the deals.
- Instrument - If "All", for all instruments; if "Current", for the instrument of the chart the indicator is running on.
- Use Buy - If "true", Buy deals are taken into account. If "false", Buy deals are excluded from the calculation.
- Use Sell - If "true", Sell deals are taken into account. If "false", Sell deals are excluded from the calculation.
- ShowResults - If "true", the final results are displayed in the main chart window. Profit/Loss of open positions (OpenProfit), the total amount of losses (Losses), the total amount of profit (Profits). If "false", the final figures are not displayed on the screen.
One of the options for using this indicator: the signal about the beginning of a downtrend is the balance curve breaking the lower line of the channel downwards. A steady negative dynamics of the balance curve indicates that the overall quality of deals has decreased, and it is time to reduce risks, up to trading with the minimum possible volumes. This is also a sound reason to think about how the parameters of your trading indicators or settings of your Expert Advisor correspond to the current market condition. When the balance curve of the selected instrument updates the upper line, you may continue trading with the normal volumes, but, of course, according to your risk management policy.
The indicator displays the balance curve only based on available history of deals. If there are no deals on your account, the indicator will not work.


