• 概述
  • 评论
  • 评论

AllTrendLines

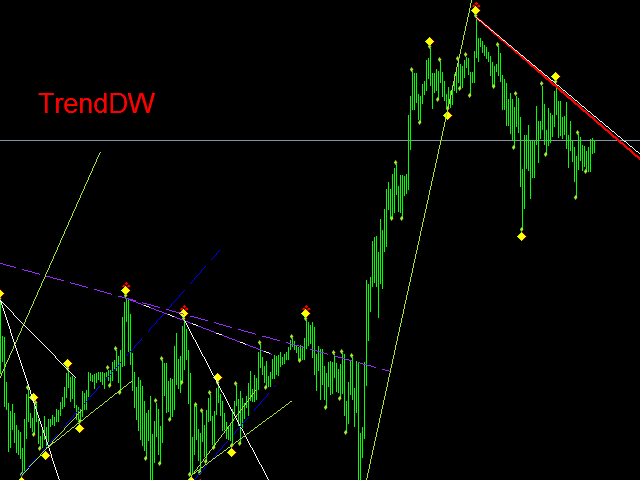
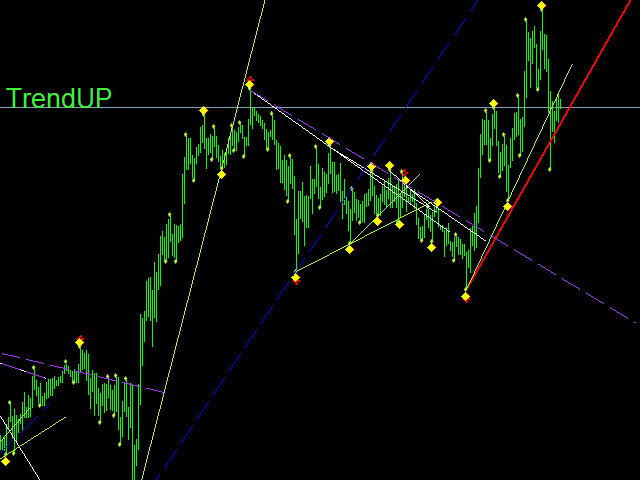
The indicator determines the support/resistance lines on three timeframes simultaneously:

  • one TF smaller;
  • current TF;
  • one TF higher.

In addition to the support/resistance lines, the indicator identifies the reversal points (wave peaks):

  • red dots - peaks on the smallest timeframe;
  • yellow points - peaks on the current timeframe.

Parameters

  • Show trend line - show the main trend line.
  • Main Trend Line Color - color of the trend line.
  • Show trend text - show the trend direction text.
  • Resistance High line color - color of the resistance lines of the smallest TF.
  • Support High line color - color of the upper support lines of the smallest TF.
  • Resistance Low line color - color of the resistance lines of the current and higher TF.
  • Support Low line color - color of the support lines of the current and higher TF.
  • Alarm wave peaks - alert when a reversal point forms.
My other programs and monitoring: https://www.mql5.com/en/users/trendhunter/seller
推荐产品
VR Cub
Vladimir Pastushak
VR Cub 这是获得高质量切入点的指标。该指标的开发是为了促进数学计算并简化对仓位入场点的搜索。多年来,该指标所针对的交易策略已被证明其有效性。交易策略的简单性是其巨大的优势,即使是新手交易者也能成功进行交易。 VR Cub 计算开仓点以及获利和止损目标水平,这显着提高了效率和易用性。查看使用以下策略进行交易的屏幕截图,了解简单的交易规则。 设置、设置文件、演示版本、说明、问题解决,可以从以下位置获取 [博客] 您可以在以下位置阅读或撰写评论 [关联] 版本为 [MetaTrader 5] 计算入场点的规则 开仓 要计算入场点,您需要将 VR Cub 工具从最后一个高点拉伸到最后一个低点。 如果第一个点在时间上早于第二个点,交易者等待柱线收于中线上方。 如果第一个点在时间上晚于第二个点,交易者等待柱线收于中线下方。 根据上述条件,严格在 柱线收盘 后建仓。 换句话说,如果我们在小时图上进行交易,那么从最高点到最低点的时间距离必须超过24小时,最高点和最低点之间的点数必须大于或等于平均价格变动每天。 维持和改变市场地位 可以有多个未平仓头寸;每个头寸都可以单独修改。 VR Cu
Owl smart levels
Sergey Ermolov
4.34 (35)
MT5版本  |  FAQ Owl Smart Levels Indicator   是一個完整的交易系統,包含   Bill Williams   的高級分形、構建正確的市場波浪結構的 Valable ZigZag 以及標記準確入場水平的斐波那契水平等流行的市場分析工具 進入市場和地方獲利。 策略的详细说明 指示灯使用说明 顾问-贸易猫头鹰助手助理 私人用户聊天 ->购买后写信给我,我会将您添加到私人聊天中,您可以在那里下载所有奖金 力量在於簡單! Owl Smart Levels   交易系統非常易於使用,因此適合專業人士和剛開始研究市場並為自己選擇交易策略的人。 策略和指標中沒有隱藏的秘密公式和計算方法,所有策略指標都是公開的。 Owl Smart Levels 允許您快速查看進入交易的信號,突出顯示下訂單的水平並向您發送有關已出現信號的通知。 優點很明顯: 清楚地顯示主要和更高時間框架的趨勢方向。 指示儀器信號的出現。 標記開單、止損設置和固定利潤的水平。 沒有多餘的,只有必要的結構! ZigZag   表示全球趨勢的方向,因此也表示貿易方向。 市場反轉點的短線清楚地表明在
FreqoMaster
Stanislav Korotky
The main idea of this indicator is rates analysis and prediction by Fourier transform. The indicator decomposes exchange rates into main harmonics and calculates their product in future. The indicator shows 2 price marks in history, depicting price range in the past, and 2 price marks in future with price movement forecast. Buy or sell decision and take profit size are displayed in a text label in the indicator window. The indicator uses another indicator as an engine for calculations - FreqoMet
Trendiness Index
Libertas LLC
5 (3)
"The trend is your friend" is one of the best known sayings in investing, because capturing large trendy price movements can be extremely profitable. However, trading with the trend is often easier said than done, because many indicators are based on price reversals not trends. These aren't very effective at identifying trendy periods, or predicting whether trends will continue. We developed the Trendiness Index to help address this problem by indicating the strength and direction of price trend
Imbalance / Fair Value Gap (FVG), this is a zone / gap created when the price move with force in a given direction. It identify a zone where the price could potentially go back. This gives perfect targets for your trades. Imbalance is created from the high and low of 3 candles. When the wicks the of 1st and 3rd candle does not fully overlap the middle one. This indicator will help you to easily spot mitigated/unmitigated imbalances in your chart. NEW FEATURE Update: Multi-TimeFrame Feat
Trend Scanner
Vladimir Kalendzhyan
4.33 (6)
By purchasing this indicator, you have the right to receive a free copy of one of   my other indicator's or advisor’s!  (All future updates are included. No limits) . To get it , please contact me by  mql5 message ! The Trend Scanner trend line indicator displays the trend direction and its changes. The indicator works on all currency pairs and  timeframes. The indicator simultaneously displays multiple readings on the price chart: the support and resistance lines of the currency pair, the exist
Daily FIBO Pro
Mark Thimoty Evangelista
使用 BERG Daily FIBO Pro 释放您的交易潜力 BERG Daily FIBO Pro   是专为 MetaTrader 4 (MT4) 平台设计的强大且可定制的斐波那契回撤指标。无论您是经验丰富的交易者,还是刚刚起步,这个指标都是您识别关键支撑位和阻力位、提升市场分析并优化交易策略的理想工具。 为什么选择 BERG Daily FIBO Pro?   斐波那契分析的精确性:   借助基于前一天高点和低点自动计算的斐波那契回撤水平,在市场上获得优势。 BERG Daily FIBO Pro   绘制了各个水平(0%、23.6%、38.2%、50%、61.8%、78.6%、100%),帮助您轻松识别潜在的市场转折点。   智能报警系统:   使用可定制的警报系统,确保您不会错过任何机会,当价格触及任何斐波那契水平时,系统将通知您。您可以选择视觉弹出警报或声音信号,随时掌握您的交易动态。   完全可定制的视觉效果:   根据您的交易风格调整指标的外观。调整颜色、线条样式、标签文字、字体大小和位置,创建既信息丰富又赏心悦目的图表。   动态更新:  
Support and Resistance is a very important reference for trading.  This indicator provides customized support and resistance levels, automatic draw line and play music functions.  In addition to the custom RS, the default RS includes Pivot Point, Fibonacci, integer Price, MA, Bollinger Bands. Pivot Point is a resistance and support system. It has been widely used at froex,stocks, futures, treasury bonds and indexes. It is an effective support resistance analysis system. Fibonacci also known as t
Lines Target ZFS
Vasiliy Smirnov
The main function of the indicator is to draw the target lines (support and resistance lines). The lines are plotted according to a special fractal algorithm. The lines are calculated with consideration of the zero bar. A different, more complicated calculation algorithm is used on the zero bar, in contrast to the other bars. This allows reacting to the market situation in real time, but on the other hand, redrawing is possible on the zero bar. If necessary, the zero bar can be omitted from calc
BPSPanel
Remi Passanello
BPS Panel Breakout Pro Scalper Solution Panel This indicator is part of the   RPTrade Pro Solutions  systems. BPS Panel   is a daily trend indicator using Price Action, Dynamic Support and Resistances. It's designed to be used by anyone, even the absolute beginner in trading can use it. NEVER repaints . Indications are given   from close to close . Designed to   be used alone , no other indicators are required. Gives you the trend and potential Take Profit at the beginning of the day. How
ATeam Divergence
Hoang Ngoc Thach
The CCI Divergence is a reasonably useful indicator in itself, but it is even more effective when used with divergence pattern trading. The CCI Divergence indicator signal is one of the most potent signals among the indicators that exist in the market. Here is new version for Divergence Indicator using CCI method, with more improvements. Divergences indicate a potential investment point because the directional moment does not confirm the price. A bullish divergence occurs when the underlying
Price Breakout pattern Scanner is the automatic scanner for traders and investors. It can detect following patterns automatically from your chart. Head and Shoulder - Common tradable pattern. Reverse Head and Shoulder - This pattern is the reverse formation of the Head and Shoulder. Double Top - When the price hits resistance level twice and decline toward the support level, the trader can anticipate sudden bearish breakout through the support level. Double Bottom - The double bottom pattern is
这是一个 MTF 指标,它基于 带有价格标签的 Advanced ZigZag Dynamic 和/或 Extended Fractals 指标极值(可以禁用)。可以为 MTF 模式选择更多更高的 TF。默认情况下,级别是基于 ZigZag 指标点生成的。分形指标点也可以与 ZigZag 一起使用或代替它。为了简化使用并节省 CPU 时间,每根柱线在开盘时执行一次计算。 参数: ForcedTF - 水平计算的图表时间范围(可能等于或超过当前时间) MinPipsLevelWidth   - 以点为单位的最小关卡宽度(用于非常紧凑的关卡) Use ZigZag Extremums points - 启用/禁用使用 ZigZag 峰值计算支撑/阻力水平 Fixed pips range - 计算 ZigZag 指标的最小值和最大值之间的距离 UseDynamicRange   - 启用/禁用 ZigZag 指标最小值和最大值之间距离的动态计算 Dynamic volatility period - 用于计算 ZigZag 指标最小值和最大值之间的动态距离的波动期 Dynamic vola
Title : Market Bias Indicator - Oscillator-Based Trading Tool Introduction : Discover the potential of the "Market Bias Indicator," a revolutionary oscillator-based trading tool designed for precise market analysis. If you're in search of a robust alternative to traditional bias indicators, your quest ends here. Market Bias Indicator offers unparalleled accuracy in identifying market sentiment and is your gateway to confident trading decisions. Recommended Trading Pairs : Market Bias Indicator i
MovingFlatBreakout
Stanislav Korotky
This indicator monitors the market for a flat state and possible breakout. The flat state is detected as a predefined number of consecutive bars during which price fluctuates inside a small range. If one of the next bars closes outside the range, breakout is signaled. The indicator shows 3 lines: blue - upper bound of flat ranges AND consecutive breakout areas; red - lower bound of flat ranges AND consecutive breakout areas; yellow - center of flat ranges (NOT including breakout areas). When a b
PZ Pivot Points
PZ TRADING SLU
This indicator displays pivot points in the chart, including historical vales, and supports many calculation modes for Pivot Points and S/R levels. [ Installation Guide | Update Guide | Troubleshooting | FAQ | All Products ] It plots historical levels for backtesting purposes It allows you to select the reference timeframe It implements different Pivot Point calculation modes It implements different SR calculation modes It implements customizable colors and sizes Calculation Modes The indic
Super Reversal Pattern
Parfait Mujinga Ndalika
Super Reversal Pattern Indicator Unlock the power of advanced pattern recognition with our Super Reversal Pattern Indicator. Designed for traders seeking precision and reliability, this indicator identifies one of the most effective reversal patterns in technical analysis, offering a significant edge in your trading strategy. Key Features: Non-Repainting Accuracy: Enjoy the confidence of non-repainting technology. Once a Super Reversal Pattern is detected, it remains static, providing consis
PZ Chart Overlay
PZ TRADING SLU
5 (1)
图表覆盖 指标在同一张图表上显示几种工具的价格走势,使您能够评估货币对相对彼此波动的差异。 [ 安装指南 | 更新指南 | 故障排除 | 常见问题 | 所有产品 ] 轻松找到超买或超卖的货币对 在同一图表上绘制最多六个货币对 必要时显示倒置符号 适应图表大小,缩放和时间表 自动价格水平计算 可定制的价格水平密度 可自定义的颜色和尺寸 什么是反向货币对? 反转货币对意味着显示两种货币之间的汇率,从而反转交易的主要货币。例如,如果要将EURUSD,GBPUSD和USDJPY绘制到同一覆盖图中,则有必要反转USDJPY以使价格反映反向汇率:JPYUSD。这样,日元/美元价格将与覆盖图的其他两个符号呈正相关关系移动,从而使图表更易于研究。 测试指标 该指标使用来自多个交易品种的价格数据绘制单个图表。由于MetaTrader 4测试仪(在撰写本文时)不支持多货币回溯测试,因此该指标无法回溯测试,因为它将不会收到来自其他本应覆盖的交易品种的报价。要测试它,请租用一个月。 输入 符号设置-键入要在覆盖图上显示的货币对或符号的名称。您需要至少输入其中之一,以便覆盖图具有两个货币对
适用于 MT4 的外汇指标“3 白兵模式” 指标“3 白兵模式”对于价格行为交易非常强大:无需重绘,无延迟; 指标检测图表上的看涨 3 白兵模式:图表上的蓝色箭头信号(见图片) 包括 PC、移动和电子邮件警报 还有它的兄弟 - 看跌“3 黑乌鸦模式”指标可用(点击以下链接) 指标“3 白兵模式”非常适合与支撑/阻力位结合 ................................................................................................................... // 更多优秀的专家顾问和指标可在此处获得: https://www.mql5.com/en/users/def1380/seller 它是仅在此 MQL5 网站上提供的原创产品
KT Renko Patterns MT4
KEENBASE SOFTWARE SOLUTIONS
2.33 (3)
KT Renko Patterns scans the Renko chart brick by brick to find some famous chart patterns that are frequently used by traders across the various financial markets. Compared to the time-based charts, patterns based trading is easier and more evident on Renko charts due to their uncluttered appearance. KT Renko Patterns features multiple Renko patterns, and many of these patterns are extensively explained in the book titled Profitable Trading with Renko Charts by Prashant Shah. A 100% automate
GAS Benefit
Vladimir Pavlov
The indicator is based on the principle of closing the Gap  of the American trading Session ( GAS ). How is the Intersession Gap formed? A time interval is formed between the closing of a trading session and the opening of a new one (the next day) about 15 hours, during this time the price may deviate from the closing price in any direction. It is noticed that such deviations in 95% of cases are temporary and the price returns to the closing point of thesession. What does the indicator do? Th
PZ Penta O MT4
PZ TRADING SLU
The Penta-O is a 6-point retracement harmonacci pattern which usually precedes big market movements. Penta-O patterns can expand and repaint quite a bit. To make things easier this indicator implements a twist: it waits for a donchian breakout in the right direction before signaling the trade. The end result is an otherwise repainting indicator with a very reliable trading signal. The donchian breakout period is entered as an input. [ Installation Guide | Update Guide | Troubleshooting | FAQ | A
The Th3Eng PipFinite indicator is based on a very excellent analysis of the right trend direction with perfect custom algorithms. It show the true direction and the best point to start trading. With StopLoss point and Three Take Profit points. Also it show the right pivot of the price and small points to order to replace the dynamic support and resistance channel, Which surrounds the price. And Finally it draws a very helpful Box on the left side on the chart includes (take profits and Stop loss
Trade with Gann on your side!! MASTER CIRCLE 360 CIRCLE CHART, originally created by Gann admitted that this is “The Mother of all charts”. It is one of the last studies that this great trader left for us. The numeric tab le is apparently quite simple like all the tables and is based on square numbers, the SQUARE OF 12 and is by evolution, one of the most important square numbers. Here we can find CYCLE, PRICE AND TIME thanks to angles and grades, to show past and future support and resistance.
Trend Ray
Andriy Sydoruk
The indicator shows the potential trend direction by cyclical-wave dependence. Thus, all the rays of the intersection will be optimal rays, in the direction of which the price is expected to move, taking into account the indicator period. Rays can be used as a direction for potential market movement. But we must not forget that the approach must be comprehensive, the indicator signals require additional information to enter the market.
斐波那契折返和扩展画线工具 适用于MT4平台的斐波那契折返和扩展画线工具,适合于使用黄金分割交易的交易者 优点:没有多余的线,没有过长的线,易于观察发现交易的机会 试用版: https://www.mql5.com/zh/market/product/35884 主要功能: 1.可以直接画出多组斐波那契折返,可以看出重要折返点之间的关系; 2.可以画出斐波那契扩展,比率有三种0.618,1,1.618 3.画出的斐波那契折返和扩展均可左右移动,有数值显示,方便观察 4.可通过数字键切换周期 使用指南和功能键: 1.按 [ 或R画折返,按需要画折返,最多云持8组折返; 2.按 ] 或E画扩展; 3.按 \ 删除当前周期下的所有扩展和折返,其余周期的不受影响 4.如何左右移动折返和扩展 (1)点击第一组折返的F5字符,可以左右移动折返; (2)点击COP的字符 ,可以左右移动扩展; 5. (1)点击第一组折返的F5字符,按del 可以删除这组折返; (2)点击COP的字符, 按del 可以删除这组扩展; 6.修改折返和扩展(随着市场的运行
The indicator displays the data of the Stochastic oscillator from a higher timeframe on the chart. The main and signal lines are displayed in a separate window. The stepped response is not smoothed. The indicator is useful for practicing "manual" forex trading strategies, which use the data from several screens with different timeframes of a single symbol. The indicator uses the settings that are identical to the standard ones, and a drop-down list for selecting the timeframe. Indicator Parame
我们为您提供一个指标"蜡烛收盘台",它将成为您在贸易领域不可或缺的助手。 这就是为什么知道蜡烛何时关闭会有所帮助的原因: 如果你喜欢使用蜡烛花纹进行交易,你就会知道蜡烛何时关闭。 此指标将允许您检查是否形成了已知模式以及是否存在交易的可能性。 该指标将帮助您做好市场开放和市场关闭的准备。 可以设置一个计时器来创建计划新闻的预览,这样就可以检查市场对此的反应。 您可以设置指示灯,以便在蜡烛关闭前几秒钟发送警报/警告。 通知/警报/警报可以发送到: 屏幕警报 电子邮件 移动应用 MT4烛台计时器指示器为什么有用 那么烛台计时器什么时候有用呢?如果你长期交易,你可能不需要蜡烛计时器指示器,因为你的参赛不会受到一分钟或一小时的太大影响。但是,如果你在短时间内是黄牛或交易员,那么你知道时机非常重要。 外汇市场24小时开放,只在周末关门,有些策略可能会受到您入仓时出现错误时机的严重影响。 MT4蜡烛计时器指示器可以显示当前蜡烛中的剩余时间,以便为下一次蜡烛打开做好准备。 可以从这一指标中受益的一些情况例子有: 预定消息传出 地理市场开闭 预定发生的事件,通常是金融、经济或
Hook Pattern mr
DMITRII GRIDASOV
MT4 外汇指标“钩形模式” 指标“钩形模式”是价格行为交易的非常强大的指标:无需重绘,无延迟; 指标检测图表上的看涨和看跌钩形模式: 看涨钩形 - 图表上的蓝色箭头信号(见图片) 看跌钩形 - 图表上的红色箭头信号(见图片) 包括 PC、移动和电子邮件警报 指标“钩形模式”适合与支撑/阻力位结合使用 ................................................................................................................... // 更多出色的专家顾问和指标可在此处获得: https://www.mql5.com/en/users/def1380/seller 这是仅在此 MQL5 网站上提供的原创产品。
Noize Absorption Index MT4
Ekaterina Saltykova
5 (1)
Noize Absorption Index - is the manual trading system that measures the difference of pressure between bears forces and bulls forces. Green line - is a noize free index that showing curent situation. Zero value of index shows totally choppy/flat market.Values above zero level shows how powerfull bullish wave is and values below zero measures bearish forces.Up arrow appears on bearish market when it's ready to reverse, dn arrow appears on weak bullish market, as a result of reverse expectation. S
该产品的买家也购买
Atomic Analyst
Issam Kassas
5 (2)
首先值得强调的是,该交易指标是非重绘、非延迟的指标,这使其成为手动和机器人交易的理想选择。 用户手册:设置、输入和策略。 Atomic Analyst是一种PA价格行动指标,利用价格的力量和动量来寻找市场上更好的机会。配备了高级过滤器,可帮助去除噪音和假信号,并提高交易潜力。使用多层复杂的指标,Atomic Analyst扫描图表,并将复杂的数学计算转化为任何初学者都能理解并用来做出一致交易决策的简单信号和颜色。 “Atomic Analyst”是专为新手和经验丰富的交易者量身定制的综合交易解决方案。它将高级指标和一流功能融合为一体的交易策略,使其成为所有类型交易者的多功能选择。 日内交易和剥头皮策略:专为快速准确的日内交易和短期交易而设计。 日内和摆动交易策略:可用作追求价格大幅波动的日内和摆动交易者的可靠工具。 多货币和市场:凭借其可靠的精度,在不同的工具和市场上运作。 多个时间框架:可在多个时间框架上使用,性能良好。 稳定性:所有指标均不重绘、不重绘和不滞后,确保可靠的信号。 信号清晰度:提供箭头信号,用于清晰的入场和出场点。 实时警报:通过交易入场、SL和TP警报通知交
Scalper Inside PRO
Alexey Minkov
4.73 (56)
An exclusive indicator that utilizes an innovative algorithm to swiftly and accurately determine the market trend. The indicator automatically calculates opening, closing, and profit levels, providing detailed trading statistics. With these features, you can choose the most appropriate trading instrument for the current market conditions. Additionally, you can easily integrate your own arrow indicators into Scalper Inside Pro to quickly evaluate their statistics and profitability. Scalper Inside
目前八折优惠! 对任何新手或专家交易者来说都是最好的解决方案! 这个仪表板软件适用于28种货币对。它基于我们的两个主要指标(高级货币强度28和高级货币冲动)。它对整个外汇市场提供了一个伟大的概述。它显示高级货币强度值,货币运动速度和28个外汇对在所有(9)时间段的信号。想象一下,当你可以使用图表上的单一指标观察整个市场,以确定趋势和或剥头皮的机会时,你的交易将得到改善 我们已经在这个指标中建立了一些功能,使你更容易识别强势和弱势货币,同时识别和确认潜在的交易。该指标以图形方式显示货币的强势或弱势是增加还是减少,以及它在所有时间段的表现。 增加的新功能是动态市场斐波那契水平,它适应当前的市场条件变化,这是一个已经在我们的高级货币强度28和高级货币冲动指标中使用的成熟的加分项。 在交易时,总是将弱势货币和强势货币配对,这个新指标将帮助你做到这一点。 用户手册:点击这里  https://www.mql5.com/en/blogs/post/708783 特点  显示每个时间段的ACS28和GAP-speed(冲动)的货币强度值。 列:颜色代码以7种颜色
Enigmera
Ivan Stefanov
5 (3)
ENIGMERA:市场核心 https://www.enigmera.com 简介 该指标和交易系统是金融市场的一种非凡方法。ENIGMERA 利用分形周期精确计算支撑位和阻力位。它能显示真实的累积阶段,并给出方向和目标。 该系统无论在趋势中还是在修正中都能发挥作用。 它是如何运行的? ENIGMERA 由三条线组成:支撑/阻力线、目标线和偏离线。与一般市场指标将过去的数据推断为现在和未来的情况不同,该系统能提供当前的完整情况。如果你处于支撑位,这意味着真正的支撑;如果你处于阻力位,这意味着真正的阻力。如果突破某一水平,则表示趋势发生变化。没有重绘。 由于市场在不断变化,ENIGMERA 不断调整其评估工具,定期修改策略。  这保证了每种情况都能得到全面评估。这一市场指标的独特性显而易见,其能力不言而喻。  ENIGMERA 为金融分析师和咨询师提供服务,他们需要可靠的见解与客户分享,也为投资者提供服务,他们需要最精确和最可靠的保证。 该系统能够达到最佳精度,使交易者能够自信、清晰地评估他们的选择。 ENIGMERA 将 20 年的交易专长和知识整合到一个综合软件
TPSproTREND PrO
Roman Podpora
4.79 (19)
TPSpro TREND PRO 是一个趋势指标,可以自动分析市场并提供有关趋势及其每次变化的信息,并给出进入交易的信号而无需重新绘制! 该指标使用每根蜡烛,分别对其进行分析。指不同的脉冲——向上或向下脉冲。货币、加密货币、金属、股票、指数交易的准确切入点! MT5版本                 指标的完整描述   我们建议将其与 指示器 -   RFI LEVELS 一起使用 主要功能: 准确的输入信号,无需渲染! 如果出现信号,它仍然相关!这是与重提指标的一个重要区别,重提指标可以提供信号然后改变信号,这可能导致存款资金的损失。现在您可以以更高的概率和准确度进入市场。还有一个功能是在箭头出现后为蜡烛着色,直到达到目标(止盈)或出现反转信号。 显示止损/获利区域 为了提高搜索切入点时的视觉清晰度,创建了一个模块,该模块最初显示买入/卖出区域,在该区域中搜索进入市场的最佳点。用于处理止损水平的附加智能逻辑有助于随着时间的推移减小其大小,从而降低进入交易(移动 sl)时的初始风险。 显示较高时间范围内的最小值/最大值(MTF 模式) 添加了一项功能,可以显示较高时间间隔的最小
Dynamic Forex28 Navigator - 下一代外汇交易工具。 当前 49% 折扣。 Dynamic Forex28 Navigator 是我们长期流行的指标的演变,将三种功能合二为一: 高级货币强度 28 指标 (695 条评论)+ 高级货币 IMPULSE 带警报 (520 条评论)+ CS28 组合信号(奖励)。 有关指标的详细信息 https://www.mql5.com/en/blogs/post/758844 下一代强度指标提供什么? 您喜欢的原始指标的一切,现在通过新功能和更高的精度进行了增强。 主要特点: 专有货币强度公式。  所有时间范围内的平滑和准确的强度线。 非常适合识别趋势和精确进入。 动态市场斐波那契水平(市场斐波那契)。  此指标独有的独特功能。 斐波那契应用于货币强度,而不是价格图表。 适应实时市场活动以获得准确的反转区域。 实时市场动量。  第 9 行显示市场是活跃还是被动。 对于定时交易至关重要。 全面的警报和显示。  每种货币最强的买入和卖出动量。 ​​28 对的双重动量买入和卖出。 超买/超卖警告外部范围
FX Volume
Daniel Stein
4.58 (33)
通过 mql5 和 Telegram 上 的 " 晨间简报 "获取每日市场更新,包括详细信息和屏幕截图 ! 外汇交易量(FX Volume)是第一个也是唯一一个从经纪商角度真正洞察市场情绪的交易量指标。 直接在您的图表上看到这些信息是真正改变游戏规则和突破性的交易解决方案。 受益于独特的市场数据洞察,如 比率(Ratios )显示货币多头和空头头寸的比率(百分比 比率变化 显示所选时间段内的多头比率及其百分比变化 总交易量 显示货币的总交易量(多头和空头),以手为单位 多头 交易量显示货币所有多头头寸的交易量 空头 交易量显示所有货币空头头寸的交易量 净多头 显示净多头交易量,即所有多头头寸减去所有空头头寸(以手为单位)。 净多头百分比 显示货币净多头交易量的变化 请阅读我们的基本教程 -> "如何使用外汇交易量进行交易 " 获取更多信息,如常见问题、交易技巧和教程视频,请访问我们的 外汇交易量公共信息频道 请 安装并运行 SI Connect 以建立与我们数据中心的持续连接 背景信息 我们都知道,外汇是一个分散的市场。这就是为什么我们必须打破常规思维,开发一个独
TPSpro RFI Levels
Roman Podpora
4.82 (22)
指示       俄罗斯 -        英语   建议 与指示器一起使用     -       TPSpro 趋势专业版 -   MT4版本       交易中的一个关键要素是做出买卖交易工具决定的区域或水平。尽管主要参与者试图隐藏他们在市场中的存在,但他们不可避免地会留下痕迹。我们的任务是学习如何识别这些痕迹并正确解释它们。 主要功能: 向卖家和买家显示活跃区域! 该指标显示所有正确的初始买入和卖出脉冲水平/区域。激活这些水平/区域后,开始寻找切入点,水平会改变颜色并填充特定阴影。此外,还会显示箭头,以便更直观地了解情况。 显示更高时间范围内的级别/区域(MTF 模式) 添加了使用更高时间间隔显示级别/区域的功能。此外,该指标还具有自动趋势检测功能(   TPSproTREND PRO   )。 用于交易的单独专业的逐步算法。 该算法专为日内交易而设计,既可顺势交易,也可逆势交易。每个活动模板均提供详细说明。 适用于多种时间范围 。 TPSpro RFI 水平指标可用于图表上的任何时间范围,从一分钟(M1)开始一直到每月(MN)。 图形和声音警报。 该指标提供图形和声音指示
MetaTrader 4 的 Ultimate Gold Advisor Ultimate Gold Advisor 是一个先进的技术工具,旨在优化 MetaTrader 4 上的交易体验。为了满足经验丰富的交易者的需求,该指标结合了精准度、复杂的分析和多功能性,为做出明智的交易决策提供支持。它不仅适用于黄金交易,还可用于广泛的资产类别,Ultimate Gold Advisor 能帮助你提升市场策略。 Ultimate Gold Advisor 为什么是交易者的好工具? 先进的性能: 结合多个指标,清晰显示每笔交易的结果,你可以透明地查看策略的表现。这让你能够优化你的方法,做出更明智的决策。 即时和可视的交易信号: 图表上的红色和蓝色箭头标记了潜在的买入和卖出机会。 这些视觉信号易于理解,能快速帮助你识别关键行动时刻。 实时点差追踪: Ultimate Gold Advisor 以点数(pips)测量价格变动,让你能够实时评估市场变化。这有助于你更准确地计划交易,并跟踪策略的进展。 趋势检测技术: 指标通过图表上的虚线跟踪主要市场趋势。 这使你能更好地理解市场波动和方向变化,基于市场
M1 Gold
Abdulkarim Karazon
Gold Channel XAUUSD
Paulo Rocha
5 (2)
Gold Channel is a volatility-based indicator, developed with a specific timing algorithm for the XAUUSD pair, which consists of finding possible corrections in the market. This indicator shows two outer lines, an inner line (retracement line) and an arrow sign, where the theory of the channel is to help identify overbought and oversold conditions in the market. The market price will generally fall between the boundaries of the channel. If prices touch or move outside the channel it is a tra
GOLD Impulse with Alert
Bernhard Schweigert
4.56 (9)
这个指标是我们2个产品 Advanced Currency IMPULSE with ALERT  +   Currency Strength Exotics 的一个超级组合。 它适用于所有时间框架,并以图形方式显示8种主要货币和一种符号的强势或弱势冲动! 该指标专门用于显示任何符号的货币强度加速,如黄金、异国货币对、商品、指数或期货。这是它的第一个指标,任何符号都可以被添加到第9行,以显示黄金、白银、石油、DAX、US30、MXN、TRY、CNH等的真实货币强度加速(冲动或速度)。 建立在新的基础算法上,它使识别和确认潜在的交易更加容易。这是因为它以图形方式显示了一种货币的强势或弱势是否正在加速,并测量了这种加速的速度--把它想象成你汽车中的速度表。当你加速时,事情显然会发生得更快,这在外汇市场上也是一样的,即如果你配对的货币正在向相反的方向加速,你就会发现一个潜在的有利可图的交易。 动态市场斐波那契28水平被用作警报触发器,将适应市场活动。如果冲动击中黄色触发线,你将收到警报。然后你就知道作为一个交易员应该做什么。货币对和方向已经给出。只需点击警报按钮,就可以
AW Prime Oscillator
AW Trading Software Limited
5 (1)
两个振荡器的组合。第一个显示入场点,第二个显示当前趋势。该指标可以通过两种模式的箭头显示振荡信号,所有快速振荡信号或仅在当前趋势方向的信号。它具有多时间范围面板和三种类型的信号通知。 好处: 适合当日交易和倒卖交易 趋势过滤 简单而灵敏的设置 多时间框架面板 适合融入顾问。 适用于任何交易品种和任何时间范围 三种类型的通知 MT5 version ->  HERE  / Problem solving ->  HERE 指标策略 该指标由两个不同的振荡器组成: 慢趋势线(粗) - 当指标的最高水平从上到下交叉时,它是下降趋势的指标,当较低的水平水平(指标的低水平)从下到上交叉时,它是下降趋势的指标上升趋势。此外,在较低区域找到一条慢线表明当前趋势是下降趋势,反之亦然,在上方区域找到一条慢线表明当前趋势是上升趋势。这就是该指标确定当前市场趋势的方式。 快速入场线(细):识别从下到上与下线相交处的入场点,这是买入信号,在从上到下穿越上线时,这是卖出信号。除了振荡线之外,调整指标线也很重要,因为这会影响信号的数量和准确性。 本产品使用不同的振荡器来显示慢线和快线,每个振荡器必须单独调整。
Best Currency Strength Indicator
Tumelo Patrick Rakotsoane
4.59 (46)
Advanced Currency Strength Indicator The Advanced Divergence Currency Strength Indicator. Not only it breaks down all 28 forex currency pairs and calculates the strength of individual currencies across all timeframes , but, You'll be analyzing the WHOLE forex market in 1 window (In just 1 minute) . This indicator is very powerful because it reveals the true movements of the market.  It is highly recommended to  analyze charts knowing the performance of individual currencies or the countries ec
Allows multiple indicators to be combined into a single indicator, both visually and in terms of an alert. Indicators can include standard indicators, e.g. RSI, CCI, etc., and also Custom Indicators, even those purchased through Market, or where just have the ex4 file. An early alert is provided, say when 4 out 5 indicators have lined up, and a confirmed alert when all are in agreement. A‌lso features a statistics panel reporting the success of the combined indicator by examining the current cha
TrendfollowerSR
Paul Reymkhe
4.88 (90)
Take Your Trading Experience To the Next Level ! and get the exclusive TFSR-Analyzer for free !    So you have all these outstanding features  on up to 20 symbols and all timeframes in a smart and clear Design. Correct identification of the trends  in stock investments are pivotal and TrendFollowerSR ensures this perspective while displaying the correct trend on multiply timeframes to help you go long way as much as possible. The latest technology of the Indicator enables to track whether if
Shepherd Harmonic Pattern
Abdullah Alrai
4.65 (49)
这个指标将检测手动和自动方法在图表上绘制的谐波模式。 您可以从此链接查看用户手册: 添加您的评论并联系我们以获得它 有一个免费版本可以在mt4上尝试此产品。 您可以使用它来检测Gartley和Nenstar模式: https://www.mql5.com/en/market/product/30181 您可以从以下链接购买完整的MT4版本: https://www.mql5.com/en/market/product/15212 注意 指标具有控制面板,并将保存每个(图表和时间框架)设置。 您可以将其最小化以在图表上获得更多空间,并且如果您更喜欢使用其他分析工具,则可以按关闭按钮隐藏所有指标数据 当您使用此指标并更改设置,添加诸如移动平均线或布林带之类的指标时,此指标将自动保存您的模板编辑,并且您可以随时加载它们。 如果您使用的是Windows 10,请右键单击MetaTrader图标>兼容性>更改高DPI设置>系统(增强)以获得最佳屏幕设置(应在高清设备中完成)。 指标只是谐波交易理论的解释,用于检测图表上的谐波模式。 如果您想学习它,可以搜索Scott Carney的书,名为“Ha
MetaBands M4
Vahidreza Heidar Gholami
5 (2)
MetaBands使用强大且独特的算法绘制通道并检测趋势,以便为交易者提供进出交易的潜在点。它是一个通道指标和强大的趋势指标。它包括不同类型的通道,可以通过使用输入参数简单地合并以创建新通道。MetaBands使用所有类型的警报通知用户市场事件。 功能 支持大多数通道算法 强大的趋势检测算法 能够合并不同类型的通道 多时间帧和多货币(信号矩阵) 所有类型的警报功能(声音、屏幕闪烁、推送通知、电子邮件、弹出窗口、箭头) 它永远不会重绘 趋势检测 MetaBands使用在通道内振荡的蓝色线来检测趋势。当该线遇到通道的上界时,表明开始下跌趋势,当它遇到下界时,表明开始上涨趋势。如果蓝线接近中线,则市场处于整理期。 该指标使用独特的方法来检测趋势。一开始可能看起来有些复杂,但如果您观看视频教程,您就会意识到它是多么强大且易于使用。 入场和出场信号 当趋势变化或价格穿过上下通道时,MetaBands会立即通过不同的方法提醒交易者,这些方法可以在指标设置中启用。 信号矩阵 要监视来自不同时间框架的多个符号并在一个地方查看信号,请单击右上角按钮或按键盘上的M键以打开信号矩阵。该矩阵可以
Royal Scalping Indicator M4
Vahidreza Heidar Gholami
4.17 (6)
Royal Scalping Indicator is an advanced price adaptive indicator designed to generate high-quality trading signals. Built-in multi-timeframe and multi-currency capabilities make it even more powerful to have configurations based on different symbols and timeframes. This indicator is perfect for scalp trades as well as swing trades. Royal Scalping is not just an indicator, but a trading strategy itself. Features Price Adaptive Trend Detector Algorithm Multi-Timeframe and Multi-Currency Trend Low
Currency Strength Exotics
Bernhard Schweigert
4.87 (30)
目前8折优惠! 对任何新手或专家交易者来说都是最好的解决方案! 这个指标是专门用来显示任何符号的货币强度,如异国货币对、商品、指数或期货。它是同类产品中的第一个,任何符号都可以添加到第9行,以显示黄金、白银、石油、DAX、US30、MXN、TRY、CNH等的真实货币强度。这是一个独特的、高质量的、负担得起的交易工具,因为我们已经纳入了一些专有的功能和一个新的公式。想象一下,你的交易将如何改善,因为你能够准确地确定新趋势或剥头皮机会的触发点? 用户手册:点击这里   https://www.mql5.com/en/blogs/post/708876 它适用于所有时间框架。你将很快能够看到TREND! 根据新的基础算法设计,它使识别和确认潜在交易变得更加容易。这是因为它以图形方式显示了8种主要货币和一种符号的强弱。 该指标显示了8种主要货币(澳元加元瑞士法郎欧元英镑日元新西兰美元)的强弱线,再加上一个符号! 该指标显示了符号的真实价值。例如:对于XAUUSD(黄金):价格以美元报价。如果黄金在上涨,你怎么能知道是黄金的强势还是美元的弱势?只有当黄金走强时,我们才会进行
Harmonic Papallons
Ramon Sobrevals Arce
3.33 (3)
Automatically scans the chart to find Harmonic Patterns, and give you the chance to enter early in good operations. Also if selected, it will alert you in advance when future patterns appears, showing you a projection of a posible future pattern. The main goal  for this algorithm is to determine with high precision the moment when a trend ends and a new one begins. Giving  you the best price within a reversal.   We have added the "Golden Trade", we define it as the perfect order: For those orde
All in One Trade
Alexey Minkov
4.48 (27)
The All-in-One Trade Indicator (AOTI) determines daily targets for EURUSD, EURJPY, GBPUSD, USDCHF, EURGBP, EURCAD, EURAUD, AUDJPY, GBPAUD, GBPCAD, GBPCHF, GBPJPY, AUDUSD, and USDJPY. All other modules work with any trading instruments. The indicator includes various features, such as Double Channel trend direction, Price channel, MA Bands, Fibo levels, Climax Bar detection, and others. The AOTI indicator is based on several trading strategies, and created to simplify market analysis. All-in-One
MetaTrend M4
Vahidreza Heidar Gholami
Meta Trend Indicator is an efficient way to forecast and detect the trend in any market. It reveals the trend, support and resistance levels, volatility and the maximum potential target, all in one indicator. To adapt to the price and to decrease consecutive trend failures, the internal trend detector algorithm studies the market and dynamically chooses the right values for the internal parameters. This indicator is a perfect trend filter for any strategy or expert advisor. Features Super Adapti
TrendMaestro
Stefano Frisetti
5 (3)
note: this indicator is for METATRADER4, if you want the version for METATRADER5 this is the link:  https://www.mql5.com/it/market/product/108106 TRENDMAESTRO ver 2.4 TRENDMAESTRO recognizes a new TREND in the bud, he never makes mistakes. The certainty of identifying a new TREND is priceless. DESCRIPTION TRENDMAESTRO identifies a new TREND in the bud, this indicator examines the volatility, volumes and momentum to identify the moment in which there is an explosion of one or more of these data a
Beast Indicator V7
Mohamed Ahmed Sh Muhumed
Step into the future of automated trading with the Beast Indicator V7, The indicator allows you to trade binary options. T his indicator give high winning ratio with over 20 years of backtesting  an unparalleled tool that seamlessly transforms your trading journey into an effortless and lucrative venture. Designed to simplify and optimize the trading process, the Beast Indicator is the ultimate game-changer, offering a hassle-free experience that allows you to set your buy and sell options effo
Supply and Demand Dashboard PRO
Bernhard Schweigert
4.8 (20)
目前八折优惠! 这个仪表板是一个非常强大的软件,可用于多个符号和多达9个时间段。 它是基于我们的主要指标(最佳评论:高级供应需求)。 Advanced Supply Demand 该仪表板提供了一个伟大的概述。它显示。   筛选后的供需值,包括区域强度评级。 区间内和区间外的点位距离。 它突出了嵌套的区域。 在所有(9个)时间段内,它对所选符号发出4种警报。 它是高度可配置的,以满足您的个人需求! 您的利益! 对每个交易者来说,最重要的问题是。 什么是入市的最佳水平? 在强大的供应/需求区域内或附近进入你的交易,以获得最佳的成功机会和风险/回报。 我的止损的最佳位置是哪里? 把你的止损放在强势供应/需求区的下方/上方是最安全的。 我的最佳盈利目标是什么? 你的退出策略和你的进入策略一样重要,了解更高的时间框架图可以帮助你。对于买入,使用下一个供应区作为目标,对于卖出,使用下一个需求区作为目标。在回撤到供应区或需求区时进场,以确保有足够的利润空间,达到更高的时间框架的供应和需求,将增加你的利润。 为什么我们要过滤强区和
Entry Points Pro
Yury Orlov
4.62 (175)
这是一款 MT4 的趋势指标,可提供准确的入场交易信号,且无重绘或延迟。 它可应用在任何金融资产:外汇、加密货币、贵金属、股票、指数。 最好的结果出现在 M15+ 的时间帧内。 指标的 MT5 版本 重要! 购买后请联系我,以便获取详细指南和奖励。 视频 (6:22) - 一个信号赢取的利润等于指标价格的三倍。 视频 (4:44) - 它如何在测试器中工作,我的提示和技巧。 视频 (1:44) - 有关它如何处理加密货币和指数的几句话。 大多数交易者在 Entry Points Pro 指标的帮助下,在第一个交易周内就改善了他们的交易结果。 Entry Points Pro 指标的益处 入场信号无重绘或延迟 如果信号出现,并得到确认(如果信号所在烛条已收盘),则它不会再消失;不像是重绘指标,它会导致重大的财产损失,因为它们可以在显示信号后再将其删除。 无差错开仓 指标算法可令您找到入场交易(买入或卖出资产)的理想时机,从而提高每位交易者的成功率。 Entry Points Pro 可操作任何资产 它允许您在 MT4 平台上交易任何经纪商提供的加密货币、股票、
Gann Signal Scaner
Kirill Borovskii
This indicator is based on the Gann Signal indicator and acts as a market scanner. All you need to do is fill in the selected currency pairs in the settings and that’s it. Next, the indicator itself will view all these currency pairs and time frames from M5 to D1 simultaneously. When a new signal appears, the indicator will give you an Alert and also draw the letter N where this new signal will be.
PTS Precision Index Oscillator V2
PrecisionTradingSystems
5 (1)
精密指数振荡器(Pi-Osc)由Precision Trading Systems的Roger Medcalf开发 版本2经过精心重新编码,以在您的图表上加载速度非常快,还加入了一些其他技术改进,以提高体验。 Pi-Osc旨在提供准确的交易定时信号,旨在找到极端的耗尽点,这些点是市场被迫去触及,以清理每个人的止损单。 该产品解决了一个古老的问题,即知道极端点在哪里,这使得交易员的生活变得更加简单。 这是一个高度复杂的共识指标,与行业标准的振荡器相比,具有一些强大的区别。 它使用的一些特征包括需求指数、资金流动、RSI、随机指标、模式识别、成交量分析、标准偏差极端点以及不同长度上述各种变化的分歧。 乍一看,对于未经培训的人来说,它似乎与任何其他振荡器没有什么不同,但当与其他振荡器(如RSI或动量等)相对比时,这个指标的真正威力开始显现。 据我所知,没有其他振荡器可以频繁地精确指出顶部和底部,具有相同的定期效率。 精密指数振荡器由许多不同的数学方程组成,用于测量多个时间框架采样中的价格和成交量变动,从而高度准确地预测趋势可能发生转折的位置。 PTS P
Quantum Breakout Indicator PRO
Bogdan Ion Puscasu
4.96 (25)
介绍     Quantum Breakout PRO   ,突破性的 MQL5 指标,正在改变您交易突破区域的方式!   Quantum Breakout PRO 由拥有超过 13 年交易经验的经验丰富的交易者团队开发,旨在通过其创新和动态的突破区域策略将您的交易之旅推向新的高度。 量子突破指标将为您提供带有 5 个利润目标区域的突破区域的信号箭头,以及基于突破框的止损建议。 它既适合新手交易者,也适合专业交易者。 量子 EA 通道:       点击这里 MT5版本:   点击这里 重要的!购买后请私信我领取安装手册。 建议: 时间范围:M15 货币对:GBPJPY、EURJPY、USDJPY、NZDUSD、XAUUSD 账户类型:ECN、Raw 或 Razor,点差极低 经纪商时间:GMT +3 经纪商:IC Markets、Pepperstone with Raw 和 Razor 的点差最低 规格: 不重漆! 最多 5 个建议利润目标区域 建议止损水平 可定制的盒子。您可以设置自己的 Box Time Start 和 Box Time E
作者的更多信息
FastBoom
Evgeniy Zhdan
The FastBoom EA finds the most probable points of price pullback/reverse and places an order. It places averaging orders if the price moves further against take profit. Settings of the EA: Lots - initial lot; LotExponent - multiplier for following orders (Martingale). 1 - no multiplier. TakeProfit - take profit in points; Stochastic Settings InpKPeriod - K Period of Stochastic InpDPeriod - D Period of Stochastic InpSlowing - Stochastic Slowing LevHigh - level for sell positions of Stochastic
Buy and sell zones
Evgeniy Zhdan
5 (2)
用於確定平面和趨勢的指標。 如果價格低於兩條直方圖和兩條線(紅色和藍色)中的任何一條,則這是一個賣出區域。 購買此版本的指標時,一個真實賬戶和一個模擬賬戶的 MT4 版本 - 作為禮物(收到,給我寫私信)! 如果價格高於兩條直方圖和兩條線(紅色和藍色)中的任何一條,則這是一個買入區域。 MT4 版本: https://www.mql5.com/en/market/product/3793 如果價格在兩條線之間或在任何直方圖的區域內,那麼市場就沒有明確的趨勢。簡單地說,市場是平的。 指標的工作在屏幕截圖中更清楚地顯示。 該指標可用作獨立的交易系統。該指標可用於獲取領先數據或確定當前趨勢的方向。對於任何級別的交易者來說,這都是一個很好的工具!
SuperTrend
Evgeniy Zhdan
3.33 (3)
The Supertrend Expert Advisor The Supertrend Expert Advisor with averaging elements. It has been developed during three months until I finally got good results. It is not a scalper. The minimum balance to start trading - 100 $. Is automatically adjusted to the 4 and 5-digit prices. Has an efficient risk management system. The lot and limit on the maximum lot is automatically calculated based on the settings specified in the EA. As a result, you have a complete automated trading system. Download
Stardust
Evgeniy Zhdan
StarDust searches for divergences in the values of several indicators considering them as signs of flat and enters the market if a relatively steady trend is detected. The Expert Advisor trades "basic" symbols with a low spread. The best results are achieved on М15. The EA automatically adjusts to 4 and 5-digit quote flows. Settings Comment_to_orders – comment to a placed order. The field can be left blank if no comment is required. MM – enable money management with automatic setting of a work
Top Floor
Evgeniy Zhdan
The EA catches the price when it moves against the trend in an effort to open an order in an opposite direction (direction of the main trend). Screenshots illustrate examples of entries and the strategy gist. The EA uses stop losses depending on values of ATR. Settings: Lot_ - if Risk_ = 0, the EA will trade this lot; Risk_ - risk per one trade. Stop loss is taken into account; koeff_ATR - coefficient multiplied by the ATR value to calculate stop loss (the bigger the value, the bigger stop los
The Expert Advisor calculates the double/triple divergence of volumes, and starts trading. It uses a unique formula of lot calculation, which greatly improves stability of trading. Recommended TF - 1h. Currency pair - EURUSD , but the EA can be used on any trading instruments which are not subject to high volatility. Settings mode - trading direction can be set manually; close - order close level (details on the screenshot); Step between orders - step between orders in points; Maximum orders -
OrderOnLine
Evgeniy Zhdan
The Expert Advisor opens orders from the horizontal line, the a trader can set on any level by dragging using the mouse or by changing the line properties. For example, when a horizontal line is above the current price, the EA will open a Buy order once the horizontal line is reached. And vice versa: If the line is below the current price, the EA will open a sell order once the line is crossed. A buy crossover of the line is: opening of the current candlestick below the horizontal line; the curr
SellerATR
Evgeniy Zhdan
5 (1)
The Expert Advisor only sells. Recommended currency pairs : EURUSD; GBPUSD; USDCHF; USDJPY; USDCAD; AUDUSD; EURGBP; EURAUD; EURCHF; EURJPY; GBPCHF; CADJPY; GBPJPY; AUDNZD; AUDCAD; AUDCHF; AUDJPY; CHFJPY; EURNZD; EURCAD; CADCHF; NZDJPY; NZDUSD. Timeframe: H1. Percent% manages closing both loss-making and profitable deals based on the account overall status. Using the EA on 23 symbols mentioned above allows the robot to cope with the drawdown in case of a long trend. While positions on some pairs
Illusion
Evgeniy Zhdan
3 (2)
The Illusion EA uses the probability theory - after a series of consecutive virtual losses - i.e. right during a flat the EA already starts trading in the trend. In addition, the EA considers the ratio of bullish/bearish candles on the higher timeframes to determine the greatest probability of the price movement direction. Only 1 order can be opened at a time. In case of a loss the following order will be placed with an increased lot (the multiplication coefficient is set in the parameters). The
ChangingTrends
Evgeniy Zhdan
該指標計算最可能的趨勢止損/逆轉區域,有信心的趨勢運動區域。 計算考慮: 價格變動率; 圖表的相對偏差角度; 價格變動的平均幅度; 價格離開“舒適區”; ATR 指標的值。 當價格進入止損/反轉區域時,該指標可以生成警報。 設置 Draw the entire length? - 繪製直到圖表末尾的區域; Show Stop UP-trend - 顯示上升趨勢的停止/反轉區域; Show UP-trend - 顯示上升趨勢的區域; Show DOWN-trend - 顯示有信心的下降趨勢區域; Show Stop DOWN-trend - 顯示下降趨勢的停止/反轉區域; Alert in the area change - 當價格進入趨勢止損/變化區域時生成警報; 接下來是每個交易區域的顏色設置。
Hobo
Evgeniy Zhdan
該指標的主要目標是定義趨勢方向、力量和潛在逆轉,計算每個蠟燭的平方平均價格梯度(高-低)的比率。 根據計算,該指標顯示: 趨勢逆轉; 趨勢方向; 潮流力量。 推薦的時間範圍是 M1 和 M5。 在這種情況下,指標基於 M15 時間框架趨勢方向。 在高於 M5 的時間範圍內工作時,指標在其分析中不使用更高的時間範圍。 當信號相互匹配時,例如: 當前信號:買入; 趨勢力:強; 趨勢方向:向上。 或者 當前信號:賣出; 趨勢力:強; 趨勢方向:向下, 考慮以適當的方向進入市場。 該指標既可以用作獨立的交易系統,也可以用作其他系統的補充。 設置 信息位置——文字連接角度; 信息文本 - 文本顏色; 彈出式聲音警報 - 彈出式信號警報; 電子郵件警報 - 電子郵件信號警報; 推送警報 - 啟用推送通知; Buy Color - 購買箭頭顏色; Sell Color - 出售箭頭顏色; 無趨勢顏色 - 單色。  Gāi zhǐbiāo dì zhǔyào mùbiāo shì dìngyì qūshì fāngxiàng, lìliàng hé qiánzài
GoldenCoast
Evgeniy Zhdan
The indicator plots a trend line and determines the levels for opening trades, in case the price goes "too far" away from the trend level. More detailed information is available in the screenshots. Settings Away from the trend line - distance from the trend line to the trades level; Arrow Signal for deals - enable displaying an arrow when the price reaches the trades level; Size of Arrow - size of the arrow; Alert Signal for deals - enable generating alerts when the price reaches the trades le
Turbina
Evgeniy Zhdan
5 (4)
The axiom of the Forex market is that any trend will be broken. The Expert Advisor determines trend direction (the pink line), and calculates levels for opening opposite orders depending on the settings. The value of Away from the trend line for Deal will be different for each pair and timeframe, depending on the volatility of the trading instrument. Next orders can be opened with an increased lot (a static lot is used by default). See the screenshots to understand the idea of the Expert Advisor
Odysseus
Evgeniy Zhdan
The Expert Advisor determines the moments of strong movements and opens a position in the direction of the most probable price movement. The strategy always uses stop loss and take profit. Several independent orders can be in the market (the maximum number is set in parameters). The goal of the EA's underlying trading system is the quantitative excess of the number of profitable deals over the number of losing ones. Recommended: EURUSD 5m; GBPUSD 5m; USDJPY 5m. The Expert Advisor is able to work
Vise
Evgeniy Zhdan
Vise is a trend indicator. The upper and lower lines follow the price showing the prevailing price direction. Frequent breakthroughs of the upper line indicate a bullish trend, while frequent breakthroughs of the lower line indicate a bearish one. Parameters Points for UpLine - initial number of points for the upper line; Points for DownLine - initial number of points for the lower line. During the breakthrough of the upper level (line), this level shifts upwards by Points for UpLine. If the u
Twinkle
Evgeniy Zhdan
Twinkle is a trend-based scalper using stop loss and take profit invisible to the broker. The EA does not look for trend reversals. The EA catches strong market movements and opens orders in the direction of the trend. Your broker will not see the order closing levels. The EA closes orders independently when reaching the take profit or stop loss levels specified in the settings. Recommended trading symbols: EURUSD M5, GBPUSD M5. ECN accounts with 5 digits quotes are recommended. Expert Advisor
Shine
Evgeniy Zhdan
4.75 (4)
This Expert Advisor implements elements of the Martingale system. Orders are opened at a specified distance from the moving average. The Parabolic SAR indicator and certain technical details are used to ensure the most accurate entries. The EA is highly customizable. It is recommended for simultaneous use on 4 currency pairs: EURUSD M15; GBPUSD M15; USDJPY M15; USDCAD M15. Despite good stability, it is advisable to disable the EA operation during the days rich in news releases. Configurations
SolaceSystem
Evgeniy Zhdan
3 (3)
SolaceSystem is a trend scalper. The Expert Advisor algorithm calculates price consolidation levels and opens trades if a strong market movement is expected. The Parabolic SAR standard indicator is used to filter trade opening. Distinctive features Martingale is not used. Does not accumulate loss. Uses take profit and stop loss. Trades are closed either by TP and SL, or using a unique trailing stop algorithm. Automatic lot calculation. The Expert Advisor is fully ready for long-term automated
LuckyCase
Evgeniy Zhdan
LuckyCase is an Expert Advisor with martingale elements. The EA strategy is based on a significant "deviation" of the price from SAR inadicator and the Bands levels breakthrough point. The money management system is an essential part of the EA. It starts working after a trade is opened. Trades are closed after accumulating specified points of market orders, by deposit % or after an opposite side of the channel is broken through. The default EA settings are meant for: EURUSD M15; USDJPY M15. The
Elize
Evgeniy Zhdan
The Elize Expert Advisor has been designed to work with the EURCHF currency pair. It considers the peculiarities of this trading instrument, its behavior and dependence on the behavior of other currencies. In particular, when the currencies of the European countries (EURUSD, GBPUSD, EURNOK, EURCHF) move in the same direction, the EA starts its operation and opens a deal in the trend direction of the European currencies. In the event of price rollbacks, the EA uses a unique method for making the
FastTraffic
Evgeniy Zhdan
The Expert Advisor has been specifically developed for trading gold (Spot Gold). The strategy is based on Fibo levels calculated from the previous (first) candle High/Low and the width of the current and lower timeframes channel. If important Fibo levels of different orders are located in a single price channel (within a spread), the EA defines this channel as the target for price movement and starts operation. Martingale and averaging are not used. Each order is independent and is accompanied b
Jazz
Evgeniy Zhdan
The algorithm of this Expert Advisor determines the significant price levels, where the trend often turns into a flat or reverses. Stochastic Oscillator serves as an additional filter of overbought/oversold zones. The EA sets stop loss and take profit after opening an order. The underlying trailing strategy applies a trailing stop. The EA is recommended for simultaneously use on three trading instruments: EURUSD M5, GBPUSD M5, EURCHF M5. Settings: Comment to order - comment to orders. MaxRisk -
Panther
Evgeniy Zhdan
The Expert Advisor looks for technical analysis patterns formed on the higher (hourly) timeframe to start working on the 5-minute chart. Technical analysis patterns used: double top/double bottom, head/shoulders, flag, expanding/narrowing triangles. The Relative Vigor Index technical indicator is used as the filter for opening deals. It is based on the idea that on the bull market the closing price is, as a rule, higher, than the opening price. It is the other way round on the bear market. This
Spook
Evgeniy Zhdan
The Expert Advisor calculates the divergence on the current and higher timeframes. In case the divergences coincide, the EA starts its operation. Deals have strict take profit and stop loss levels. Each deal is managed by trailing stop. The strategy involves the use of a tight stop-loss. Therefore, losing deals and/or series of losing deals are not uncommon. This EA is not suitable for those who have difficulties coping with losing deals. The EA is recommended for simultaneous use on the followi
Grand
Evgeniy Zhdan
The Expert Advisor has been developed specifically for the features of the CHFJPY currency pair. The EA's algorithm determines the direction of the current trend and starts operation. In case of a price reversal within the current trend, the EA adds additional orders. If trend changes, the EA starts to work in the direction contrary to the initial grid of orders. If there were no conditions for closing orders and the trend direction changed again, the EA continues to work with the "first" grid o
Intensive
Evgeniy Zhdan
The Expert Advisor algorithm determines on daily charts those candlestick patterns, which set the intraday trading direction. The trading EA determines how long the price is moving in overbought/oversold zones and starts working in the direction of the expected trend movement. Each position is accompanied with a tight stop loss and take profit. Only one active position can be open in the market. The EA was developed and tested using 99% quality quotes. The Expert Advisor has a built-in news filt
Slender
Evgeniy Zhdan
The strategy of this Expert Advisor is based on a hedging system, which implies placing opposite orders. The EA algorithm determines trend beginning and opens a position in the trend direction. In case of a wrong entry, the EA tries to neutralize the drawdown through opposite (hedging) orders at a preset interval (Coefficient of counter orders). Orders are closed when one of the two values ​​is reached - profit in percent or profit in points. The EA does not use lot increase. The EA wast tested
Dreamer
Evgeniy Zhdan
Советник работает по принципу хеджирования с периодическими "перекосами" в сторону трендовых направлений. Направления тренда советник определяет на основании стандартного индикатора Parabolic Stop and Reverse system (SAR). Уникальная стратегия установки балансирующих позиций позволяет избегать больших просадок даже при самых не благоприятных рыночных условиях. Параметры по умолчанию рекомендуется использовать на торговом инструменте: GBPJPY 15m. Разработка и оптимизация параметров производились
Snoot
Evgeniy Zhdan
5 (1)
This Expert Advisor works using a grid in the direction of a trend movement with the step between opened positions defined in the settings. The positions are closed by the total take profit. The Parabolic SAR standard indicator is used to filter order opening, which comes in the MetaTrader 4 package. The EA has been developed and tested using 99,9% quality of quotes. Operation of the EA in real time can be viewed in the signals . The best trading results have been achieved on CHFJPY M15. Setti
Solipsism
Evgeniy Zhdan
The Expert Advisor builds channels based on the data obtained using ATR and MA indicators according to the equations: Upper channel border = MA + ATR * (FIBO); Lower channel border = MA - ATR * (FIBO), where FIBO has the following values: Style of Trade - Aggressive = 1.61852; Style of Trade - Average = 3.26704; Style of Trade - Calm = 4.85556. Trades are opened inside the channel with the intervals defined in the settings. Long and short positions are opened independently. Positions are closed
筛选:
无评论
回复评论