• 概述
  • 评论
  • 评论 (17)
  • 新特性

RenkoCharts

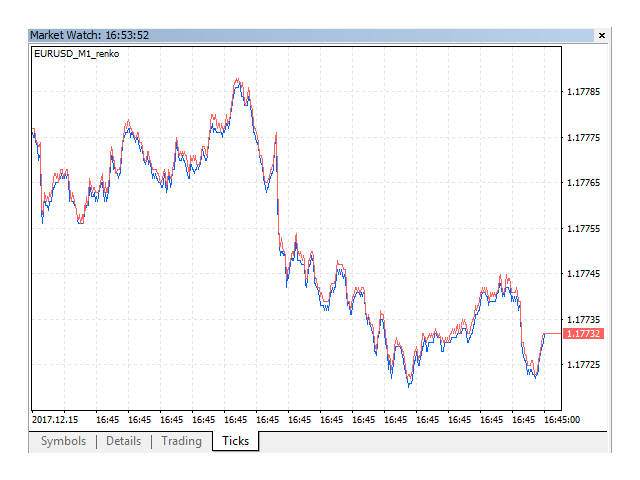
This non-trading expert utilizes so called custom symbols feature (available in MQL as well) to build renko charts based on historical quotes of selected standard symbol and to refresh renko in real-time according to new ticks. Also, it translates real ticks to the renko charts, which allows other EAs and indicators to trade and analyze renko.

Place RenkoCharts on a chart of a work instrument. The lesser timeframe of the source chart is, the more precise resulting renko chart is, but the lesser number of boxes will be generated. This is so because available history is limited by the constant Max bars in chart in the terminal settings. Hence, the same number of bars covers on, e.g. M1 chart 60 times shorter period than on H1 chart. The larger the source timeframe is, the deeper history is used for renko generation, but the lesser quality it has. This reduced accuracy of renko affects only regions, generated from history, but all live changes of quotes (provided RenkoCharts is running) generate absolutely accurate boxes - even more accurate than generated from M1 history.

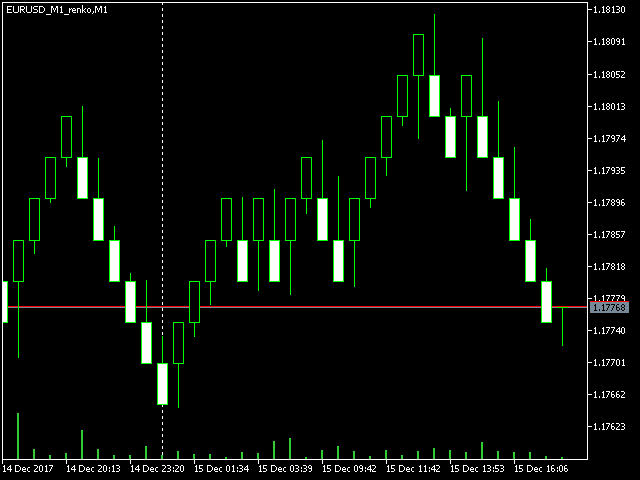
The generated renko chart uses M1 timeframe. The start time of a "minute" bar corresponds to the start time of renko box. The end time of a such "minute" bar is dummy (MetaTrader does not allow for bars with different timespan), instead you should look at start time of the next "minute" bar. It makes no sense to switch the renko chart to a timeframe other than M1.

After its placement on a source chart, RenkoCharts starts to generate missing renko bars for a custom symbol and shows a comment like this:

Processing bar: i / N

where i - number of a current bar being processed on the source timeframe (the numbering goes from maximum to 0), and N - total number of the bars.

When the process is finished, the comment reads like this:

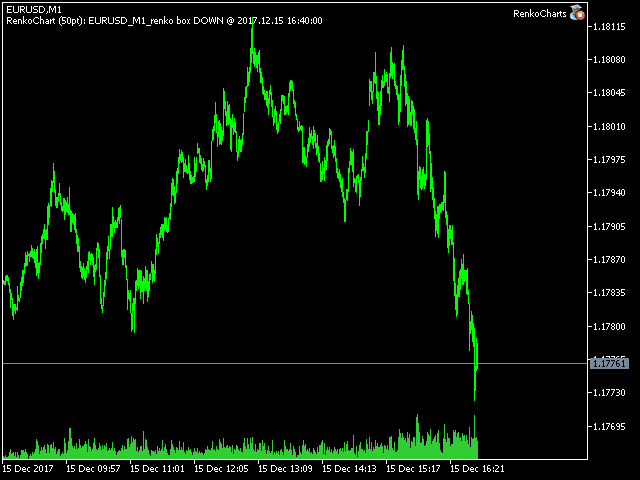
RenkoChart (100pt): open EURUSD_M1_renko / 10000 bars

where 100pt is the renkobox size in points, EURUSD_M1_renko is the custom symbol name (for both see description below), and 10 000 is a total number of generated boxes (if the EA is running the very first time, this is an actual number of renko bars, but if it continues from some previous results, for example, after the terminal restarts, the number of new boxes can be a few, because only most recent, missing boxes are generated).

RenkoCharts opens one renko chart for you, but you can open more.

RenkoCharts generates custom symbol quotes, thus you may open many charts with it and apply different trading EAs and indicators. It makes no sense to run multiple RenkoCharts with the same work symbol/timeframe/renkobox size. It is not allowed to run multiple RenkoCharts with the same custom symbol name.

Due to technical limitations in MetaTrader 5, renko charts can demonstrate strange behavior under some circumstances. You may find details in the Comments section.

RenkoCharts utility does not work in the tester, use demo version for trials.


Parameters

  • RenkoBoxSize - renkobox size in points, by default - 100;
  • ShowWicks - enable/disable wicks on renko, by default - true;
  • EmulateOnLineChart - enable/disable ticks emulation on the renko chart, by default - true; it allows other EAs to trade online from the renko chart;
  • OutputSymbolName - name of the custom symbol for renko, by default - empty string - then the name is formed as "Symbol_Period_Type_Size", where Symbol - current work symbol, Period - current timeframe, Type - "r" (renko) if wicks are enabled or "b" (brick) if disabled, Size - RenkoBoxSize; example: "EURUSD_M15_r100";
  • Reset - an option to enforce complete recalculation of entire renko chart, by default - false; after it is set to true and calculations are completed, it is recommended to reset it back to false in order to eliminate excessive recalculations on every terminal restart; this mode is helpful in rare cases, when generated renko chart contains an error for some reason; normally the option is disabled, because the EA continues calculation smartly from the most recent existing box;
  • Throttle - minimal period in seconds between ticks (by default - 0, throttling is disabled);
  • CloseTimeMode - when true, boxes are shown and formed at M1 close time; in this mode only 1 tick is generated per box, when box is added completely formed to a chart; by default - false, i.e. boxes are created at M1 open time.
推荐产品
趋势捕捉器: 具有警示指标的趋势捕捉器策略是一种多功能的技术分析工具,可帮助交易员识别市场趋势和潜在的进出点。它采用动态趋势捕捉器策略,根据市场条件进行调整,清晰地呈现趋势方向。交易员可以自定义参数,以符合其偏好和风险容忍度。该指标有助于识别趋势,发出潜在的反转信号,充当跟踪止损机制,并提供实时警报,以便及时应对市场。 具有警示指标的趋势捕捉器策略是一种多功能的技术分析工具,可帮助交易员识别市场趋势和潜在的进出点。它采用动态趋势捕捉器策略,根据市场条件进行调整,清晰地呈现趋势方向。交易员可以自定义参数,以符合其偏好和风险容忍度。该指标有助于识别趋势,发出潜在的反转信号,充当跟踪止损机制,并提供实时警报,以便及时应对市场。 特点: 趋势识别:信号牛市趋势和熊市趋势。 趋势反转:当蜡烛颜色从牛市变为熊市,反之亦然时,提醒可能的反转。 实时警报:为新趋势识别生成警报。 建议: 货币和货币对:EURUSD,AUDUSD,XAUUSD... 时间框架:H1。 账户类型:任何ECN,低点差账户。
FREE
Trendline mt5 indicator
David Muriithi
3 (1)
Are you tired of drawing trendlines every time you're analyzing charts? Or perhaps you would like more consistency in your technical analysis. Then this is for you. This indicator will draw trend lines automatically when dropped on a chart. How it works Works similar to standard deviation channel found on mt4 and mt5. It has 2 parameters: 1. Starting Bar 2. Number of bars for calculation The   starting bar   is the bar which drawing of the trend lines will begin, while the   number of bars for c
FREE
Haven FVG Indicator
Maksim Tarutin
5 (1)
Haven FVG   指标是一款市场分析工具,可在图表上突出显示低效区域(公平价值缺口,FVG),为交易者提供关键水平,以便进行价格分析和交易决策。 其他产品 ->  点击这里 主要特点: 自定义颜色设置: 多头 FVG 颜色   (Bullish FVG Color)。 空头 FVG 颜色   (Bearish FVG Color)。 灵活的 FVG 可视化: FVG 搜索的最大蜡烛数量。 FVG 区域可额外延伸指定数量的 K 线。 可选启用 FVG 填充。 中线(Middle Line): 可选择线条颜色和样式(例如虚线)。 可调整线条厚度,以提高精确度。 通用设置: 将 FVG 扩展到当前 K 线。 排除历史 FVG,并填充突出当前数据。 一种简单而有效的方法,可分析图表上的低效区域,并做出明智的交易决策。
FREE
RenkoExpert
Andrey Goida
4 (6)
Renko Expert Advisor based on Renko bar simulation.    The EA has two options for building Renko bars. Classic and ATR. In the classic version, renko bars are marked with areas on the main chart; in the ATR version, renko bars are modeled and drawn in the indicator window. Modeling renko bars inside the EA allows you to optimize the robot better than drawing renko bars offline.      Telegramm channel   Set file Our second robot RENKOTREND Does not use martingale!  Trades opened by the robot com
FREE
Free automatic Fibonacci is an indicator that automatically plots a Fibonacci retracement based on the number of bars you select on the BarsToScan setting in the indicator. The Fibonacci is automatically updated in real time as new highest and lowest values appears amongst the selected bars. You can select which level values to be displayed in the indicator settings. You can also select the color of the levels thus enabling the trader to be able to attach the indicator several times with differe
FREE
LT Rainbow Trend
Thiago Duarte
5 (1)
Do you, like me, like to trade with the trend? Then this indicator will help you! Rainbow Trend is a trend indicator, which uses several Moving Averages on the chart. It measures different trend strenght zones for different periods: very long term, long term, mid term, short term and very short term. Each zone has its color, and it is possible to have sound alert when the prices leaves a zone and enters another. Its configuration is very simple. If you find any bug or have any suggestions, conta
Trading Utility for Forex Currency Pairs Only not for Gold  Functions Auto Lot Calculation based on Risk Auto stoploss  Auto TakeProfit Breakeven Auto Close Half % Close in percentage with respect to the PIPs Pending Orders BuyLimit Sell Limit with distances BuyStop Sell Stop    with distances Trading Informations Risk in percentage For Multiple trades Combine Takeprofit and Combine Stoplosses
Follow The Line MT5
Oliver Gideon Amofa Appiah
4.52 (29)
This indicator obeys the popular maxim that: "THE TREND IS YOUR FRIEND" It paints a GREEN line for BUY and also paints a RED line for SELL. (you can change the colors). It gives alarms and alerts of all kinds. IT DOES NOT REPAINT and can be used for all currency pairs and timeframes. Yes, as easy and simple as that. Even a newbie can use it to make great and reliable trades. NB: For best results, get my other premium indicators for more powerful and reliable signals. Get them here: https://www.m
FREE
True Day
Aurthur Musendame
5 (1)
True Days is a tool designed specifically for the trader who wants to catch intraday volatility in price charts.  True day makes it easier for the trader to avoid trading in the dead zone - a period in time where markets are considered dead or non volatile. The trader can concentrate on finding opportunities only during periods of profound market movements. By default the indicator gives you a true day starting at 02:00 to 19:00 hours GMT+2. You can adjust according to your Time Zone. By deafult
FREE
该指标建立当前报价,可以与历史报价进行比较,并在此基础上进行价格走势预测。指示器有一个文本字段,用于快速导航到所需日期。 选项: 符号 - 选择指标将显示的符号; SymbolPeriod - 选择指标从中获取数据的时段; IndicatorColor - 指示器颜色; HorisontalShift - 由指标绘制的报价移动指定的柱数; Inverse - true 反转引号,false - 原始视图; ChartVerticalShiftStep - 图表垂直移动(键盘上的向上/向下箭头); 接下来是文本字段的设置,您可以在其中输入日期,您可以通过按“回车”立即跳转到该日期。 接下来是文本字段的设置,您可以在其中输入日期,您可以通过按“回车”立即跳转到该日期。
Introducing the Consecutive Green/Red Candle Alert Indicator for MT5 - Your Trend Spotting Companion! Are you ready to take your trading to the next level? We present the Consecutive Green/Red Candle Alert Indicator, a powerful tool designed to help you spot trends and potential reversals with ease. Whether you're a new trader looking for clarity in the market or an experienced pro seeking additional confirmation, this indicator is your trusted companion. Key Features of the Consecutive Green
FREE
GoldTrader
Yashar Seyyedin
Please backtest with the exact balance of your live account before applying to real money. ==> If account balance is too low it may not trade at all! For MT4 version please contact via private message. martingale version is available here . Strategy description - Detect trend based on EMA18-EMA50-SMA200 alignment in three time frames: M15, H1, H4 - Trade in trend direction and exit when above alignment is broken. - The bot is tuned to trade XAUUSD(Gold). - The bot output is break even in rangin
FREE
其中一个数字序列称为“森林火灾序列”。它被公认为最美丽的新序列之一。它的主要特点是该序列避免了线性趋势,即使是最短的趋势。正是这一属性构成了该指标的基础。 在分析金融时间序列时,该指标试图拒绝所有可能的趋势选项。只有当他失败时,他才会认识到趋势的存在并给出适当的信号。这种方法可以让人们正确地确定新趋势开始的时刻。然而,误报也是可能的。为了减少它们的数量,该指标添加了一个额外的过滤器。当新柱打开时会生成信号。在任何情况下都不会发生重绘。 指标参数: Applied Price   - 应用价格常数; Period Main   - 指标的主要周期,其有效值在 5 - 60 之间; Period Additional   - 附加周期,此参数的有效值为 5 - 40; Signal Filter   - 附加信号滤波器,有效值 0 - 99; Alerts   - 启用后,指示器会在出现新信号时提醒您; Send Mail   - 允许指标向电子邮件发送消息; Push   - 允许您发送 Push 消息。
WAPV Box Effort x Result
Eduardo Da Costa Custodio Santos
WA_PV_BOX_EFFORT X MT5 的结果 WAPV Box Effort x Result Indicator 是 Package Indicators 组(Wyckoff Academy Wave Market)的一部分。 MT5 的 WAPV Box Effort x Result Indicator 可帮助您阅读价格和交易量。它的阅读包括协助识别努力x结果 在图表创建的波浪中。 当方框为绿色时,MT5 的 WAPV Box Effort x Result Indicator 表示交易量有利于需求,而当方框为红色时 量有利于供应。 方框越大,成交量相对于价格的位移越大。如果价格的上升波与 Box 的大小不成比例,则 努力x结果。 以一种非常直观的方式,我们可以识别出数量和价格之间的这种差异。 MT5 的 WAPV Box Effort x Result Indicator 还允许您通过将指标置于零轴下方来改善可视化。 以即时交易量和实际交易量在市场上运作 看图片:
Go Long Advanced
Phantom Trading Inc.
5 (3)
Go Long EA实现了基于系统性日间交易原则的高级日内交易策略,具有多重技术确认。虽然许多交易者寻求复杂的算法,但该EA将简单而有效的概念与复杂的风险管理和多重技术过滤器相结合。 该EA每天在特定时间开仓,但仅在市场条件符合多个技术指标时才会执行。这种系统性方法有助于捕捉日内行情,同时避免过夜持仓成本侵蚀利润。EA会在预设时间自动平仓,这对想要避免过夜风险的交易者来说是理想之选。 该EA的特别之处在于其自适应风险管理系统。持仓规模根据多个因素自动调整: - 基础资金和风险百分比设置 - 技术指标条件(均线、RSI、MACD等) - 在条件特别有利时增加持仓规模的特殊乘数 该EA包含多个可启用/禁用的技术过滤器: - 移动平均线(MA)过滤器,带价格关系检查 - RSI超卖条件和乘数 - MACD趋势确认 - ATR波动率过滤器 - 布林带位置验证 - ADX趋势强度确认 - 动量确认 - 随机指标超卖条件 - 一目均衡表云图位置验证 - 摆动模式识别 <资金管理设置> 基础资金:风险计算的基础资金 风险百分比:每笔交易基础资金的风险百分比 获利百分比:止盈距离(0 = 禁
FREE
Rainbow MT5
Jamal El Alama
4 (1)
Description : Rainbow MT5 is a technical indicator based on Moving Average with period 34 and very easy to use. When price crosses above MA and MA changes color to green, then this is a signal to buy. When price crosses below MA and MA changes color to red, then this is a signal to sell. The Expert advisor ( Rainbow EA MT5 ) based on Rainbow MT5 indicator is now available here . MT4 version is available here .
FREE
The Scaled Awesome Oscillator (SAO) represents a refined adaptation of the Awesome Oscillator, aimed at establishing consistent benchmarks for identifying market edges. Unlike the standard Awesome Oscillator, which records the variation in pips across different commodities, the only unchanging reference point is the zero line. This limitation hampers investors and traders from pinpointing specific levels for trend reversals or continuations using the traditional Awesome Indicator, a creation of
FREE
Reversal Candles MT5
Nguyen Thanh Cong
5 (4)
Introduction Reversal Candles is a cutting-edge non-repainting   forex indicator designed to predict price reversals with remarkable accuracy through a sophisticated combination of signals. Signal Buy when the last closed candle has a darker color (customizable) and an up arrow is painted below it Sell when the last closed candle has a darker color (customizable) and a down arrow is painted above it
FREE
Order Book, known also as Market Book, market depth, Level 2, - is a dynamically updated table with current volumes of orders to buy and to sell specific financial instument at price levels near Bid and Ask. MetaTrader 5 provides the means for receiving market book from your broker, but in real time only, without access to its history. The indicator OrderBook Cumulative Indicator accumulates market book data online and visualizes them on the chart. In addition, the indicator can show the market
Point Black
Ignacio Agustin Mene Franco
Black Card Pack indicator 5/1 point black It has the strategy of professional bollingers where each arrow gives you a different entry signal. It is used to operate in m1 and in d1 It is used for scalping and intraday, modified for forex markets ! suitable for all pairs modified for synthetic index markets suitable for all pairs! Ideal for volatility and jumps!
Discover the power of automated trading with **SimpleTradeGioeste**, an Expert Advisor (EA) designed to optimize your trading operations in the Forex market. This innovative EA combines advanced trading strategies with proven technical indicators, offering an unparalleled trading experience. video backtest :  https://youtu.be/OPqqIbu8d3k?si=xkMX6vwOdfmfsE-A ****Strengths**** - **Multi-Indicator Strategy**: SimpleTradeGioeste employs an integrated approach that combines four main technical ind
FREE
High Low Open Close
Alexandre Borela
4.98 (43)
如果你象这个项目一样,就有5个饥饿审查。 这项指标采用了既定价格的公开、高、低价和关闭价格 可以对特定时间区加以调整。 许多机构和专业人士都认为这些是重要的。 贸易商可以为你了解他们可能更进一步的地点, 积极。 现有期间为: 前一日。 前一星期。 曾任Month。 曾任。 前一年。 或: 目前日。 目前周。 目前 Month。 目前配额。 今年。
FREE
Noize Absorption Index
Ekaterina Saltykova
Noize Absorption Index - is the manual trading system that measures the difference of pressure between bears forces and bulls forces. Green line - is a noize free index that showing curent situation. Zero value of index shows totally choppy/flat market.Values above zero level shows how powerfull bullish wave is and values below zero measures bearish forces.Up arrow appears on bearish market when it's ready to reverse, dn arrow appears on weak bullish market, as a result of reverse expectation.
BoxFibo MT5
Sergei Kiriakov
It is just an alternative fibo lines. mt4 have is a very strange drawing of fibo lines, this utilites was written for mt4, but for mt5 it may not be particularly useful. A simple Box (Rectangle) graphic element with adjustable levels binding: it is possible to specify up to 17 custom levels, all rectangles on the chart with the given prefix in their name are processed. Levels are specified in % of the height of the rectangle. A convenient graphical element for analyzing charts by growth-correct
FREE
Reversal Composite Candles
MetaQuotes Ltd.
3.57 (14)
该系统的思路是通过计算复合蜡烛来识别反转形态。 反转形态类似日本蜡烛条分析的 "锤头" 和 "吊颈" 形态。但它使用符合蜡烛替代单一的蜡烛,并且不需要复合蜡烛的小实体来确认反转。 输入参数: Range - 最大柱线数量, 计算复合蜡烛时用。 Minimum - 最小复合蜡烛大小 (传统的点数)。 ShadowBig and ShadowSmall - 影线 (复合蜡烛单元)。 Limit, StopLoss and TakeProfit - 开盘价, 止损位和止盈位, 它们是相对于复合蜡烛的收盘价 (复合蜡烛单元)。 Expiration - 订单过期时间 (单位柱线), 用于挂单 (Limit!=0.0)。 反向蜡烛条形态的判别如下。 它计算复合蜡烛参数,其自最后的完整柱线 (索引为 1) 至由 Range 输入参数定义的柱线数量。如果复合蜡烛大小大于由 Minimum 输入参数指定的数值, 它分析复合蜡烛的影线检测反转条件。 空头能量的特征是复合蜡烛的上影线为零, 多头能量的特征是复合蜡烛的下影线为零。 为确认空头趋势反转 (且多头开始),需要以下检查: 下影线的大小 (多头能量
FREE
中文 (Chinese) 适用于MetaTrader 5 (MT5)的虫洞时间框架指标 不仅仅是另一个交易工具——它是您在金融市场中的竞争优势。专为新手和专业交易者设计,虫洞指标彻底改变了您分析数据和决策的方式,确保您始终领先一步。 为什么您需要虫洞指标 领先竞争对手: 同时在同一图表上查看两个时间框架的能力,让您始终比他人快一步。再也不用在不同图表之间切换,您需要的一切尽在眼前。 发掘隐藏的机会: 改变传统时间框架,发现其他交易者错过的模式。想象一下,您的H1图表在1:59 PM而非2:00 PM关闭,这让您在市场反应之前采取行动。或者调整5分钟图表的边界,从00:01到00:06分析蜡烛,而不是标准的00:00到00:05。这些微妙的变化可以揭示独特的市场动态。 获取可操作的见解: 借助检测趋势、反转和支撑/阻力水平的精密工具,虫洞为您提供自信交易所需的知识。 经验证的创新 虫洞指标并非基于猜测,而是尖端研究的成果: 利用机器学习分析市场低效性。 识别零售交易的集群以揭示隐藏的市场动态。 这些见解推动了一个结合专业级策略的指标开发。 虫洞如何赋能您 更快决策: 实时数据让您始终领先
FREE
Time Segmented Volume for MT5
Fernando Carreiro
5 (1)
(谷歌翻译) 该指标基于 Worden Brothers, Inc 开发的原始“ Time Segmented Volume (TSV) ”。 但是,我为此添加了一些额外的功能。 可以选择要应用的价格,而不是仅使用原始默认收盘价。 您还可以选择使用哪种交易量加权,包括基于真实范围的伪交易量,或根本不使用交易量加权。 (谷歌翻譯) 該指標基於 Worden Brothers, Inc 開發的原始“ Time Segmented Volume (TSV) ”。 但是,我為此添加了一些額外的功能。 可以選擇要應用的價格,而不是僅使用原始默認收盤價。 您還可以選擇使用哪種交易量加權,包括基於真實範圍的偽交易量,或根本不使用交易量加權。 (Original text) This indicator is based on the original “ Time Segmented Volume (TSV) ” developed by Worden Brothers, Inc . However, I added an extra few features to this one. One ca
FREE
Pattern 123 MT5
Pavel Verveyko
"Pattern 123" is an indicator-a trading system built on a popular pattern, pattern 123. This is the moment when we expect a reversal on the older trend and enter the continuation of the small trend, its 3rd impulse. The indicator displays signals and markings on an open chart. You can enable/disable graphical constructions in the settings. The indicator has a built-in notification system   (email, mobile terminal, standard terminal alert). "Pattern 123" has a table that displays signals from se
Your Trend Friend
Luigi Nunes Labigalini
5 (1)
The trend is your friend! Look at the color of the indicator and trade on that direction. It does not  repaint. After each candle is closed, that's the color of the trend. You can focus on shorter faster trends or major trends, just test what's most suitable for the symbol and timeframe you trade. Simply change the "Length" parameter and the indicator will automatically adapt. You can also change the color, thickness and style of the lines. Download and give it a try! There are big movements w
该产品的买家也购买
Trade Assistant MT5
Evgeniy Kravchenko
4.41 (177)
它有助于计算每笔交易的风险,容易安装新的订单,具有部分关闭功能的订单管理, 7 种类型的追踪止损和其他有用的功能。   附加材料和说明 安装说明   -   应用程序说明   -   模拟账户应用程序的试用版 线条功能  - 在图表上显示开仓线、止损线、止盈线。 有了这个功能,就可以很容易地设置一个新的订单,并在开仓前看到它的附加特性。   风险管理  - 风险计算功能在考虑到设定的风险和止损单的大小的情况下,计算新订单的成交量。它允许你设置任何大小的止损,同时观察设定的风险。 批量计算按钮 - 启用 / 禁用风险计算。 在 " 风险 " 一栏中设置必要的风险值,从 0 到 100 的百分比或存款的货币。 在 " 设置 " 选项卡上选择风险计算的变量: $ 货币, % 余额, % 资产, % 自由保证金, % 自定义, %AB 前一天, %AB 前一周, %AB 前一个月。   R/TP 和 R/SL - 设置止盈和止损的关系。 这允许你设置相对于损失的利润大小。 例如, 1 : 1 - 这决定了 TP = SL 的大小。 2 : 1 - 这意味着 TP 是 SL 的两倍。 RR -
欢迎来到 Trade Manager EA——这是一个终极风险管理工具,旨在使交易变得更直观、精准和高效。它不仅仅是一个下单工具,而是一个用于无缝交易计划、仓位管理和风险控制的全面解决方案。不论您是新手交易员、资深交易员,还是需要快速执行的剥头皮交易员,Trade Manager EA 都可以满足您的需求,适用于外汇、指数、大宗商品、加密货币等各种市场。 借助 Trade Manager EA,复杂的计算已成过去。只需分析市场,在图表上用水平线标记入场、止损和止盈,设置您的风险水平,Trade Manager 就会立即计算出理想的头寸规模,并实时显示以点、账户货币计价的止损和止盈。每笔交易都得以轻松管理。 主要功能: 头寸规模计算器 :根据定义的风险瞬间确定交易规模。 简单的交易计划 :在图表上用可拖动的水平线直接计划交易,设置入场、止损和止盈。 实时显示 SL 和 TP :以账户货币、点或分显示止损和止盈,便于分析。 高级保护工具 盈亏平衡选项 : 基本盈亏平衡 :当您的交易达到设定水平时自动保护利润。 多级盈亏平衡 :设置多达 4 个级别以逐步保护利润。 尾随止损选项 : 基本尾随
Local Trade Copier EA MT5
Juvenille Emperor Limited
4.98 (84)
通过 Local Trade Copier EA MT5 获得非常快速的交易复制体验。它的简单1分钟设置,使您可以在同一台Windows计算机或Windows VPS上在多个MetaTrader终端之间复制交易,具有闪电般快速的复制速度,低于0.5秒。 无论您是初学者还是专业交易者, Local Trade Copier EA MT5 都提供了广泛的选项,可根据您的特定需求进行自定义。对于任何希望增加利润潜力的人来说,这都是终极解决方案。 今天就尝试一下,看看为什么它是市场上最快、最简单的贸易复印机! 提示: 您可以在您的模拟账户中下载并试用 Local Trade Copier EA MT5 模拟版: 这里 将下载的免费演示文件粘贴到您的 MT5 >> 文件 >> 打开数据文件夹 >> MQL5 >> 专家文件夹并重新启动您的终端。  免费演示版本每次可在 4 小时内发挥全部功能,仅限演示帐户。 要重置试用期,请转至 MT5 >> 工具 >> 全局变量 >> Control + A >> 删除。 请仅在非关键模拟账户上执行此操作,不要在挑战道具公司账户中执行此操作。 Local
TradePanel MT5
Alfiya Fazylova
4.85 (125)
交易面板是一个多功能的交易助手。该应用程序包含超过 50 个用于手动交易的交易功能,并允许您自动化大多数交易操作。 注意,该应用程序在策略测试器中不起作用。购买之前,您可以在模拟帐户上测试演示版本。演示版 这里 。 完整说明 这里 。 贸易. 让您只需单击一下即可执行交易操作: 开立挂单和仓位并自动计算风险。 只需单击鼠标即可打开多个订单和仓位。 打开订单网格。 只需单击一下即可对多个符号打开订单和持仓。 按组关闭挂单和仓位。 仓位反转(平掉买入 > 开仓卖出,平掉卖出 > 开仓买入)。 锁仓(通过以缺失手数开仓,使买入和卖出手数相同)。 单击即可部分关闭所有仓位。 以相同的价格水平设置所有仓位的获利和止损。 将所有仓位的止损设置为仓位的盈亏平衡水平。 当开设挂单和仓位时,可以应用以下函数: 在多个订单或仓位之间分配计算出的交易量(当单击打开多个订单和仓位时)。 在开单过程中,图表上交易水平的可视化。 仅当当前价差不超过指定价差时才开仓。 获利与止损之间的自动比率。 虚拟止损和止盈。 根据当前价差的大小自动增加止损和获利。 根据 ATR 指标读数计算获利和止损。 设置挂单的到期日期。
Trade Dashboard MT5
Fatemeh Ameri
4.97 (70)
疲于复杂的订单下达和手动计算?Trade Dashboard 是您的解决方案。凭借其用户友好的界面,订单下达变得轻而易举,只需点击一下,您就可以开设交易、设置止损和止盈水平、管理交易手数,并计算风险回报比,让您只需专注于您的策略。告别手动计算,使用 Trade Dashboard 简化您的交易体验。 立即下载演示版本 。 您可以在这里找到仪表盘功能和特性的详细信息 。 加入 Telegram 频道 。 购买后请给我发消息以获取支持。如果您需要添加更多功能,可以在产品的评论区留下您的想法,我愿意听取任何建议,希望您能在使用我的产品时获得最佳体验 。 这是 MT4 版本。 风险管理:使用 Trade Dashboard,可以将您的风险设置为账户余额或权益的百分比,或将风险设置为总金额。在图表上直观地定义您的止损,让工具准确计算每个货币对的适当手数。该工具还可以根据您期望的风险回报比自动设置止盈水平。它甚至可以在手数计算中涵盖佣金和点差费用。此外,您的止损和止盈可以转变为虚拟水平,隐藏于经纪商。通过 Trade Dashboard 的高级风险管理功能,掌控风险,保护您的资本。 交易线
Grid Manual MT5
Alfiya Fazylova
4.89 (18)
Grid Manual是一个交易面板,用于处理订单网格。 该实用程序是通用的,具有灵活的设置和直观的界面。 它不仅可以在亏损方向上设置订单网格,还可以在盈利方向上设置订单网格。 交易者不需要创建和维护订单网格,实用程序会这样做。 打开一个订单就足够了,Grid manual会自动为它创建一个订单网格,并伴随它直到非常关闭。 完整说明和演示版 此處 。 该实用程序的主要特性和功能: 伴隨以任何方式打開的訂單,包括從移動終端打開的訂單。 適用於兩種類型的網格:“限制”和“停止”。 使用兩種方法計算網格間距:固定和動態(基於 ATR 指標)。 允許您更改未結訂單網格的設置。 顯示圖表上每個網格的盈虧平衡水平。 顯示每個網格的利潤率。 允許您一鍵關閉網格中的盈利訂單。 讓您一鍵關閉每個訂單網格。 允許您對訂單網格應用追踪止損功能。 允許您在訂單網格上應用將訂單網格的止損轉移到盈虧平衡水平的功能。 相對於訂單網格的盈虧平衡水平自動重新排列止盈(僅在限價網格模式下,距離取決於所選的計算類型:“保守”或“激進”)。 最多可管理 20 個訂單網格,每個網格最多可包含 100 個訂單。 計算初始手數時,
The product will copy all telegram signal to MT5 ( which you are member) , also it can work as remote copier.  Easy to set up, copy order instant, can work with almost signal formats, image signal,  s upport to translate other language to English Work with all type of channel or group, even channel have "Restrict Saving Content", work with  multi channel, multi MT5 Work as remote copier: with signal have ticket number, it will copy exactly via ticket number. Support to backtest signal. How to s
Cerberus Equity Watcher
Samuel Bandi Roccatello
5 (3)
Cerberus the Equity Watcher 是一种风险管理工具,可以持续监控您的账户资产并避免因错误的 EA 或您的情绪行为(如果您是全权交易者)导致的重大亏损。对于依赖 EA 的系统交易者来说,它非常有用,EA 可能包含错误,或者在意外的市场条件下可能表现不佳。 Cerberus 允许您设置最小净值和(可选)最大值,如果达到其中任何一个,则所有头寸都被平仓,所有挂单被关闭,所有 EA 被“杀死”。在展平所有位置后,将向用户手机发送通知,并在屏幕上显示一条清晰的消息。在“扁平化”之后, Cerberus 继续关注股权价值,并继续扼杀任何进一步的交易尝试,直到它被重新初始化。 Cerberus 执行的任何操作都清楚地显示在屏幕上,报告在“专家顾问”选项卡上,并向用户发送通知。为了避免用户错误,对用户输入的输入值和自动交易的当前状态进行了多次检查。 ****** 特征 最小和最大权益值可以以账户货币或初始权益的百分比设置 最大净值是可选的 如果达到最小/最大净值,则所有 EA 将独立于它们交易的符号被终止 第一次压扁后几秒钟进行双重检查 Cerberus 在拉平后也继续监控股权
MT5 to Telegram Signal Provider 是一个易于使用且完全可自定义的工具,它允许向 Telegram 的聊天室、频道或群组发送 指定 的信号,将您的账户变为一个 信号提供商 。 与大多数竞争产品不同,它不使用 DLL 导入。 [ 演示 ] [ 手册 ] [ MT4 版本 ] [ Discord 版本 ] [ Telegram 频道 ] 设置 提供了逐步的 用户指南 。 不需要了解 Telegram API;开发者提供了您所需的一切。 关键特性 能够自定义发送给订阅者的订单详情 您可以创建分层的订阅模型,例如铜、银、金。其中金订阅获得所有信号等。 通过 id、符号或评论过滤订单 包括执行订单的图表截图 在发送的截图上绘制已关闭的订单,以便额外核实 延迟发送新订单消息的可能性,以便在发送前对位置进行调整 订单详情完全透明: 新的市场订单*带截图 订单修改(止损、获利) 已关闭的订单*带截图 部分关闭的订单** 新的挂单 修改的挂单(进场价格) 挂单激活(作为新的市场订单附加) 已删除的挂单 历史订单报告*** 可自定义的评论 注意: * 发送截图时,您图
Exp COPYLOT CLIENT for MT5
Vladislav Andruschenko
3.9 (31)
MT5 交易复印机是 МetaТrader 5 平台的交易复印机 。 它复制外汇交易 之间   任何账户 MT5   -   MT5, MT4   -   MT5 对于 COPYLOT MT5 版本(或 MT4   - MT4 MT5   -   MT4 对于 COPYLOT MT4 版本) 值得信赖的复印机! MT4版本 详细描述   +DEMO +PDF 如何购买 如何安装     如何获取日志文件     如何测试和优化     Expforex 的所有产品 您还可以在 МТ4 终端 (   МТ4   -   МТ4, МТ5   -   МТ4   ) 中 复制交易: COPYLOT CLIENT for MT4 此版本包括在终端 МТ5   -   МТ5, МТ4   -   МТ5 之间 。 交易复制器用于在 2/3/10 终端之间复制交易/头寸。 支持从模拟账户和投资账户复制。 该程序可以在多个终端绑定上运行。 使用它作为您在一个账户上交易的各种投资者账户的交易的同步器, - COPYLOT 会将您的交易复制到其他终端。 从 多个 终端复制到一个; 从一个终端复
RiskGuard Management
MONTORIO MICHELE
5 (19)
注意:该智能交易系统无法在策略测试器中运行。若需试用版本,请访问我的个人资料。 用户手册 要下载自动日志,请访问我的个人资料 RiskGuard Management – 专业交易,无需妥协 RiskGuard Management 是每位希望通过高级风险管理实现利润最大化、亏损最小化的交易者的终极助手。它不仅仅是一个工具,更是一个智能系统,帮助你严格执行交易计划,避免情绪化错误,以最高效率进行操作。 全面资金保护 动态计算手数的高级风险管理 自动平仓功能,确保遵守每日交易计划 Quantum 技术优化每一笔交易的风险 专业级分析和报告,包含数据导出与自动日志功能 Quantum:改变游戏规则的创新功能 Quantum 是一项革命性功能,通过分析你的交易数据和当前回撤,为每笔交易计算最优风险。效果如何?在相同回撤条件下,利润最多可提升至传统风险管理的 4 倍。 不再是固定风险,而是智能风险。Quantum 会根据你的交易风格自动调整,始终为你提供最佳设置。 高级功能,打造可控且安全的交易体验 自动手数计算 — 设置百分比或固定金额的风险,RiskGuard 自动帮你计算 止损锁定
Trade Manager DaneTrades
Levi Dane Benjamin
4.58 (24)
交易管理器可帮助您快速进入和退出交易,同时自动计算风险。 包括帮助您防止过度交易、报复性交易和情绪化交易的功能。 交易可以自动管理,账户绩效指标可以在图表中可视化。 这些功能使该面板成为所有手动交易者的理想选择,并有助于增强 MetaTrader 5 平台。多语言支持。 MT4版本  |  用户指南+演示 交易经理在策略测试器中不起作用。 如需演示,请参阅用户指南 风险管理 根据%或$自动调整风险 可选择使用固定手数或根据交易量和点自动计算手数 使用 RR、点数或价格设置盈亏平衡止损 追踪止损设置 最大每日损失百分比,在达到目标时自动平仓所有交易。 保护账户免遭过多提款并阻止您过度交易 最大每日损失(以美元为单位)在达到目标时自动关闭所有交易。 保护账户免遭过多提款并阻止您过度交易 一键实现所有交易的盈亏平衡 自动计算从手机/电话发送的交易的风险 OCO 在设置中可用 交易和头寸管理 通过设置每月、每周、每天、每小时或每分钟的最大交易次数,停止过度交易和报复性交易。 高级挂单管理。 调整何时关闭挂单的规则 追踪挂单 支持市价订单和挂单 每日最大利润目标(以美元为单位)以确保头寸并停止
Custom Alerts:同时监控多重市场,绝不错过任何关键机会 概述 Custom Alerts 为需要在多个交易品种间集中跟踪潜在信号的交易者提供了动态解决方案。通过整合 FX Power、FX Volume 和 IX Power 等旗舰工具的数据, Custom Alerts 会在您无需频繁切换图表或担心错失良机的情况下,自动通知您各种关键市场变化。如果您想使交易更加智能和高效, Custom Alerts 将大幅提升您的市场监控能力。 1. 为什么 Custom Alerts 对交易者非常有价值 全方位市场监控 • Custom Alerts 汇聚多种交易品种的信号,包括八大主要货币、黄金,及您可选择的最多七种指数或商品。 • 无需在多个图表间来回切换——只需接收集中且清晰的通知即可。 量身定制的警报策略 • 精准配置警报参数,无论您追踪的是成交量飙升、货币强度阈值,还是特定的价格形态, Custom Alerts 都能确保您不错过关键信号。 • 与 Stein Investments 的其他工具无缝整合,进一步提高您的交易精度。 省时且便捷 • 无需时刻盯盘,
-25% discount ($149 -> $111) Everything for chart Technical Analysis indicator mt5 in one tool Draw your supply demand zone with rectangle and support resistance with trendline and get alerts to mobile phone or email alert -  Risk reward indicator mt5 Video tutorials, manuals, DEMO download   here .   Find contacts on my   profile . 1.   Extended rectangles and trendlines Object will be extended to the right edge of the chart when price will draw new candles on chart. This is rectangle extende
Telegram To MT5 Receiver
Levi Dane Benjamin
4.82 (11)
将信号从您所属的任何渠道(包括私人和受限渠道)直接复制到您的 MT5。 该工具在设计时充分考虑了用户的需求,同时提供了管理和监控交易所需的许多功能。 该产品采用易于使用且具有视觉吸引力的图形界面。 自定义您的设置并在几分钟内开始使用该产品! 用户指南 + 演示  |   MT4版本  |   不和谐版本 如果您想尝试演示,请参阅用户指南。 Telegram To MT5 接收器在策略测试器中不起作用! Telegram 至 MT5 功能 一次复制多个通道的信号 从私人和受限频道复制信号 不需要机器人令牌或聊天 ID(如果出于某种原因需要,您仍然可以使用这些) 使用风险百分比或固定手数进行交易 排除特定符号 选择复制所有信号或自定义要复制的信号 配置单词和短语以识别所有信号(默认值应适用于 99% 的信号提供商) 配置时间和日期设置以仅在需要时复制信号 设置一次打开的最大交易量 交易和头寸管理 使用信号或自动设置的管理 通过设置每月、每周、每天、每小时或每分钟的最大交易次数,停止过度交易和报复性交易。 支持市价订单和挂单 每日最大利润目标(以美元为单位)以确保头寸并停止过度交易 确
Trade Assistant 38 in 1
Makarii Gubaydullin
4.9 (21)
多功能工具:超过65个功能,其中包括:手数计算,价格行为,盈亏比,交易管理,供需区域。 演示版   |   用户手册   |  MT4版 任何问题 / 改进意见 / 如果发生了故障或错误    都可以联系我 该实用程序在策略测试器中不起作用:您可以在此处下载 演示版来测 试产品。 交易功能需要允许自动交易(包括经纪商方面) 简化,加快并且自动化你的交易过程。利用这款工具的控制功能就能增强普通交易端的执行力。 建立一笔新的交易:手数 / 风险 / 盈亏计算 1. 手数计算工具 (基于风险规模的交易量计算) 2. 风险计算工具 (基于手数大小的风险额计算) 3. 盈亏比 4. 订单的激活和触发,买入或卖出限价/买入或卖出止损 5. 虚拟的止损/止盈 (隐藏的止损,止盈:交易商不可见) 6.  智能的止损/入场点:当价格柱在收盘时已超越了才入场 (避免无效触发) 7. 隐藏掉挂单 (虚拟的订单) 8. 预订挂单:在市场关闭的时候你也可以下挂单 (适合周末做计划的交易者) 9. 额外的多级止盈 (一笔订单同时有多个止盈) 10. OCO(二择一委托)订单,拥有不同的订单号 11. 在图表上
HINN Lazy Trader
ALGOFLOW OÜ
5 (2)
Community, update news, feature discussions, complaints, suggestions, and first-line support are organized in a free Discord server . Use   Webmoney  to pay in crypto. Lazy Trader is your personal risk management assistant that independently finds the best market entries, manages positions, and helps you extract maximum profit from every trading idea! It monitors charts from M1 to W1 , finds optimal entry points based on your parameters, and manages trades without your involvement: -   Got a
Risk Manager for MT5
Sergey Batudayev
4.56 (16)
MT5 的 Expert Advisor 风险管理器是一个非常重要的程序,我认为对每个交易者来说都是必要的程序。 使用此 EA 交易,您将能够控制您交易账户中的风险。风险和利润控制可以以货币形式和百分比形式进行。 要让智能交易系统工作,只需将其附加到货币对图表并以存款货币或当前余额的百分比设置可接受的风险值。 PROMO BUY 1 GET 2 FREE -   https://www.mql5.com/en/blogs/post/754725 顾问功能 该风险经理将帮助您控制风险: - 交易 - 每天 - 一个星期 - 一个月 你也可以控制 1) 交易时允许的最大手数 2) 每天最大订单数 3) 每天最大利润 4) 设置 Equity 的获利了结 不仅如此,如果您在设置中指定自动设置,顾问还可以为您设置默认的止损和止盈。 顾问会在每个事件中附上警报,并向您解释删除订单的原因。比如你开了,你开了第6个订单,按照你的规则你每天只允许开5个订单,顾问会立即删除6个并说明原因。 例如,您开仓的手数比您最初向自己指示的手数大,顾问将删除订单并解释原因。例如,您每天赚取 5
Didi Alert Needle Detector
Alexandre Tadeu Molina
5 (7)
EA DIDI Alert - 来自“ATM Systems”的检针器 您是否正在寻找一种工具来帮助您利用金融市场上的最佳交易机会? 那么您需要知道,ATM Systems 的 DIDI Alert - Agulhadas Detector 是市场上唯一通过 DIDI INDEX 使用 Didi Aguiar 强大的 Needles Setup 交易策略的顾问,它拥有多种可用资源,与任何其他专用于此策略的顾问不同。如此完整、功能和实用!它可以识别需求、趋势和布林线开口,当检测到“完全需要”时,它会发出声音警报,包括通过推送通知和电子邮件,以及直观的图形仪表板,以快速、轻松地可视化分析结果。 DIDI Alert 采用最先进的人工智能开发,优化和完善了每一行代码,以确保最大的性能和准确性。此外,DIDI Alert 在上线全球最大、最值得信赖的交易社区 MQL5.COM 平台之前,还经过了数月的严格测试。 DIDI Alert 与市场上的大多数资产兼容,只要它们有足够的运动量,不会显示重复的蜡烛(请参阅添加图像中的示例)。 想象一下顾问 - DIDI ALERT 可以同时以图形方式分
DrawDown Limiter
Haidar, Lionel Haj Ali
5 (20)
Drawdown Limiter EA You are in the right place if you were searching for Drawdown control, Drawdown limiter, Balance protection, Equity Protection or Daily Drawdown Limit related to Prop Firm, FTMO, or Funded account trading, or if you want to protect your trading account. Have you suffered from controlling your drawdown when trading funded accounts? This EA is meant for you. Prop firms usually set a rule called “Trader Daily Drawdown”, and if it is not respected, you are disqualified.  I am an
2025 happy new year -25% discount ($199 -> $149) Advanced trading tool: One click smart orders that execute under your conditions Developed by trader for trading community:  position size calculator (lot size), open position after price action, strategy builder, set and forget trading, mobile notifications... Risk Management -  Risk percentage position size calculator, gain percentage, target risk reward ratio, spread and commissions are included in calculations 7 Advanced order types  - Set a
The News Filter MT5
Leolouiski Gan
4.76 (17)
这个产品在新闻时间过滤所有的专家顾问和手动图表,因此您不必担心突然的价格波动会破坏您的手动交易设置或其他专家顾问输入的交易。此产品还带有完整的订单管理系统,可在任何新闻发布前处理您的持仓和挂单。一旦您购买了   The News Filter ,您将不再需要依赖以后的专家顾问内置的新闻过滤器,因为这个产品可以从此过滤它们所有。 新闻选择 新闻来源于Forex Factory的经济日历。 选择可以基于任何一种货币,如USD,EUR,GBP,JPY,AUD,CAD,CHF,NZD和CNY等。 选择也可以基于关键识别,例如Non-Farm (NFP),FOMC,CPI等。 能够选择新闻影响级别的筛选,从低、中、到高影响。 自动模式只选择与图表相关的新闻。 新闻来源每小时自动刷新,以确保最新的新闻数据。 为每个新闻影响级别提供单独的输入,以确定您要过滤掉的新闻发布前后的分钟数。 订单管理选项 在新闻发布前关闭未平仓头寸的选项,并在新闻发布后恢复它们。 在新闻发布前删除挂单的选项,并在新闻发布后恢复它们。 在新闻发布前移除止损和止盈水平的选项,并在新闻发布后恢复它们。 在新闻发布前移动止损和
交易面板一键交易。 处理仓位和订单! 通过 图表 或 键盘 进行交易 。 使用我们的交易面板,您只需单击一下即可直接从图表中执行交易,执行交易操作的速度比使用标准 MetaTrader 控件快 30 倍。 参数和函数的自动计算使交易者的交易更加快捷、方便。 图形提示、信息标签和有关贸易交易的完整信息均位于图表 MetaTrader 上。 MT4版本 详细描述   +DEMO +PDF 如何购买 如何安装     如何获取日志文件     如何测试和优化     Expforex 的所有产品 打开和关闭、反转和锁定、部分关闭/Autolot。虚拟/真实止损/止盈/追踪止损/盈亏平衡,订单网格... МetaТrader 5 中主要订单的交易控制面板 :买入、卖出、buystop、buylimit、sellstop、selllimit、平仓、删除、修改、追踪止损、止损、获利。 有 5 个选项卡 可用:头寸、挂单、账户信息、信号和总利润。 Description on English VirtualTradePad在“  MQL5语言最佳图形面板  ”竞赛中 获得二等奖 。 注意!如果
Layer Master:MT5 专业网格交易工具 使用 Layer Master 改变您的网格交易 - 专为专业交易者设计的最直观、最强大的订单管理工具包。 MT4   Version:  https://www.mql5.com/en/market/product/79133 精准掌握网格交易 Layer Master 彻底改变了您下达和管理网格交易的方式。借助我们的可视化界面,您可以: 立即部署数百个订单 轻松管理多个头寸 精准控制风险 实时监控性能 核心功能 高级订单管理 Layer Master 工具箱可帮助交易者一键部署多个订单。它可以让您绘制可视化区域图,以便精确下达网格订单。 Layer Master 支持所有订单类型(买入/卖出止损、买入/卖出限价),并通过提供实时价格水平和点差显示帮助您了解您的仓位 专业风险管理 我们通过可视化止损和获利管理、一键盈亏平衡功能、总风险计算、目标利润监控和批量仓位修改执行(更改止损、获利甚至部分退出)帮助交易管理风险。 实时交易信息 作为网格交易者,我们明白了解关键交易指标至关重要。因此,我们向您展示:总仓位和交易量
Auto Trade Copier 被设计成多的MT5账户/端子,绝对精度之间复制交易。 有了这个工具,你可以充当要么提供商(源)或接收(目的地) 。每一个交易行为将由提供商克隆到接收器,没有延迟。 以下是亮点功能:     在一个工具提供商或接收器之间转换角色。     一个供应商可以交易复制到多个接收者的账户。     绝对兼容MT5的顺序/位置管理规则,该规则允许与调整容积为每个符号只有一个位置。     自动识别和同步代理之间的符号后缀。     允许高达5特殊符号的设置(即: GOLD - > XAUUSD ,等等) 。     多lotsize设置选项。     允许过滤的订单类型将被复制。     关断端子或电源关闭后恢复以前的设置和状态。     实时控制面板。     使用方便,界面友好。 用法: - 安装工具提供的MT5终端,并选择角色“提供者” ,然后启用它。 - 安装工具接收的MT5终端,并选择角色的“接收器” ,输入提供商的帐号,然后启用它(你可以有很多接收者的帐户,只要你想) 。 设置和参数:      特殊符号设置(菜单) : 配置高达5对特殊
Seconds Chart MT5
Boris Sedov
4.56 (16)
秒级图表 (Seconds Chart) — 一款专为 MetaTrader 5 设计的独特工具,用于创建秒级时间框架的图表。 通过 秒级图表 ,您可以构建以秒为单位的时间框架图表,获得标准分钟或小时图表无法提供的极致灵活性和分析精度。例如,时间框架 S15 表示每根蜡烛图持续15秒。您可以使用任何指标、智能交易系统和脚本,操作方式与标准图表同样便捷。 与标准工具不同, 秒级图表 让您能够在超短时间框架下进行高精度交易,无延迟干扰。 秒级图表的优势 支持 1至900秒 的时间框架图表。 基于内置的实时报价数据库, 即时加载 历史数据。 数据实时更新, 无延迟或滞后 。 可同时创建 多个秒级图表 。 秒级图表的理想应用场景 剥头皮交易 和高频交易。 精确的入场和出场时机。 在短时间框架下测试交易策略。 时间框架设置 默认设置包含以下时间框架: S1、S2、S3、S4、S5、S6、S10、S12、S15、S20、S30 。 您可轻松自定义时间框架组合,只需按升序列出 1至900秒 的数值且避免重复即可。 其他免费工具 快速交易管理器 ( Quick Trade Manager ) — 专为
Ultimate Trailing Stop EA MT5
BLAKE STEVEN RODGER
4.13 (8)
This EA Utility allows you to manage (with advanced filtering) unlimited open orders (manual or EA) with 16 trailing stop methods: fixed, percent, ATR Exit, Chandelier Exit, Moving Average, Candle High Low Exit, Bollinger Bands, Parabolic, Envelope, Fractal, Ichimoku Kijun-Sen, Alligator, Exit After X Minutes or Bars, RSI and Stochastic. The trailing stop can be either real or virtual, and you can exit fully or with a partial close percent on touch or bar close.  Moreover, you can add (override
立即在一張圖表上查看按日和按週的已平倉交易歷史記錄、當前未平倉交易以及外匯風險敞口!使用熱圖來識別有利可圖的交易以及您交易組合中的當前虧損情況。 快速關閉按鈕 使用快速關閉按鈕可以關閉單一符號的每筆交易、全部關閉單筆交易,或點擊按鈕以取得部分利潤或損失。不再需要在清單中尋找交易並研究如何關閉部分交易。儀表板還會顯示您在交易外匯對時目前對每種貨幣符號的風險敞口,這可以幫助您識別重大新聞事件發生前可能過度暴露的領域。您可以使用按鈕在新聞發布前立即快速降低您的風險,或者如果新聞已經發生並為您帶來利潤,只需單擊即可快速獲得該利潤! 開放交易熱圖 交易熱圖是一種視覺化工具,專為使用頭寸交易或波段交易策略的交易者設計,使用美元成本平均法來擴大和縮小交易規模。您可以快速識別您的投資組合中可以存入的單一交易,以及您可以部分平倉的虧損交易。只需使用全部或部分關閉按鈕即可立即賺錢並降低風險。 快速識別控制回撤的機會 虧損控制切換「D 按鈕」將突出顯示您的投資組合中所有虧損高於每個交易符號平均價格的交易。這是透過在所有符號的單一交易周圍添加一個矩形來實現的,這樣您就可以看到首先要關注哪些交易。 這使
MT5 To Notion
Levi Dane Benjamin
5 (3)
该程序将允许您使用非常友好的用户界面将所有交易从 MetaTrader 帐户直接导出到 Notion。 MT4版本  |   用户指南+演示 要开始使用,请使用用户指南并下载概念模板。 如果您想要演示,请参阅用户指南。 在策略测试器中不起作用! 主要特点 将所有交易从您的交易账户导出到您的 Notion 将运行交易和挂单导出到 Notion 并更新它们 创建模板 最后一日出口贸易 上周出口贸易 上个月出口贸易 从自定义时间范围导出交易 自动将所有新的已平仓交易发送至 Notion 选择要包含在导出中的字段,例如订单类型、数量、开仓时间、平仓时间等 如何开始 转到上面的用户指南或启动 EA 并单击“获取连接帮助” 连接后,单击“开始:导出全部”将历史记录中的所有当前交易发送到 Notion 如果您希望它自动将所有新的已平仓交易发送到 Notion,请选中“更新新已平仓交易” 如果您有任何问题,请告诉我。 随着产品的开发,将添加新功能。
YuClusters
Yury Kulikov
4.93 (41)
Attention: You can view the program operation in the free version  YuClusters DEMO .  YuClusters is a professional market analysis system. The trader has unique opportunities to analyze the flow of orders, trade volumes, price movements using various charts, profiles, indicators, and graphical objects. YuClusters operates on data based on Time&Sales or ticks information, depending on what is available in the quotes of a financial instrument. YuClusters allows you to build graphs by combining da
作者的更多信息
WalkForwardOptimizer MT5
Stanislav Korotky
3.63 (8)
WalkForwardOptimizer library allows you to perform rolling and cluster walk-forward optimization of expert advisers (EA) in MetaTrader 5. To use the library include its header file WalkForwardOptimizer.mqh into your EA source code, add call provided functions as appropriate. Once the library is embedded into EA, you may start optimization according to the procedure described in the User guide . When it's finished, intermediate results are saved into a CSV file and some special global variables.
RenkoFromRealTicks
Stanislav Korotky
4.5 (2)
This non-trading expert utilizes so called custom symbols feature ( available in MQL API as well) to build renko charts based on history of real ticks of selected standard symbol. RenkoFromRealTicks generates custom symbol quotes, thus you may open many charts to apply different EAs and indicators to the renko. It also transmits real ticks to update renko charts in real time. The generated renko chart uses M1 timeframe. It makes no sense to switch the renko chart to a timeframe other than M1. T
AutomaticZigZag
Stanislav Korotky
4.5 (2)
This is a non-parametric ZigZag providing 4 different methods of calculation. Upward edge continues on new bars while their `highs` are above highest `low` among previous bars, downward edge continues on next bars while their `lows` are below lowest `high` among previous; Gann swing: upward edge continues while `highs` and `lows` are higher than on the left adjacent bar, downward edge continues while `highs` and `lows` are lower than on the left adjacent bar. Inside bars (with lower `high` and
FREE
SuperIndices MT5
Stanislav Korotky
5 (1)
This cluster indicator is MT5 version of SuperIndices for MT4. It allows for processing mixed clusters, where symbols from various markets can be included. For example, it can handle Forex, indices, CFDs, spot at the same time. Number of visible lines increased to 16. An interactive ruler can be enabled to measure signals' strength on the history. The indicator creates a set of embedded cluster indicators (CCFpExtraIndices) with carefully selected periods and combines their results using smart w
CustomVolumeDelta
Stanislav Korotky
5 (1)
This indicator displays volume delta (of either tick volume or real volume) encoded in a custom symbol, generated by special expert advisers, such as RenkoFromRealTicks . MetaTrader does not allow negative values in the volumes, this is why we need to encode deltas in a special way, and then use CustomVolumeDelta indicator to decode and display the deltas. This indicator is applicable only for custom instruments generated in appropriate way (with signed volumes encoded). It makes no sense to ap
FREE
This non-trading expert utilizes so called custom symbols feature ( available in MQL API as well) to build custom charts based on history of real ticks of selected standard symbol. New charts imitate one of well-known graphic structures: Point-And-Figure (PnF) or Kagi. The result is not exactly PnF's X/O columns or rectangular waves of Kagi. Instead it consists of bars, calculated from and denoting stable unidirectional price moves (as multiples of the box size), which is equivalent to XO colum
Order Book, known also as Market Book, market depth, Level 2, - is a dynamically updated table with current volumes of orders to buy and to sell specific financial instument at price levels near Bid and Ask. MetaTrader 5 provides the means for receiving market book from your broker, but in real time only, without access to its history. This expert adviser OrderBook History Playback allows you to playback the market book events on the history using files, created by OrderBook Recorder . The exper
FREE
This is a demo version of a non-trading expert , which utilizes so called the custom symbols feature ( available in MQL as well ) to build renko charts based on historical quotes of selected standard symbol and to refresh renko in real-time according to new ticks. Also it translates real ticks to the renko charts, which allows other EAs and indicators to trade and analyze renko. Place the EA on a chart of a working instrument. The lesser timeframe of the source chart is, the more precise resulti
FREE
This script allows performing a walk-forward analysis of trading experts based on the data collected by the WalkForwardLight MT5 library. The script builds a cluster walk forward report and rolling walk forward reports that refine it, in the form of a single HTML page. This script is optional, as the library automatically generates the report immediate after the optimization in the tester is complete. However, the script is convenient because it allows using the same collected data to rebuild th
FREE
Order Book, known also as Market Book, market depth, Level 2, - is a dynamically updated table with current volumes of orders to buy and to sell specific financial instument at price levels near Bid and Ask. MetaTrader 5 provides the means for receiving market book from your broker in real time. The expert OrderBook Recorder records market book changes and stores them in local files for further usage in indicators and expert adviser, including testing in the tester. The expert stores market book
FREE
OrderBook Utilities is a script, which performs several service operations on order book hob-files, created by OrderBook Recorder . The script processes a file for work symbol of the current chart. The file date is selected by means of the input parameter CustomDate (if it's filled in) or by the point where the script is dropped on the chart. Depending from the operation, useful information is written into the log, and optionally new file is created. The operation is selected by the input parame
FREE
Comparator
Stanislav Korotky
4.75 (4)
This indicator compares the price changes during the specified period for the current symbol and other reference symbol. It allows to analyze the similar movements of highly correlated symbols, such as XAUUSD and XAGUSD, and find their occasional convergences and divergences for trading opportunities. The indicator displays the following buffers: light-green thick line - price changes of the current symbol for TimeGap bars; light-blue thin line - price changes of the reference symbol ( LeadSymbo
FREE
PointsVsBars
Stanislav Korotky
This indicator provides a statistical analysis of price changes (in points) versus time delta (in bars). It calculates a matrix of full statistics about price changes during different time periods, and displays either distribution of returns in points for requested bar delta, or distribution of time deltas in bars for requested return. Please, note, that the indicator values are always a number of times corresponding price change vs bar delta occurred in history. Parameters: HistoryDepth - numbe
FREE
HZZM
Stanislav Korotky
4 (1)
This is an adaptive ZigZag based on modification of  HZZ indicator (original source code is available in this article ). Most important changes in this version: two additional indicator buffers added for zigzag evolution monitoring - they show cross signs at points where zigzag direction first changes; zigzag range (H) autodetection on day by day basis; time-dependent adjustment of zigzag range. Parameters: H - zigzag range in points; this parameter is similar to original HZZ, but it can take 0
FREE
WalkForwardDemo MT5
Stanislav Korotky
WalkForwardDemo is an expert adviser (EA) demonstrating how the built-in library WalkForwardOptimizer (WFO) for walk-forward optimization works. It allows you to easily optimize, view and analyze your EA performance and robustness in unknown trading conditions of future. You may find more details about walk-forward optimization in Wikipedia . Once you have performed optimization using WFO, the library generates special global variables (saved in an "archived" file with GVF-extension) and a CSV-f
FREE
Order Book, known also as Market Book, market depth, Level 2, - is a dynamically updated table with current volumes of orders to buy and to sell specific financial instument at price levels near Bid and Ask. MetaTrader 5 provides the means for receiving market book from your broker, but in real time only, without access to its history. The indicator OrderBook Cumulative Indicator accumulates market book data online and visualizes them on the chart. In addition, the indicator can show the market
Year2Year
Stanislav Korotky
This indicator shows price changes for the same days in past years. D1 timeframe is required. This is a predictor indicator that finds D1 bars for the same days in past 8 years and shows their relative price changes on the current chart. Parameters: LookForward - number of days (bars) to show "future" price changes; default is 5; Offset - number of days (bars) to shift back in history; default is 0; ShowAverage - mode switch; true - show mean value for all 8 years and deviation bounds; false - s
FREE
ReturnAutoScale
Stanislav Korotky
5 (2)
The indicator calculates running total of linear weighted returns. It transforms rates into integrated and difference-stationary time series with distinctive buy and sell zones. Buy zones are shown in blue, sell zones in red. Parameters: period - number of bars to use for linear weighted calculation; default value - 96; smoothing - period for EMA; default value - 5; mode - an integer value for choosing calculation mode: 0 - long term trading; 1 - medium term trading; 2 - short term trading; defa
FREE
SOMFX1Builder
Stanislav Korotky
5 (1)
If you like trading by candle patterns and want to reinforce this approach by modern technologies, this script is for you. In fact, it is a part of a toolbox, that includes a neural network engine implementing Self-Organizing Map (SOM) for candle patterns recognition, prediction, and provides you with an option to explore input and resulting data. The toolbox contains: SOMFX1Builder  - this script for training neural networks; it builds a file with generalized data about most characteristic pric
FREE
Mirror
Stanislav Korotky
This indicator predicts rate changes based on the chart display principle. It uses the idea that the price fluctuations consist of "action" and "reaction" phases, and the "reaction" is comparable and similar to the "action", so mirroring can be used to predict it. The indicator has three parameters: predict - the number of bars for prediction (24 by default); depth - the number of past bars that will be used as mirror points; for all depth mirroring points an MA is calculated and drawn on the ch
If you like trading crosses (such as AUDJPY, CADJPY, EURCHF, and similar), you should take into account what happens with major currencies (especially, USD and EUR) against the work pair: for example, while trading AUDJPY, important levels from AUDUSD and USDJPY may have an implicit effect. This indicator allows you to view hidden levels, calculated from the major rates. It finds nearest extremums in major quotes for specified history depth, which most likely form resistence or support levels, a
EvoLevels
Stanislav Korotky
The indicator displays most prominent price levels and their changes in history. It dynamically detects regions where price movements form attractors and shows up to 8 of them. The attractors can serve as resistance or support levels and outer bounds for rates. Parameters: WindowSize - number of bars in the sliding window which is used for detection of attractors; default is 100; MaxBar - number of bars to process (for performance optimization); default is 1000; when the indicator is called from
ExtraMovingPivots
Stanislav Korotky
This is an intraday indicator that uses conventional formulae for daily and weekly levels of pivot, resistance and support, but updates them dynamically bar by bar. It answers the question how pivot levels would behave if every bar were considered as the last bar of a day. At every point in time, it takes N latest bars into consideration, where N is either the number of bars in a day (round the clock, i.e. in 24h) or the number of bars in a week - for daily and weekly levels correspondingly. So,
Most of traders use resistance and support levels for trading, and many people draw these levels as lines that go through extremums on a chart. When someone does this manually, he normally does this his own way, and every trader finds different lines as important. How can one be sure that his vision is correct? This indicator helps to solve this problem. It builds a complete set of virtual lines of resistance and support around current price and calculates density function for spatial distributi
The indicator draws a histogram of important levels for several major currencies attached to the current cross rates. It is intended for using on charts of crosses. It displays a histogram calculated from levels of nearest extremums of related major currencies. For example, hidden levels for AUDJPY can be detected by analyzing extremums of AUD and JPY rates against USD, EUR, GBP, and CHF. All instruments built from these currencies must be available on the client. This is an extended version of
StatBars
Stanislav Korotky
The indicator provides a statistic histogram of estimated price movements for intraday bars. It builds a histogram of average price movements for every intraday bar in history, separately for each day of week. Bars with movements above standard deviation or with higher percentage of buys than sells, or vice versa, can be used as direct trading signals. The indicator looks up current symbol history and sums up returns on every single intraday bar on a specific day of week. For example, if current
PriceProbability
Stanislav Korotky
This is an easy to use signal indicator which shows and alerts probability measures for buys and sells in near future. It is based on statistical data gathered on existing history and takes into account all observed price changes versus corresponding bar intervals in the past. The statistical calculations use the same matrix as another related indicator - PointsVsBars. Once the indicator is placed on a chart, it shows 2 labels with current estimation of signal probability and alerts when signal
CCFpExtra
Stanislav Korotky
CCFpExtra is an extended version of the classic cluster indicator - CCFp. This is the MT4 version of indicator  CCFpExt available for MT5. Despite the fact that MT5 version was published first, it is MT4 version which was initially developed and tested, long before MT4 market was launched. Main Features Arbitrary groups of tickers or currencies are supported: can be Forex, CFDs, futures, spot, indices; Time alignment of bars for different symbols with proper handling of possibly missing bars, in
PriceProbabilities
Stanislav Korotky
This is a signal indicator for automatic trading which shows probability measures for buys and sells for each bar. It is based on statistical data gathered on existing history and takes into account all observed price changes versus corresponding bar intervals in the past. The core of the indicator is the same as in PriceProbablility indicator intended for manual trading. Unlike PriceProbability this indicator should be called from MQL4 Expert Advisors or used for history visual analysis. The in
FreqoMeterForecast
Stanislav Korotky
The main idea of this indicator is rates analysis and prediction by Fourier transform. Indicator decomposes exchange rates into main harmonics and calculates their product in future. You may use the indicator as a standalone product, but for better prediction accuracy there is another related indicator - FreqoMaster - which uses FreqoMeterForecast as a backend engine and combines several instances of FreqoMeterForecast for different frequency bands. Parameters: iPeriod - number of bars in the ma
筛选:
无评论
回复评论
版本 1.4 2019.09.13
Minor bugfixes and improvements.
版本 1.3 2018.07.11
Fixed an error leading to propagation of renko boxes.
版本 1.2 2018.06.19
Minor bugfixes and improvements.