PZ Lopez Impulse MT5
- 指标
- PZ TRADING SLU
- 版本: 1.2
- 更新: 20 八月 2019
- 激活: 20
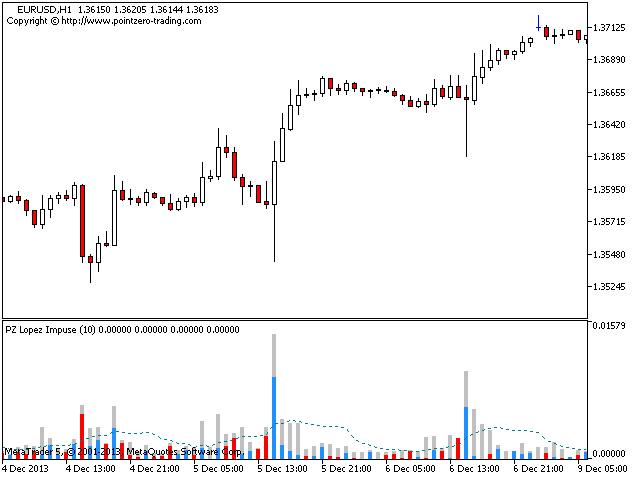
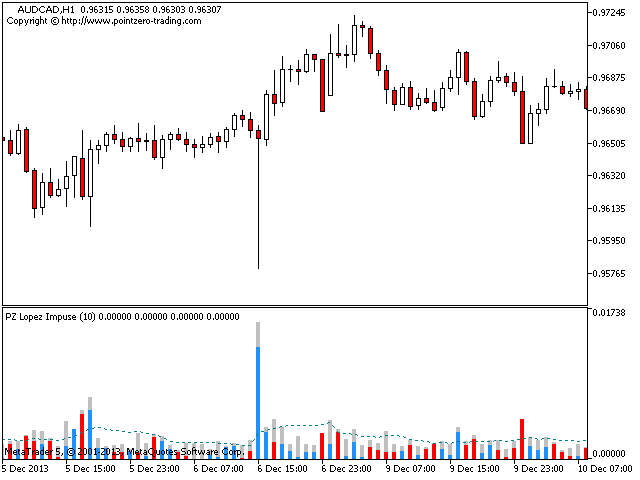
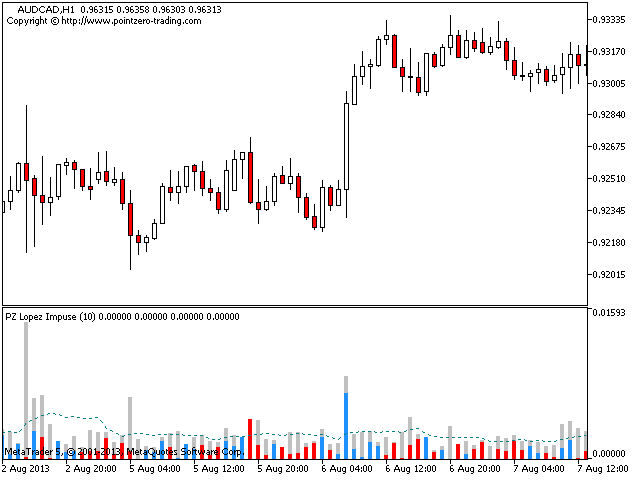
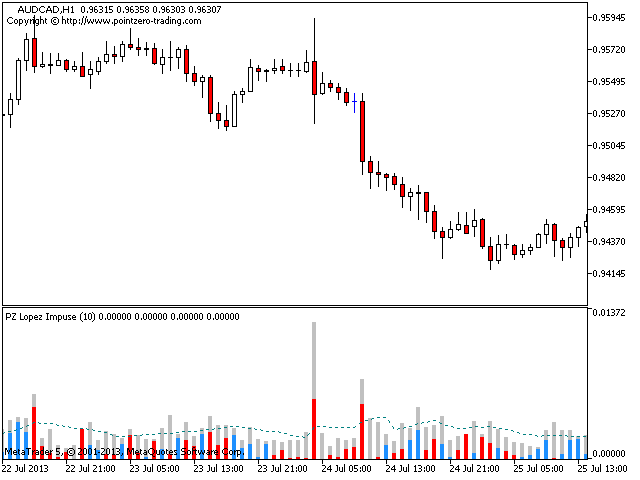
该指标同时评估波动率和价格方向性,从而发现以下事件。
[ 安装指南 | 更新指南 | 故障排除 | 常见问题 | 所有产品 ]
- 决定性和突然的价格变动
- 大锤子/流星图案
- 大多数市场参与者都支持强劲的突破
- 犹豫不决但动荡的市场形势
这是一个非常易于使用的指标...
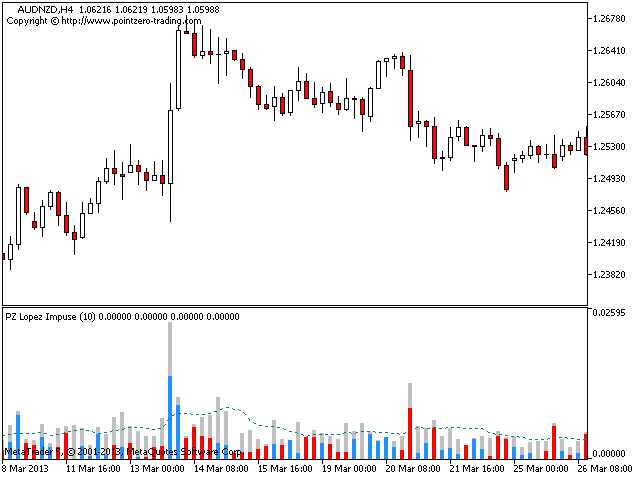
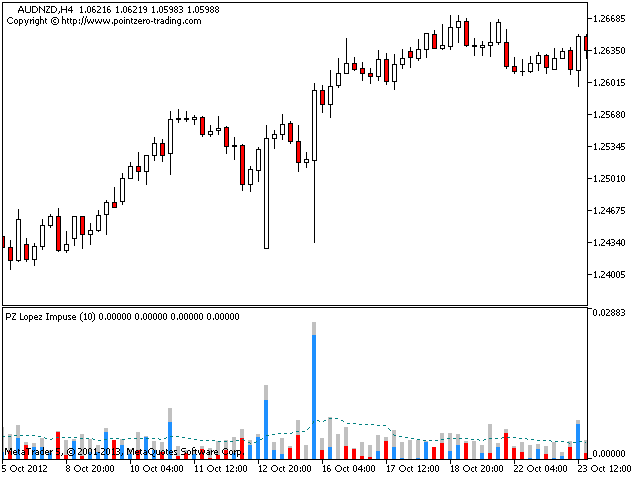
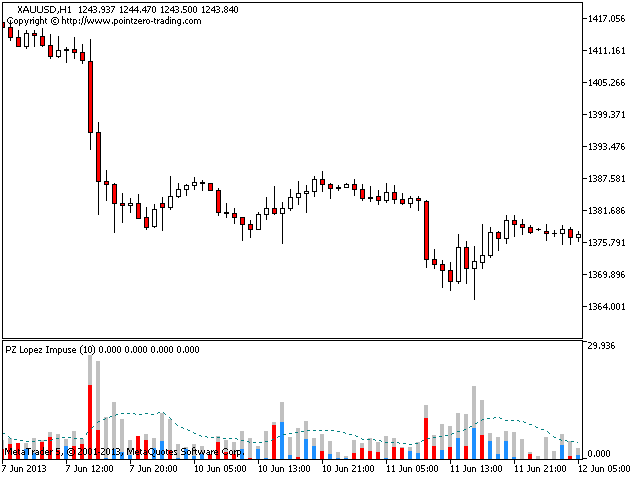
- 蓝色直方图代表看涨的冲动
- 红色直方图代表看跌冲动
- 灰色直方图表示当前的波动率
- 移动平均线是平均波动率
- 该指标实施各种警报
- 指示器不重涂或重涂
...具有直接的交易含义。
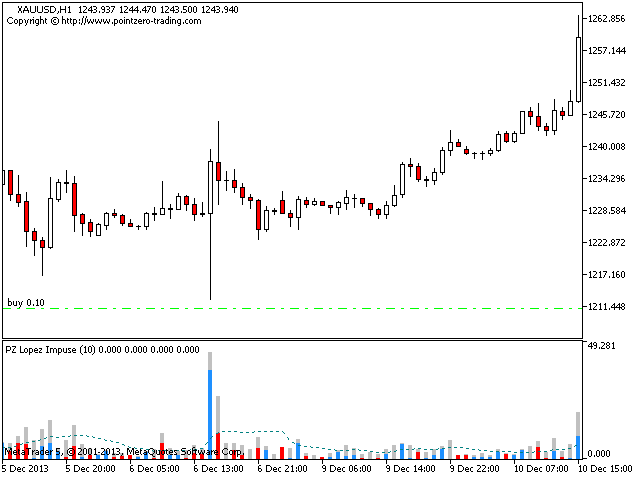
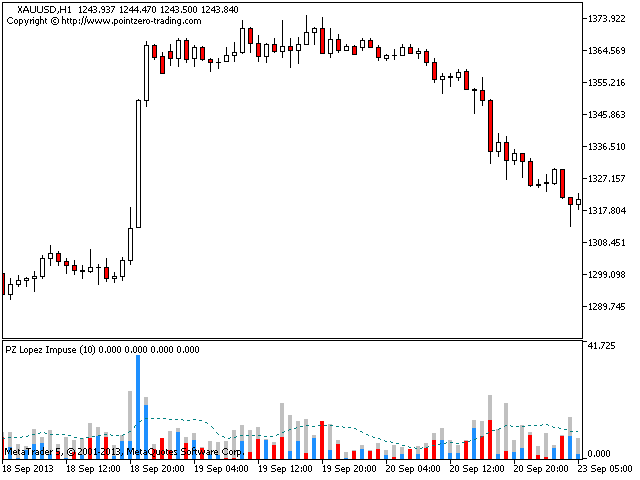
- 当看涨冲动超过平均波动率时,您可以购买
- 当看跌冲动超过平均波动率时,您可以卖出
该指标跟踪市场波动以及每个单个柱的看涨和看跌冲动。如果看涨的冲动超过平均波动率,那可能是做多空头的好机会。这些强劲的价格走势是可靠的,因为其他市场参与者可能会补仓。如果使用得当,此指示器功能非常强大。
作者
ArturoLópezPérez,私人投资者和投机者,软件工程师和Point Zero Trading Solutions的创始人。


Works great with the PZ Oscillator! Thanks much!