MQLTA Support Resistance Lines
- 指标
- MQL4 Trading Automation
- 版本: 1.1
- 更新: 16 二月 2021
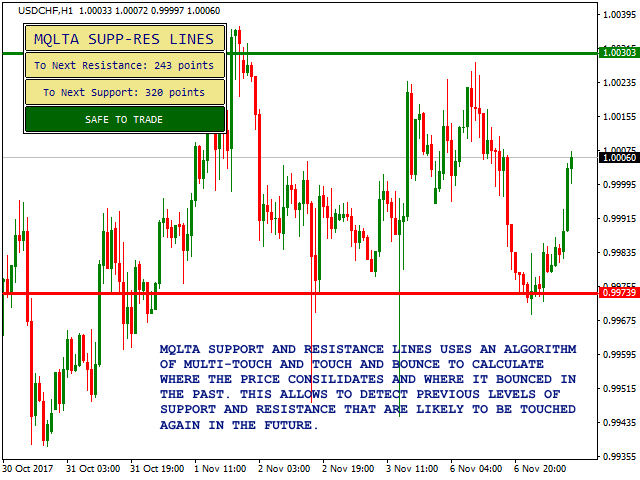
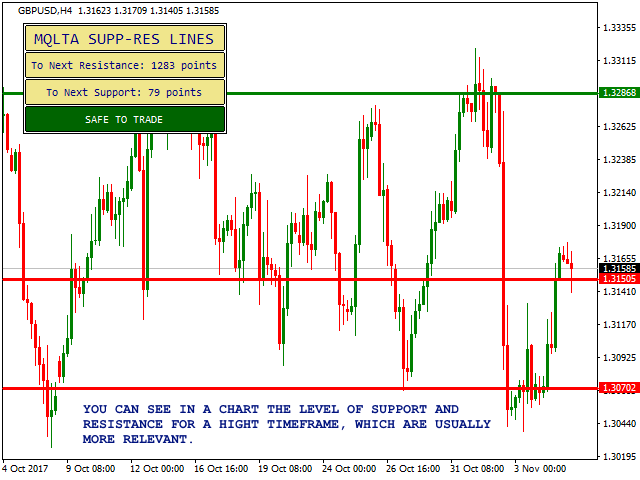
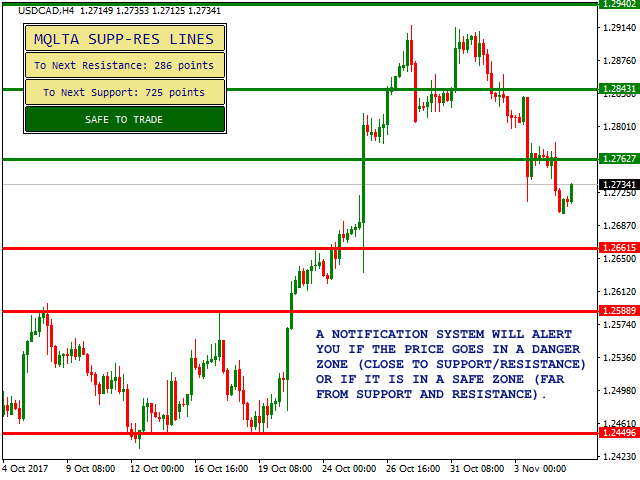
MQLTA Support Resistance Lines is an indicator that calculates the historical levels of Support and Resistance and display them as Lines on chart. It will also Alert you if the price is in a Safe or Dangerous zone to trade and show you the distance to the next level. The indicator is ideal to be used in other Expert Advisor through the iCustom function.
This indicator can be tested LIVE on AUDNZD with the following DEMO https://www.mql5.com/en/market/product/26572
How does it work?
The indicator has a complex algorithm that scans the chart to detect previous levels of consolidation and bounce of the price, which will likely act as support and resistance levels in the future.
How to trade with Support and Resistance indicator
More than an entry point indicator, Support and Resistance is ideally used as a warning sign to trade, or for scalping. If the price is close to a level of support or resistance this will have to be treated carefully as the price might bounce back or break the level.
Custom indicator and Expert Advisor
One of the problems faced by programmers of Expert Advisors and indicators is the detection of levels of support and resistance so that an EA can use the levels to stop trading or set TP and SL.
MQLTA Support Resistance Lines can be easily integrated in other indicators and Expert Advisors through the use of the iCustom function.
The indicator can return:
- The 8 closest levels of support/resistance
- The flag if the price is near a level
- The first level above the price
- The first level below the price
- The distance between the price and the above level
- The distance between the price and the below level
Parameters
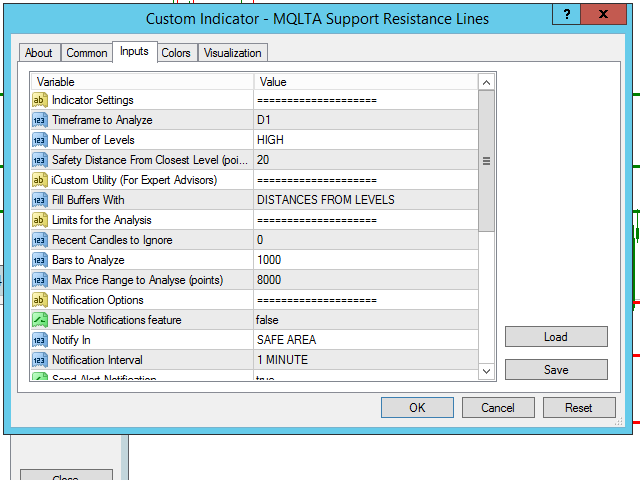
- Timeframe to Analyze - Choose the timeframe for the analysis of support and resistance levels
- Number of Levels - Choose if you want to display more or less levels
- Safety Distance - Minimum points of distance between the price and the closest level to consider the price in a Safe Zone
- Fill Buffers With - Choose what to fill the buffers with, used for integration in indicators and EAs
- Recent Candles to Ignore - Specify the number of recent candles to ignore in the analysis
- Bars to Analyze - Number of bars to analyze to calculate the levels
- Max Price Range to Analyze - Max range of price to analyze
- Enable Notifications - To enable or disable the notifications
- Notify in - To set if notify in Safe or Dangerous Area
- Notification Internal - Specify the minimum interval between notifications
- Send Alert Notifications - To enable or disable on screen alerts
- Alert Sound - To select the alert sound
- Send Notification to Mobile - To enable or disable the app notifications
- Send Notification to Email - To enable or disable email notifications
- Draw Lines - To enable or disable the display of lines
- Resistance Color
- Support Color
- Line Thickness
- Draw Window - To enable or disable the drawing of the window
- Horizontal spacing - distance of the window from the left border
- Vertical spacing - distance of the window from the top border
- Indicator Name - Prefix of the objects on chart
If you like this tool please take a minute to leave a review.
If you have suggestions to improve it please send me a message and we can discuss it further.
Feel free to visit my profile and "Add to friends" https://www.mql5.com/en/users/mql4autotrading.
















Good for S/R