SkynetEMA
- 指标
- Fabricio Perez Rojas
- 版本: 2.0
- 更新: 8 九月 2018
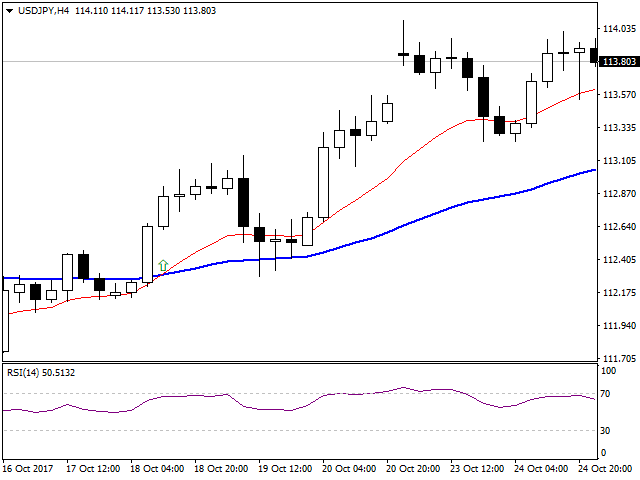
SkyNet EMA is an indicator will assist you by suggesting when to go long or short based on price action and the crossings of Exponential Moving Averages such as 14 period and 50 period. Just attach it to your chart and it will monitor the asset for potential sell opportunities and if found will paint a red arrow in your chart. Also will try to find buy opportunities and if found will paint a green arrow in your chart.
It could be used with any currency but majors are recommended since they will present more volatility. Also this indicator works with any timeframe however the higher the better since there will be less noise in the price.
Indicator parameters
- Audible_Alerts - true/false will control the audible alert when a buy/sell signal is found.


repaint