Market Maker
- 指标
- Chantal Sala
- 版本: 1.1
- 更新: 13 十月 2017
- 激活: 10
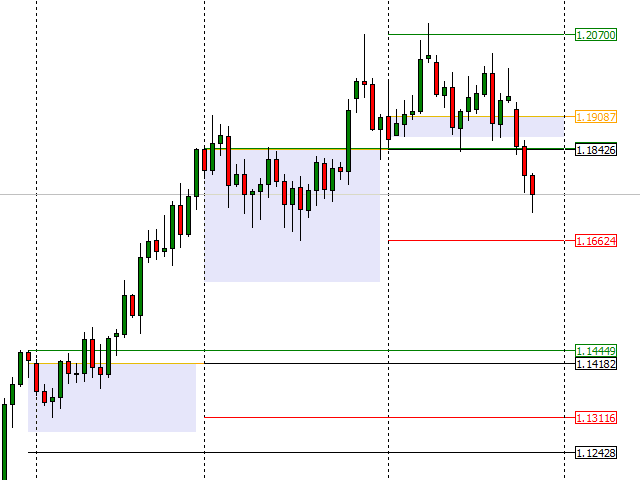
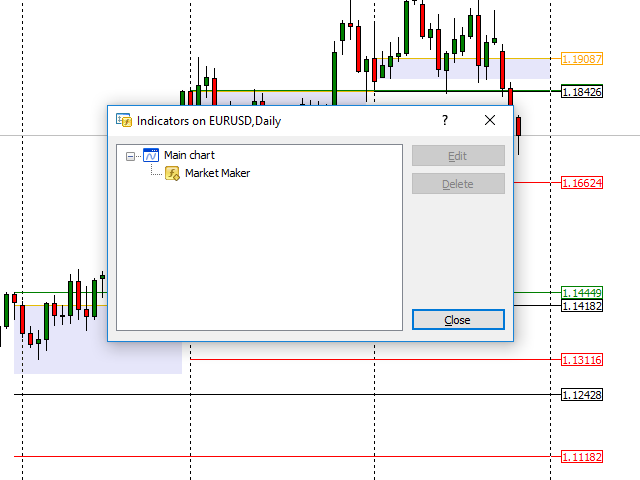
The Market Maker indicator focuses on key levels as minimum, maximum, opening and closing of important time frames.
An attentive observation of these levels will enable you to identify the proper direction of the trend.
On these levels the Market Makers try to make a very hunt of Stop Loss.
We recommend to use Daily values on H1 chart, Weekly values on H4 chart and Monthly values on D1 charts.
Use it setting all three time frames on the same chart and you will see that these levels will be a great help to find out the best target levels.
The indicator represents the best levels with higher operating statistical value.
Input Values
- PERIOD SETTING
- TimeFrame Period - which Time Frame to analyze
- Draw for Periods Number - how many candles to analyze, refer to Time Frame
- Show NO TRADE ZONE - show or not show the No Trade rectangle
- COLOR AND STYLE SETTINGS
- High Color - to set the levels lines on High levels
- Low Color - to set the levels lines on Low levels
- Previous Open Color - to set the levels lines on Previous Open price
- Open Color - to set the levels lines on Open Price
- Rectangle Color - to set the no trade rectangles
- Line Style - to set the levels lines
- Line_Width - to set the levels lines
- Price_Width - to set the price label


用户没有留下任何评级信息