High Volatility
- 指标
- Chantal Sala
- 版本: 1.1
- 更新: 29 九月 2017
- 激活: 10
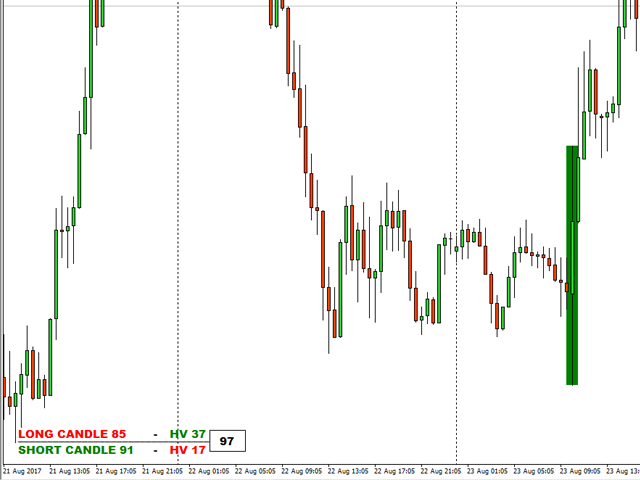
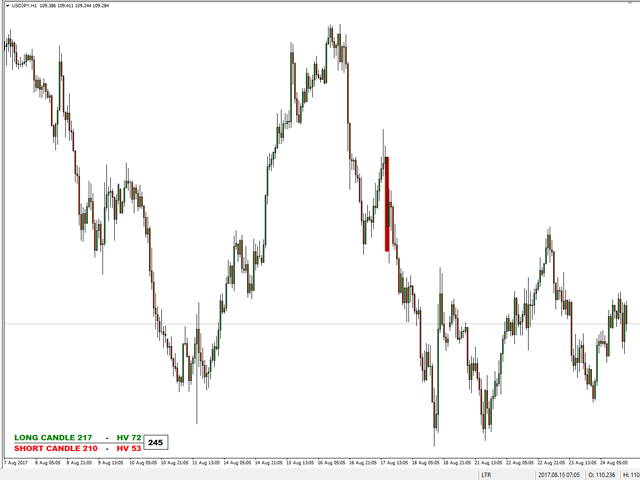
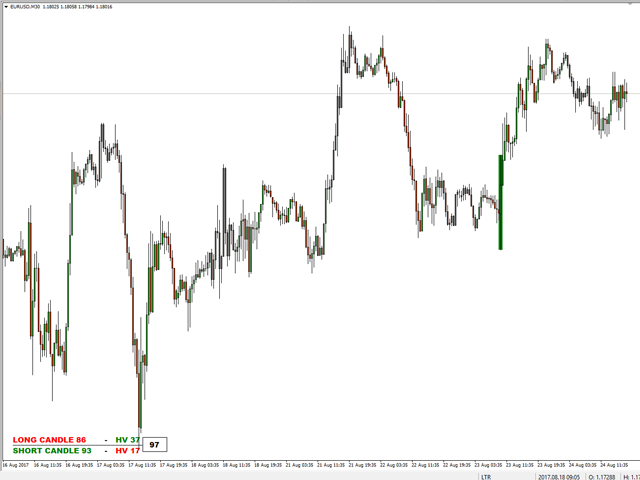
High Volatility is an utility indicator that has the task of locating volatile candles.
The recognition and counting function of bullish and bearish candles make it an excellent ally to understand the market volatility.
This point often defines possible reversals and moments of continuity.
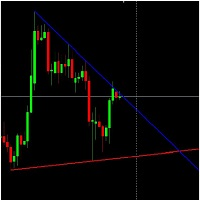
A rectangle is drawn on the chart to identify the candle with greater volatility in long and in short.
This indicator is very effective for short, medium, and long-term trading.
An alert will notify you when a new candle exceeds the last High Volatility value.
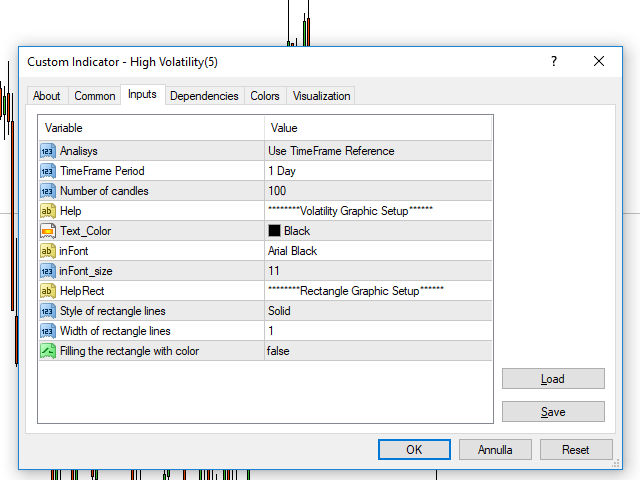
Input Values
- Analysis
- Use Number of candles: the indicator use the numbers of candles in the field to analysis
- Use TimeFrame Reference: the indicator use candles in the time frame chosen for analysis
- TimeFrame Period
- Number of candles
- Volatility Graphic Setup
- Text_Color
- inFont
- inFont_size
- Rectangle Graphic Setup
- Style of rectangle lines
- Width of rectangle lines
- Filling the rectangle with color
- Alert Setup
- PopUpMode (true/false) to enable or disable pop-up alerts
- SoundMode (true/false) to enable or disable sound alerts
- Sound to choose your favorite sound
- NotificationMode (true/false) to enable or disable push alerts
