FFx Basket Scanner MT5
- 指标
- Eric Venturi-Bloxs
- 版本: 1.4
- 更新: 16 六月 2021
- 激活: 5
MetaTrader 4 version available here: https://www.mql5.com/en/market/product/24881
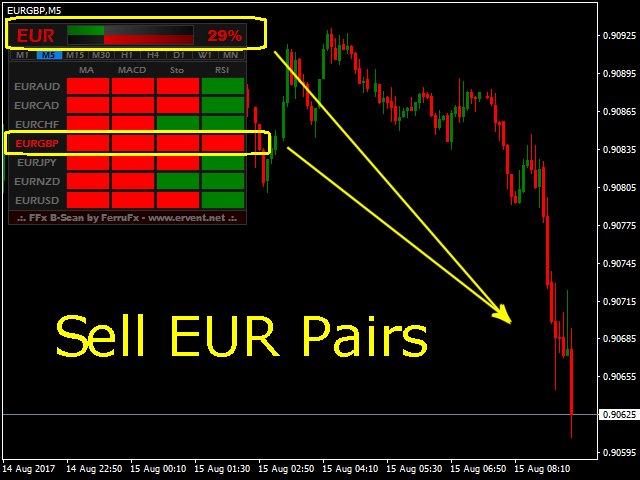
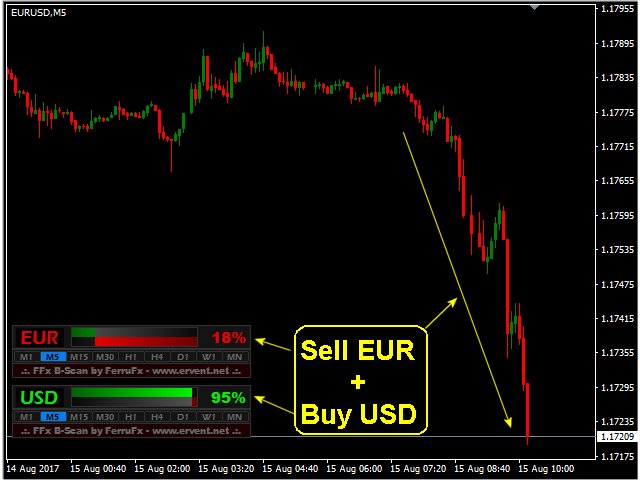
FFx Basket Scanner is a global tool scanning all pairs and all timeframes over up to five indicators among the 16 available. You will clearly see which currencies to avoid trading and which ones to focus on.
Once a currency goes into an extreme zone (e.g. 20/80%), you can
trade the whole basket with great confidence. Another way to use it is
to look at two currencies (weak vs strong) to find the best single pairs
to trade.
The panel is fully flexible for easy use
- Alert at extreme %
- Select up to nine timeframes (any combination)
- Select up to five indicators among the 16 available
- Maximize/minimize the panel to keep only the essential or the whole information visible
- One-click to open the symbols chart with selected template and timeframe
User Inputs
- Dashboard ID: number for each instance applied on the same chart.
- Candle Close: set here if you want the calculation to be done at candle close or in real time (current candle).
- Currency: select here the currency for the panel calculation.
- Horizontal/Vertical Shift: set here any number to place the dashboard anywhere on the chart.
- Template Name: name of the template you want to be applied when a pair is clicked and chart opened
- Timeframe: timeframe you want to be applied when a pair is clicked and chart opened
- Strong/Weak Levels %: from 0 to 100 when levels are reached, it can give an alert (popup/sound/email/push). Alert can be activated/deactivated by switching any of the true/false parameters.
- Then, all usual parameters for the standard indicators like the ones provided in your MetaTrader 4 platform (see below).
The panel can be displayed in a compact mode to monitor only the meter and timeframes selection (see images below).
- Moving Average
- Period: period of the MA
- Shift: shift of the MA
- Method: method of the MA
- ApplyTo: applied price of the MA
- MACD
- FastEMA: fast EMA period of the MACD
- SlowEMA: slow EMA period of the MACD
- SignalSMA: SMA period of the MACD
- Applied Price: applied price of the MACD
- Stochastic
- KPeriod: k period of the STO
- DPeriod: d period of the STO
- Slowing: slowing of the STO
- MAMethod: method of the STO
- PriceField: applied price of the STO
- RSI
- Period: period of the RSI
- ApplyTo: applied price of the RSI
- WPR
- Period: period of the WPR
- Momentum
- Period: period of the Momentum
- ApplyTo: applied price of the Momentum
- CCI
- Period: period of the CCI
- Applied Price: applied price of the CCI
- ADX
- Period: period of the ADX
- PSAR
- Step: step of the PSAR
- Maximum: maximum of the PSAR
- DeMarker
- Period: period of the DeMarker
- Bulls
- Period: period of the Bulls
- Bears
- Period: period of the Bears
- Force Index
- Period: period of the Force Index
- Method: method of the Force Index
- Volumes: volumes of the Force Index













Excellent. Ability to factor in different time frames or a combination of time frames is very useful. Can't understand why it hasn't had more positive reviews?
Update: 2019.05.17 - I think the 1* review (whilst probably technically correct) was a bit harsh. I see the developer has released an updated version today.
I still like this dash.