• 概述
  • 评论
  • 评论 (2)
  • 新特性

Line break chart PRO

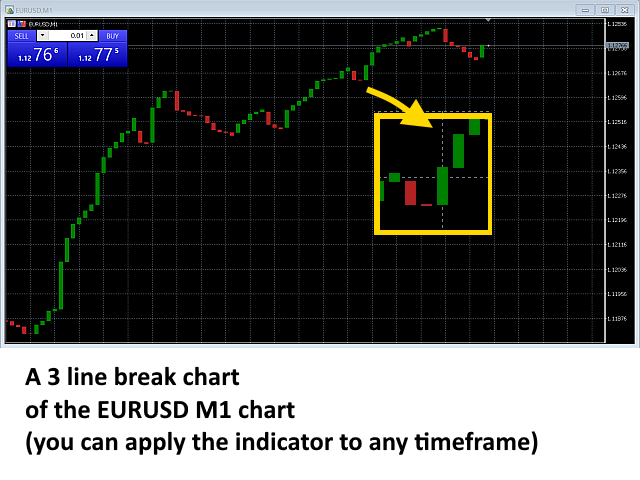
A professional line break chart which is displayed directly in the chart window thus making it possible to trade directly from the MetaTrader 5 charts.

The line break chart can be displayed as the most widely used 3 line break chart or a custom variation such as 2 or 5 line break chart.

Wicks can be displayed or hidden on the chart - they give a lot of additional information regarding the underlying price action.

The indicator's settings include:

  • Line break number - determines the number of lines (or previous candle lows/highs) that need to be broken in order to display a reversal line.
  • Show wicks (true/false)
  • Use max. candles for history calculation
  • UseInEA - Set to TRUE if indicator used in an EA (true/false)
  • Use padding top/bottom (0.0 - 1.0) - the percentage of the visible price span (high to low) that should be added to the top/bottom of the highest/lowest candle to make the chart more readable

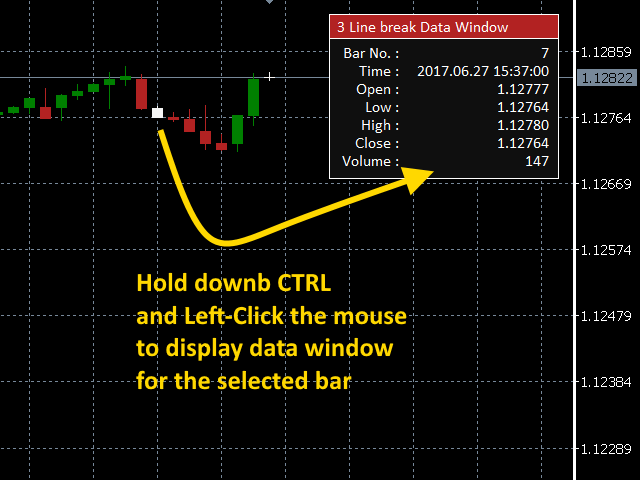
The indicator also features a custom data window where you can inspect each bar's OLHC prices as well as the bar's open time and cumulative volume information.

The data window is displayed by left-clicking on the selected candle while holding down the CTRL key on your keyboard.

推荐产品
Owl Smart Levels MT5
Sergey Ermolov
4.07 (28)
MT4版本  |   FAQ Owl Smart Levels Indicator 是一個完整的交易系統,包含 Bill Williams 的高級分形、構建正確的市場波浪結構的 Valable ZigZag 以及標記準確入場水平的斐波那契水平等流行的市場分析工具 進入市場和地方獲利。 策略的详细说明 指示灯使用说明 顾问-贸易猫头鹰助手助理 私人用户聊天 ->购买后写信给我,我会将您添加到私人聊天中,您可以在那里下载所有奖金 力量在於簡單! Owl Smart Levels 交易系統非常易於使用,因此適合專業人士和剛開始研究市場並為自己選擇交易策略的人。 策略和指標中沒有隱藏的秘密公式和計算方法,所有策略指標都是公開的。 Owl Smart Levels 允許您快速查看進入交易的信號,突出顯示下訂單的水平並向您發送有關已出現信號的通知。 優點很明顯: 清楚地顯示主要和更高時間框架的趨勢方向。 指示儀器信號的出現。 標記開單、止損設置和固定利潤的水平。 沒有多餘的,只有必要的結構! ZigZag 表示全球趨勢的方向,因此也表示貿易方向。 市場反轉點的短線清楚地表明在什麼水平上構建斐波
SolarTrade Suite 金融指标:木星市场指标 - 您在金融市场世界中的可靠指南! 这是一个趋势指标,使用特殊的创新和高级算法来计算其值,并且具有令人赏心悦目的设计。 很容易理解此指标的读数:蓝色 - 买入,红色 - 卖出。 在说明底部查看我们来自 SolarTrade Suite 系列的其他产品。 您想自信地驾驭投资和金融市场的世界吗? SolarTrade Suite 金融指标:木星市场指标是一款创新软件,旨在帮助您做出明智的投资决策并增加您的利润。 SolarTrade Suite 金融指标:木星市场指标的优势: - 准确预测:我们的指标使用先进的算法和分析方法来准确预测市场走势。 接收有关买卖资产最佳时机的信号。 - 用户友好界面:直观的界面将使您能够轻松掌握该程序并在安装后立即开始享受其好处。 您可以从设置中更改点的大小和颜色、灵敏度和速度,所有其他设置都是自动完成的。 - 专家支持:我们的专业团队随时准备为您解答任何问题并提供有关使用该程序的建议。 为什么选择 SolarTrade Suite 财务指标:木星市场指标? -
Cumulative Delta NG
Anton Polkovnikov
Cumulative delta indicator As most traders believe, the price moves under the pressure of market buying or selling. When someone redeems an offer standing in the cup, the deal is a "buy". If someone pours into the bid standing in the cup - the deal goes with the direction of "sale". The delta is the difference between purchases and sales. A cumulative delta - the difference between the cumulative sum of purchases and sales for a certain period of time. It allows you to see who is currently contr
Ultimate Candle Patterns
Wojciech Daniel Knoff
This is a multi-symbol and multi-timeframe table-based indicator designed for a candlestick patterns detection with 46 patterns for META TRADER 5. Each formation has own image for easier recognition. Here you find most popular formations such as "Engulfing", "Hammer", "Three Line Strike", "Piercing" or Doji - like candles. Check my full list of patterns on my screenshots below. Also you can not only switch all bearish or bullish patterns from input, but also select formation for a specified symb
Double HMA MTF for MT5
Pavel Zamoshnikov
3.67 (3)
This is an advanced multi-timeframe version of the popular Hull Moving Average (HMA) Features Two lines of the Hull indicator of different timeframes on the same chart. The HMA line of the higher timeframe defines the trend, and the HMA line of the current timeframe defines the short-term price movements. A graphical panel with HMA indicator data from all timeframes at the same time . If the HMA switched its direction on any timeframe, the panel displays a question or exclamation mark with a tex
An indicator of pattern #31 ("Long Island") from Encyclopedia of Chart Patterns by Thomas N. Bulkowski. The second gap is in the opposite direction. Parameters: Alerts - show alert when an arrow appears   Push - send a push notification when an arrow appears (requires configuration in the terminal) GapSize - minimum gap size in points ArrowType - a symbol from 1 to 17 ArrowVShift - vertical shift of arrows in points   ShowLevels - show levels ColUp - color of an upward line ColDn - color of a
Blahtech Market Profile MT5
Blahtech Limited
5 (9)
Was: $249  Now: $99   Market Profile defines a number of day types that can help the trader to determine market behaviour. A key feature is the Value Area, representing the range of price action where 70% of trading took place. Understanding the Value Area can give traders valuable insight into market direction and establish the higher odds trade. It is an excellent addition to any system you may be using. Inspired by Jim Dalton’s book “Mind Over Markets”, this indicator is designed to suit the
Renko Gold
Ignacio Agustin Mene Franco
Renko Gold! clearly indicates the floors and ceilings where it goes from 4 lines, the line below that marks the floor in green confirming with the thinnest line clarifies the purchase entry, the same is for sale, the top line marks the ceiling and the thinnest red line marks the sale, This indicator works for all temporalities! For Forex and Synthetic Indices markets! It also works for crypto markets! Good profit! World Investor.
Your Trend Friend
Luigi Nunes Labigalini
5 (1)
The trend is your friend! Look at the color of the indicator and trade on that direction. It does not  repaint. After each candle is closed, that's the color of the trend. You can focus on shorter faster trends or major trends, just test what's most suitable for the symbol and timeframe you trade. Simply change the "Length" parameter and the indicator will automatically adapt. You can also change the color, thickness and style of the lines. Download and give it a try! There are big movements
Renko Plus
Eadvisors Software Inc.
With Renko Plus you can use the features in the Indicator functionality, just add it to the Metatrader5 chart.             The Renko chart is a type of chart, developed by the Japanese, that is constructed using price movement rather than standardized prices and time intervals like most charts. It is believed to be named after the Japanese word for bricks, "renga", as the graphic looks like a series of bricks.             A new brick is created when the price moves a specified p
PZ Penta O MT5
PZ TRADING SLU
The Penta-O is a 6-point retracement harmonacci pattern which usually precedes big market movements. Penta-O patterns can expand and repaint quite a bit. To make things easier this indicator implements a twist: it waits for a donchian breakout in the right direction before signaling the trade. The end result is an otherwise repainting indicator with a very reliable trading signal. The donchian breakout period is entered as an input. [ Installation Guide | Update Guide | Troubleshooting | FAQ | A
"Support and Resistance" is a fundamental concept in technical analysis for trading stocks, currencies, or other assets in financial markets. Here's how to use it: Identifying Support Support is a price level where buying is strong. When the price drops to this level, there tends to be significant buying activity, preventing the price from falling further. Identifing Support: Look for the lowest points in a given period and find levels where the price has bounced back up multiple times. Usage:
Atomic Analyst MT5
Issam Kassas
4.42 (19)
首先值得强调的是,该交易指标是非重绘、非延迟的指标,这使其成为手动和机器人交易的理想选择。 用户手册:设置、输入和策略。 Atomic Analyst是一种PA价格行动指标,利用价格的力量和动量来寻找市场上更好的机会。配备了高级过滤器,可帮助去除噪音和假信号,并提高交易潜力。使用多层复杂的指标,Atomic Analyst扫描图表,并将复杂的数学计算转化为任何初学者都能理解并用来做出一致交易决策的简单信号和颜色。 “Atomic Analyst”是专为新手和经验丰富的交易者量身定制的综合交易解决方案。它将高级指标和一流功能融合为一体的交易策略,使其成为所有类型交易者的多功能选择。 日内交易和剥头皮策略:专为快速准确的日内交易和短期交易而设计。 日内和摆动交易策略:可用作追求价格大幅波动的日内和摆动交易者的可靠工具。 多货币和市场:凭借其可靠的精度,在不同的工具和市场上运作。 多个时间框架:可在多个时间框架上使用,性能良好。 稳定性:所有指标均不重绘、不重绘和不滞后,确保可靠的信号。 信号清晰度:提供箭头信号,用于清晰的入场和出场点。 实时警报:通过交易入场、SL和TP警报通知交
和谐图案最适合预测市场转折点。和谐图案为您提供高胜率和一天内的高交易机会。 该指标识别了最受欢迎的和谐图案,这些图案预测市场反转点。 基于和谐交易书籍。 重要说明: 该指标不会重绘或滞后(它在D点检测到模式);它不会重新绘制(模式要么有效,要么取消)。 使用方法: 将指标拖放到您的MT5图表上。 将模式检测设置为TRUE(ABCD; Gartley)。 根据您的喜好调整偏差(较大的偏差=更多的模式;较小的偏差=更少的模式)。 根据您的喜好自定义颜色。 根据需要启用或禁用关于入场点、TP和SL的警报。 检测到模式时: 该算法在D点检测到模式。 如果启用了警报,它将通知您检测到的模式。 如果模式无效,则触发一个带有“模式已取消”消息的警报。 成功的模式在蜡烛关闭时触发“入场警报”。 如果价格达到TP1、TP2、TP3、TP4或SL,则会发出带有终端消息的警报。 价格现在为40美元,仅剩下几份副本,最终价格将为70美元。 发展计划: 该指标的当前版本(1.1)将检测Gartley和ABCD模式。 版本1.1将包括Butterfly、Bat和Crab模式。 未来版本将包括其他模式、潜在PRZ检
Smooth Patterns
Roman Vashchilin
Trading patterns on Forex is considered to be the highest level of trading, since it usually requires years of mastering various patterns (shapes and candle combinations) and the ways they affect the price. Patterns are different combinations of Japanese candles on a chart, shapes of classical technical analysis, as well as any regularities of the market behavior repeating many times under the same conditions. After the patterns appear on a chart, the price starts behaving in a certain way allow
PipFinite Exit EDGE MT5
Karlo Wilson Vendiola
4.86 (29)
Did You Have A Profitable Trade But Suddenly Reversed? In a solid strategy, exiting a trade is equally important as entering. Exit EDGE helps maximize your current trade profit and avoid turning winning trades to losers. Never Miss An Exit Signal Again Monitor all pairs and timeframes in just 1 chart www.mql5.com/en/blogs/post/726558 How To Trade You can close your open trades as soon as you receive a signal Close your Buy orders if you receive an Exit Buy Signal. Close your Sell orde
Noize Absorption Index
Ekaterina Saltykova
Noize Absorption Index - is the manual trading system that measures the difference of pressure between bears forces and bulls forces. Green line - is a noize free index that showing curent situation. Zero value of index shows totally choppy/flat market.Values above zero level shows how powerfull bullish wave is and values below zero measures bearish forces.Up arrow appears on bearish market when it's ready to reverse, dn arrow appears on weak bullish market, as a result of reverse expectation.
Predictor PRO MT5
Evgenii Aksenov
来自无限的新一代渐进指示器. Predictor PRO使用自己的进入和退出计算策略。 指标没有重绘信号! 这对真实交易非常重要。 该指标可用于任何货币对,金属,加密货币或指数。 H1图表的最佳时间。 Predictor PRO显示买入/卖出入口点和收盘出口点。 以点数计算利润有助于为选定的历史周期选择最佳设置。 预测器PRO指标可以提供自己的虚拟交易关闭点或根据指定的SL和TP参数修复它们。 购买后与我联系,以获得优化设置的文件,邀请VIP组 指标的优点 无需重绘的输入信号 预测Pro适用于任何资产 它既适用于趋势,也适用于平面 每个信号都有一个特定的入口和出口点,计算交易的结果 所有交易的总体结果有助于快速调整指标的参数到每个符号 电话上的通知和弹出的警报窗口将提醒您出现的信号 Predictor PRO适用于专家和初学者,并与其他无限指标和策略兼容 INFINITY:  https://www.mql5.com/en/users/neurofx/seller 指标参数 Calculation range (Days) -计算范围(天)。 在图表上安装指标之前
Terra Infinity
Ivan Simonika
Terra Infinity is a flat indicator. This improved version of the CalcFlat indicator has three additional lines that significantly increase its effectiveness. Unlike its predecessor with two static levels, Terra Infinity adds three dynamic lines above the main histogram, which are interpreted as follows: base signal line, minimum signal line, maximum signal line. These lines are formed using the additional parameter Avg, which is the average value of the histogram. Averaging produces a line
All Harmonics 26
Alexey Isavnin
3.5 (4)
Harmonic patterns are characteristic series of price movements with respect to Fibonacci levels, which statistically precede price reversals. This indicator searches for harmonic patterns. It is capable of recognising 26 classical and non-classical harmonic patterns : Classical Gartley Butterfly Alternate Butterfly Bat Alternate Bat Crab Deep Crab Three Drives Non-classical Shark Alternate Shark Cypher 5-0 Anti Gartley Anti Butterfly Anti Alternate Butterfly Anti Bat Anti Alternate Bat Anti Crab
MSnR Lines
Pierre Paul Amoussou
MSnR Lines 是一个自定义指标,旨在在图表上显示支撑和阻力水平。这些水平基于马来西亚支撑和阻力理论,该理论将水平定义为特定的价格水平,而不是区域,这些价格水平是从线图的峰值和谷值中派生出来的。 特点: 三种类型的水平:A-Level,V-Level和间隙水平。 水平的新鲜度指示:新鲜水平比非新鲜水平更重要。新鲜水平指尚未被测试或已经被交易。 可自定义新鲜水平和非新鲜水平的颜色和样式。 仅显示新鲜水平或所有水平的选项。 可调整的回溯期和当前价格上下方水平的数量。 支持多时间框架。 用途: 交易者可以使用MSnR Lines来识别潜在的支撑和阻力水平以做出交易决策。新鲜水平被认为更为重要,并且可能提供更好的交易机会。此外,交易者还可以根据不同时间框架上的水平来进行多时间框架分析,以提高交易决策的准确性和可靠性。
支撑和阻力指标是改编自标准的比尔威廉姆斯的分形指标。 该指标可工作于任何时间帧。它在图表上显示支撑和阻力位,并允许设置止损和止盈级别 (您可以通过鼠标覆盖级别来检查其精确值)。 蓝色点划线是支撑位。 红色点划线是阻力位。 如果您愿意, 您可以改变这些线的样式和颜色。 如果价格接近支撑位,卖方的活跃度降低,买方的活跃度增加。如果价格接近阻力位,买方的活跃度降低,卖方的活跃度增加。 注, 当价格突破支撑位, 它变为阻力位; 同样当价格突破阻力位, 它变为支撑位。
Awesome Oscillator by Bill Williams with the ability to fine-tune and replace the averaging algorithms of the indicator, which significantly expands the possibilities of using this oscillator in algorithmic trading and brings it closer in its properties to such an indicator as the MACD. To reduce price noise, the final indicator is processed with an additional Smooth averaging. The indicator has the ability to give alerts, send mail messages and push signals when the direction of movement of th
KT Renko Patterns MT5
KEENBASE SOFTWARE SOLUTIONS
KT Renko Patterns scans the Renko chart brick by brick to find some famous chart patterns that are frequently used by traders across the various financial markets. Compared to the time-based charts, patterns based trading is easier and more evident on Renko charts due to their uncluttered appearance. KT Renko Patterns features multiple Renko patterns, and many of these patterns are extensively explained in the book titled Profitable Trading with Renko Charts by Prashant Shah. A 100% automate
A machine translation from the English product description was used. We apologize for possible imprecisions. 使用了英文 产 品描述的机器翻 译。 我 们对可能的不准确表示歉意 。 最喜 欢的烛台价格行为模式的可视化系统 。 附加后,指 标将自动在图表上标记下一个模式 : 匹 诺曹酒吧  - 带有长 “ 鼻子 ” 的小型条形杆,非常著名的反向模式; 内柱  -  一个柱,其范 围位于前一个柱的范围内。   它代表市 场的不确定性 ; 外柱  -  其范 围超出前一个柱的范围的柱。   它代表市 场的不确定性 ; 导轨图案  - 两个随之而来的 对立柱,具有几乎相等的、较大的实体。 反向模式, 实际上与更高时间框架的匹诺曹柱线模式相吻合 ; 主蜡 烛形态  -  蜡 烛的第五根,其中四个后续蜡烛的范围 在第五根蜡 烛的范围内   -   主蜡 烛。   这种模式代表市场整合,尤其是在较短的时间范围内 。 差距  -  后 续柱的收盘价和开盘价之间的差距,不应忽视 。 该指标的开发考
Fractal 358 Plus
Renato Fridschtein
Fractal 358 Plus is a predictive indicator that provides the clearest sight of price movements. Identifying graphic patterns such as Caixote (Crate), Pivot and Inside Candle , it shows entries and exits spots, as well as threats to your trades in the markets. It comes ready to use with B3 Mini Index (WIN$ series) and can be adjusted to use with any asset and timeframe. Fractal 358 unravels price movement Based on the Fibonacci sequence, Fractal 358 is a new and different way of reading and un
Candle hunter
Ruslan Khasanov
5 (1)
圖形分析指標。 在圖表上標記主要的日本燭台形態。 目前,交易者可以使用以下一組模式:  - Bearish/Bullish Abandoned Baby;  - Bearish Advance Block;  - Bearish Deliberation;  - Bearish/Bullish Belt Hold;  - Bearish/Bullish Engulfing;  - Bearish Shooting Star;  - Bearish Evening Star;  - Bearish Evening Doji Star;  - Bearish/Bullish Doji Star;    - Bearish/Bullish Tri-Star;  - Bearish Hanging Man;  - Bearish/Bullish Harami;  - Bearish/Bullish Harami Cross;  - Bearish Two Crows;  - Bearish Identical Three Crows;  - Bearish Three Black Crows
This indicator studies price action as an aggregation of price and time vectors, and uses the average vector to determine the direction and strength of the market. This indicator highlights the short-term directionality and strength of the market, and can be used to capitalize from short-term price movements by trading breakouts or binary options   [ Installation Guide | Update Guide | Troubleshooting | FAQ | All Products ] Find market direction easily Confirm with breakouts or other indicators
PZ Fibonacci MT5
PZ TRADING SLU
5 (1)
Are you tired of plotting Fibonacci retracements or extensions manually? This indicator displays Fibo retracements or extensions automatically, calculated from two different price points, without human intervention or manual object anchoring. [ Installation Guide | Update Guide | Troubleshooting | FAQ | All Products ] Easy to use Manual anchoring is not needed Perfect for price confluence studies The indicator evaluates if retracements or extensions are needed Once drawn, you can manually edit t
该产品的买家也购买
TPSpro RFI Levels MT5
Roman Podpora
4.73 (11)
指示       俄罗斯 -        英语   建议 与指示器一起使用     -       TPSpro 趋势专业版 -   MT4版本       交易中的一个关键要素是做出买卖交易工具决定的区域或水平。尽管主要参与者试图隐藏他们在市场中的存在,但他们不可避免地会留下痕迹。我们的任务是学习如何识别这些痕迹并正确解释它们。 主要功能: 向卖家和买家显示活跃区域! 该指标显示所有正确的初始买入和卖出脉冲水平/区域。激活这些水平/区域后,开始寻找切入点,水平会改变颜色并填充特定阴影。此外,还会显示箭头,以便更直观地了解情况。 显示更高时间范围内的级别/区域(MTF 模式) 添加了使用更高时间间隔显示级别/区域的功能。此外,该指标还具有自动趋势检测功能(   TPSproTREND PRO   )。 用于交易的单独专业的逐步算法。 该算法专为日内交易而设计,既可顺势交易,也可逆势交易。每个活动模板均提供详细说明。 适用于多种时间范围 。 TPSpro RFI 水平指标可用于图表上的任何时间范围,从一分钟(M1)开始一直到每月(MN)。 图形和声音警报。 该指标提供图形和声音指示
首先,值得强调的是,这个交易系统是一个非重绘、非重画和非滞后的指标,这使得它非常适合手动和机器人交易。 在线课程,手册和下载预设。 “智能趋势交易系统 MT5”是专为新手和经验丰富的交易者量身定制的综合交易解决方案。它结合了超过 10 个优质指标,具有 7 多个强大的交易策略,使其成为适用于各种市场条件的多功能选择。 趋势跟随策略:提供精确的入场和止损管理,以有效地跟随趋势。 反转策略:识别潜在的趋势反转,使交易者能够利用区域市场的机会。 剃头策略:专为快速准确的日内交易和短期交易而设计。 稳定性:所有指标都不会重绘、不会重画和不会滞后,确保可靠的信号。 定制:支持自定义策略,以满足个人交易偏好。超过 7 种策略和组合可帮助您找到最佳策略。 信号清晰度:提供箭头信号,以指示清晰的入场和退出点。 实时警报:通过交易进出警报使交易者保持了解。 深入分析:提供更高时间框架的趋势分析和实时交易监控。 自适应颜色编码:利用蜡烛颜色编码来显示成交量、趋势和反转蜡烛信号。通过蜡烛颜色分析市场方向。 “智能趋势交易系统 MT5”赋予交易者必要的工具,以便在各种市场条件下做出明智和战略性的交易决策。无论
Gold Stuff mt5
Vasiliy Strukov
4.92 (167)
Gold Stuff mt5 是专为黄金设计的趋势指标,也可用于任何金融工具。 该指标不会重绘,也不会滞后。 推荐时间框架 H1。 购买后立即联系我以获得设置和个人奖励!   你可以在我的个人资料中找到它。   重要! 购买后立即与我联系,以获得说明和奖金!   您可以免费收到我们的强力支持和趋势扫描指标的副本,请私信。大部头书!   设置 绘制箭头 - 打开关闭。 在图表上绘制箭头。 警报 - 打开关闭声音警报。 电子邮件通知 - 打开关闭。 电子邮件通知。 Puch-notification - 打开关闭。 推送通知。 接下来,调整色域。 Gold Stuff mt5 是专为黄金设计的趋势指标,也可用于任何金融工具。 该指标不会重绘,也不会滞后。 推荐时间框架 H1。 购买后立即联系我以获得设置和个人奖励!   设置 绘制箭头 - 打开关闭。 在图表上绘制箭头。 警报 - 打开关闭声音警报。 电子邮件通知 - 打开关闭。 电子邮件通知。 Puch-notification - 打开关闭。 推送通知。 接下来,调整色域。
Trend Screener Pro MT5
STE S.S.COMPANY
4.87 (63)
使用趋势筛选指标释放趋势交易的力量:由模糊逻辑和多货币系统提供支持的终极趋势交易解决方案! 使用趋势筛选器(由模糊逻辑提供支持的革命性趋势指标)提升您的趋势交易。 它是一个强大的趋势跟踪指标,结合了超过 13 种高级工具和功能以及 3 种交易策略,使其成为使您的 Metatrader 成为趋势分析器的多功能选择。 限时优惠:趋势筛选指标终身仅需 50 美元。 ( 原价 250$ ) (优惠延长) 体验趋势筛选器 100% 无需重新绘制的准确性,确保您的交易决策不受过去价格变化的影响。 释放多时间框架和多货币功能的多功能性,使您能够以无与伦比的信心在外汇、商品、加密货币和指数领域进行交易。 利用 Trend Screener 的综合策略套件增强您的交易: - 趋势跟踪策略和趋势延续策略 :趋势筛选器的趋势跟踪策略提供清晰的趋势延续信号,让您有效捕捉趋势走势并管理风险。 - 反转策略和早期入场点策略 :趋势筛选器的反转策略可检测市场方向的潜在变化,使您能够预测趋势反转并利用疲弱的市场趋势。通过早期入场点,您可以在潜在的趋势变化之前定位自己 获取可观的利润。 - 倒卖策略: 趋势筛选器的倒卖
FxaccurateLS
Shiv Raj Kumawat
WHY IS OUR FXACCCURATE LS MT5 THE PROFITABLE ? PROTECT YOUR CAPITAL WITH RISK MANAGEMENT Gives entry, stop and target levels from time to time. It finds Trading opportunities by analyzing what the price is doing during established trends. POWERFUL INDICATOR FOR A RELIABLE STRATEGIES We have made these indicators with a lot of years of hard work. It is made at a very advanced level. Established trends provide dozens of trading opportunities, but most trend indicators completely ignore them!
FX Power MT5 NG
Daniel Stein
5 (5)
通过 mql5 和 Telegram 上 的晨间简报获取每日市场更新,包括详细信息和屏幕截图 ! FX Power MT5 NG 是我们长期以来非常受欢迎的货币强度计算器 FX Power 的下一代产品。 这款下一代强度计算器能提供什么?您所喜爱的原版 FX Power 的所有功能 附加功能 黄金/XAU 强度分析 更精确的计算结果 可单独配置的分析周期 可自定义计算限制,以获得更好的性能 为希望查看更多信息的用户提供特殊的多实例设置 无尽的图形设置,可在每个图表中设置您最喜欢的颜色 无数的通知选项,让您再也不会错过任何重要信息 采用 Windows 11 和 macOS 风格的全新圆角设计 神奇的移动指标面板 FX Power 主要功能 所有主要货币的完整强势历史 所有时间框架内的货币强弱历史 所有经纪商和图表的计算结果完全相同 100% 可靠的实时计算 -> 无重绘 可通过下拉列表选择分析时段 通过自定义模式单独配置分析时段 可在一个图表中使用多个实例 可移动 FX Power 显示屏(通过拖放) 适用于高分辨率 QHD、UHD 和 4K 显示器 自动终端配置 针对平板电脑
该仪表盘显示所选符号的最新可用谐波形态,因此您可以节省时间并提高效率 /  MT4 版本 。 免费指标:  Basic Harmonic Pattern 指标列 Symbol:   显示所选符号 Trend:     看涨或看跌 Pattern:    形态类型(Gartley、蝴蝶、蝙蝠、螃蟹、鲨鱼、Cypher 或 ABCD) Entry:     入口价格 SL: 止损价 TP1: 第一止盈价 TP2: 第二次获利价格 TP3: 第三次获利价格 Current price:    当前价格 Age (in bars):   最后绘制的模式的年龄 主要输入 Symbols :   从 "28 种主要货币对 "或 "选定符号 "中选择。 Selected Symbols :   希望监控的符号,用逗号分隔("EURUSD,GBPUSD,XAUUSD")。如果您的经纪商为货币对设置了后缀或前缀,您必须在以下两个参数中添加(货币对前缀或货币对后缀)。 Max Iteration:   调整模式的最大迭代次数(如果该值越小,则模式越少,性能越快;如果该值越大,则模式越多,性能
PZ Swing Trading MT5
PZ TRADING SLU
5 (4)
Swing Trading 是第一个旨在检测趋势方向的波动和可能的反转波动的指标。它使用在交易文献中广泛描述的基准摆动交易方法。该指标研究多个价格和时间向量,以追踪总体趋势方向,并检测市场超卖或超买并准备好进行修正的情况。 [ 安装指南 | 更新指南 | 故障排除 | 常见问题 | 所有产品 ] 市场波动的利润不会被窃取 指示器始终显示趋势方向 彩色价格带代表机会基准 彩色虚线表示可能的反转波动 该指标分析其自身的质量和性能 它实现了一个多时间仪表板 可定制的趋势和波动周期 它实现了电子邮件/声音/推送警报 指示器为非重涂或重涂 什么是摇摆交易 摇摆交易是一种尝试在一天到一周内从证券中获得收益的交易方式,尽管某些交易最终可以保持更长的寿命。摇摆交易者使用技术分析来买入弱点和卖出力量,并有耐心等待这些机会的发生,因为在发生一波抛售浪潮之后购买证券而不是陷入抛售更有意义。 机会基准 关于历史数据的大量研究证明,适合于波动交易的市场倾向于在基线价格带上下交易,基线价格带由图表显示,使用平均真实区间计算得出。波动交易者使用基线,该策略是购买常态和卖出躁狂,或做空常态并掩盖沮丧。
Quantum Trend Sniper
Bogdan Ion Puscasu
4.8 (49)
介绍   量子趋势狙击指标 ,突破性的 MQL5 指标,正在改变您识别和交易趋势反转的方式!由拥有超过13年交易经验的资深交易员团队开发,     量子趋势狙击指标   旨在通过其创新的方式以极高的准确度识别趋势反转,将您的交易之旅推向新的高度。 ***购买量子趋势狙击指标,即可免费获得量子突破指标!*** 当量子突破指标识别出趋势反转时,它会向您发出警报和信号箭头,并建议您三个止盈水平。 它既适合新手交易者,也适合专业交易者。 量子 EA 通道:       点击这里 MT4版本:       点击这里 建议: 时间范围: 所有时间范围。为了获得最佳结果,我们建议在 M15、M30 和 H1 时间范围内使用它。 货币对:欧元兑美元、英镑兑美元、澳元兑美元、欧元兑英镑、, EURAUD,  XAUUSD 账户类型:ECN、Raw 或 Razor,点差极低 经纪时间:任意 经纪商:IC Markets、Pepperstone with Raw 和 Razor 的点差最低 建议止损:50 点 建议止盈水平:20 点、50 点和
Blahtech Supply Demand MT5
Blahtech Limited
4.54 (13)
Was: $299  Now: $99   Supply Demand uses previous price action to identify potential imbalances between buyers and sellers. The key is to identify the better odds zones, not just the untouched ones. Blahtech Supply Demand indicator delivers functionality previously unavailable on any trading platform. This 4-in-1 indicator not only highlights the higher probability zones using a multi-criteria strength engine, but also combines it with multi-timeframe trend analysis, previously confirmed swings
RelicusRoad Pro MT5
Relicus LLC
5 (17)
现在$ 147(更新后增加到$ 499) - 无限帐户(PC或Mac) RelicusRoad 用户手册 + 培训视频 + 访问 Private Discord Group + VIP 身份 一种看待市场的新方式 RelicusRoad 是世界上最强大的外汇、期货、加密货币、股票和指数交易指标,为交易者提供保持盈利所需的所有信息和工具。我们提供技术分析和交易计划,帮助每一位交易者取得成功,从初学者到高级。它是一个关键的交易指标,可以提供足够的信息来预测未来的市场。我们相信一个完整的解决方案,而不是图表上几个没有意义的不同指标。这是一个多合一指标,显示无与伦比且非常准确的信号、箭头 + 价格行为信息。 RelicusRoad 基于强大的人工智能,提供缺失的信息和工具来教育您并使您成为交易专家,成为成功的交易者。 几乎所有技术指标都滞后,这意味着它们只能报告已经发生的事情。因此,他们只确认您过去可以看到的价格已经在哪里。我们相信领先指标可以预测未来价格,而无需重新绘制,也不要过度依赖可能改变并导致重新绘制的滞后指标。如果您根据滞后指标进行交易并建立头寸,您就知道您已
首先,值得强调的是,这个交易工具是非重绘、非重画和非滞后的指标,非常适合专业交易。 在线课程,用户手册和演示。 智能价格行动概念指标是一个非常强大的工具,既适用于新手,也适用于经验丰富的交易者。它将超过20个有用的指标合并到一个指标中,结合了高级交易思想,如内圈交易员分析和智能资金概念交易策略。该指标侧重于智能资金概念,提供有关大型机构交易方式的见解,帮助预测它们的动向。 它在流动性分析方面尤其擅长,有助于理解机构的交易方式。它擅长预测市场趋势,并仔细分析价格波动。通过将您的交易与机构策略对齐,您可以更准确地预测市场走向。该指标多才多艺,擅长分析市场结构,识别重要的订单区块,并识别各种模式。 它擅长识别BOS和CHoCH等模式,理解动量的转变,并突出显示供需强劲的关键区域。它还擅长发现强大的不平衡,并分析价格创造更高高点或更低低点的模式。如果您使用斐波那契回撤工具,该指标可以满足您的需求。它还可以识别相等的高点和低点,分析不同的时间框架,并通过仪表板显示数据。 对于使用更高级策略的交易者,该指标提供了工具,如公平价值差指标和优惠和折扣区域的识别。它特别关注高时间框架订单
Fxaccurate TCT
Shiv Raj Kumawat
WHY IS OUR FXACCCURATE TCT MT5 THE PROFITABLE ? Gives entry, stop and target levels from time to time. It finds Trading opportunities by analyzing what the price is doing during established trends. We have made these indicators with a lot of years of hard work. It is made at a very advanced level. Established trends provide dozens of trading opportunities, but most trend indicators completely ignore them! The trend reveals trading indicator represents an average of 10 different trades per trend
ICT, SMC, SMART MONEY CONCEPTS, SMART MONEY, Smart Money Concept, Support and Resistance, Trend Analysis, Price Action, Market Structure, Order Blocks, BOS/CHoCH,   Breaker Blocks ,  Momentum Shift,   Supply&Demand Zone/Order Blocks , Strong Imbalance,   HH/LL/HL/LH,    Fair Value Gap, FVG,  Premium  &   Discount   Zones, Fibonacci Retracement, OTE, Buy Side Liquidity, Sell Side Liquidity, BSL/SSL Taken, Equal Highs & Lows, MTF Dashboard, Multiple Time Frame, BigBar, HTF OB, HTF Market Structure
Matrix Arrow Indicator MT5
Juvenille Emperor Limited
5 (12)
矩阵箭头指标 MT5   是一种独特的 10 合 1 趋势,遵循   100% 非重绘多时间框架指标 ,可用于所有符号/工具: 外汇 、 商品 、 加密货币 、 指数 、 股票 。 Matrix Arrow Indicator MT5 将在其早期阶段确定当前趋势,从多达 10 个标准指标中收集信息和数据,它们是: 平均定向运动指数 (ADX) 商品渠道指数 (CCI) 经典 Heiken Ashi 蜡烛 移动平均线 移动平均收敛散度 (MACD) 相对活力指数 (RVI) 相对强弱指数 (RSI) 抛物线SAR 随机振荡器 威廉姆斯的百分比范围 当所有指标给出有效的买入或卖出信号时,相应的箭头将打印在图表上,在下一根蜡烛/柱线开盘时,指示强劲的上升趋势/下降趋势。用户可以选择使用哪些指标,并可以单独调整每个指标的参数。 Matrix Arrow Indicator MT5 仅从选定的指标中收集信息,并仅根据其数据打印箭头。   Matrix Arrow Indicator MT5   还可以为所有新信号发送终端、推送通知或电子邮件警报。无论您是黄牛、日内交易者还是波段交易者, Mat
FX Volume MT5
Daniel Stein
4.93 (14)
通过 mql5 和 Telegram 上 的 " 晨间简报 "获取每日市场更新,包括详细信息和屏幕截图 ! 外汇交易量(FX Volume)是第一个也是唯一一个从经纪商角度真正洞察市场情绪的交易量指标。 直接在您的图表上看到这些信息是真正改变游戏规则和突破性的交易解决方案。 受益于独特的市场数据洞察,如 比率(Ratios )显示货币多头和空头头寸的比率(百分比 比率变化 显示所选时间段内的多头比率及其百分比变化 总交易量 显示货币的总交易量(多头和空头),以手为单位 多头 交易量显示货币所有多头头寸的交易量 空头 交易量显示所有货币空头头寸的交易量 净多头 显示净多头交易量,即所有多头头寸减去所有空头头寸(以手为单位)。 净多头百分比 显示货币净多头交易量的变化 请阅读我们的基本教程 -> "如何使用外汇交易量进行交易 " 获取更多信息,如常见问题、交易技巧和教程视频,请访问我们的 外汇交易量公共信息频道 请 安装并运行 SI Connect 以建立与我们数据中心的持续连接 背景信息 我们都知道,外汇是一个分散的市场。这就是为什么我们必须打破常规思维,开发一个独
介绍     Quantum Breakout PRO   ,突破性的 MQL5 指标,正在改变您交易突破区域的方式!由拥有超过13年交易经验的资深交易员团队开发,     量子突破 PRO     旨在通过其创新和动态的突破区域策略将您的交易之旅推向新的高度。 量子突破指标将为您提供带有 5 个利润目标区域的突破区域的信号箭头,以及基于突破框的止损建议。 它既适合新手交易者,也适合专业交易者。 量子 EA 通道:       点击这里 重要的!购买后请私信我领取安装手册。 建议: 时间范围:M15 货币对:GBPJPY、EURJPY、USDJPY、NZDUSD、XAUUSD 账户类型:ECN、Raw 或 Razor,点差极低 经纪商时间:GMT +3 经纪商:IC Markets、Pepperstone with Raw 和 Razor 的点差最低 规格: 不重漆! 最多 5 个建议利润目标区域 建议止损水平 可定制的盒子。您可以设置自己的 Box Time Start 和 Box Time End。 接触 如果您有任何疑问或需要帮
Trend Forecaster
Alexey Minkov
5 (6)
The Trend Forecaster indicator utilizes a unique proprietary algorithm to determine entry points for a breakout trading strategy. The indicator identifies price clusters, analyzes price movement near levels, and provides a signal when the price breaks through a level. The Trend Forecaster indicator is suitable for all financial assets, including currencies (Forex), metals, stocks, indices, and cryptocurrencies. You can also adjust the indicator to work on any time frames, although it is recommen
Auto Order Block with break of structure based on ICT and Smart Money Concepts (SMC) Futures Break of Structure ( BoS )             Order block ( OB )            Higher time frame Order block / Point of Interest ( POI )    shown on current chart           Fair value Gap ( FVG ) / Imbalance   -  MTF      ( Multi Time Frame )    HH/LL/HL/LH  -  MTF      ( Multi Time Frame )  Choch  MTF      ( Multi Time Frame )  Volume Imbalance     ,  MTF          vIMB Gap’s Power of 3 Equal High
Gartley Hunter Multi
Siarhei Vashchylka
5 (8)
Gartley Hunter Multi - An indicator for searching for harmonic patterns simultaneously on dozens of trading instruments and on all possible timeframes. Manual (Be sure to read before purchasing) | Version for MT4 Advantages 1. Patterns: Gartley, Butterfly, Shark, Crab. Bat, Alternate Bat, Deep Crab, Cypher 2. Simultaneous search for patterns on dozens of trading instruments and on all possible timeframes 3. Search for patterns of all possible sizes. From the smallest to the largest 4. A
Entry Points Pro for MT5
Yury Orlov
4.46 (124)
这款指标用于 MT5,可提供准确的入场交易信号,且无重绘。 它可应用在任何金融资产:外汇、加密货币、贵金属、股票、指数。 它将提供极其精准的评估,并告诉您何时开仓和平仓的最佳时机。 观看 视频 (6:22),其中包含一个仅处理单一信号的示例,该信号即可值回指标购价! 大多数交易者在 Entry Points Pro 指标的帮助下,在第一个交易周内即改善了他们的交易结果。 订阅我们的 Telegram 群 ! Entry Points Pro 指标的益处。 入场信号无重绘 如果信号出现,并得到确认,则它不会再消失;不像是重绘指标,它会导致重大的财产损失,因为它们可以在显示信号后再将其删除。 无差错开仓 指标算法可令您找到入场交易(买入或卖出资产)的理想时机,从而提高每位交易者的成功率。 Entry Points Pro 可操作任何资产 它允许您在 MT5 平台上交易任何经纪商的加密货币、股票、贵金属、指数、大宗商品和货币。 提供任何方向的信号 Entry Points Pro 指标提供针对任意价格走势的入场交易信号 - 上涨、下跌或横盘(横向)。
Advanced Currency Strength28 MT5
Bernhard Schweigert
5 (1)
任何新手或专家交易者的最佳解决方案! 这个指标是一个独特的、高质量的、可负担得起的交易工具,因为我们纳入了一些专有的功能和一个新的公式。只需一个图表,你就可以读出28个外汇对的货币强度!想象一下,你的交易将如何得到改善,因为你的交易是在你的手中进行的。想象一下,你的交易将如何改善,因为你能够准确地确定新趋势或剥头皮机会的触发点? 用户手册:点击这里  https://www.mql5.com/en/blogs/post/697384 这是第一本,原版的! 不要买一个毫无价值的崇拜者的克隆品。 特别的 子窗口中的箭头显示强劲的货币势头GAP将指导你的交易! 当基础货币或报价货币处于超卖/超买区域(外盘斐波那契水平)时,在个人图表的主窗口中出现警告信号。 当货币力量从外围区间回落时,回撤/反转警报。 十字星模式的特别警报 可选择多个时间框架,以快速查看趋势! 货币强度线在所有的时间框架中都非常平稳,当使用较高的时间框架来识别总体趋势,然后使用较短的时间框架来确定精确的入口时,效果非常好。你可以根据自己的意愿选择任何时间框架。每个时间框架都由其自身进行了优化。 建立在
Stratos Pali mt5
Michela Russo
5 (1)
Stratos Pali Indicator is a revolutionary tool designed to enhance your trading strategy by accurately identifying market trends. This sophisticated indicator uses a unique algorithm to generate a complete histogram, which records when the trend is Long or Short. When a trend reversal occurs, an arrow appears, indicating the new direction of the trend. Important Information Revealed Leave a review and contact me via mql5 message to receive My Top 5 set files for Stratos Pali at no cost ! Do
Quantum Heiken Ashi PRO MT5
Bogdan Ion Puscasu
4.44 (9)
Quantum Heiken Ashi PRO 简介 Heiken Ashi 蜡烛旨在提供对市场趋势的清晰洞察,以其过滤噪音和消除虚假信号的能力而闻名。告别令人困惑的价格波动,迎接更流畅、更可靠的图表表示。 Quantum Heiken Ashi PRO 的真正独特之处在于其创新公式,它将传统烛台数据转换为易于阅读的彩色条。红色和绿色条分别优雅地突出了看跌和看涨趋势,让您能够以非凡的精度发现潜在的进入和退出点。 量子 EA 通道:       点击这里 MT4版本:       点击这里 这一卓越的指标具有以下几个关键优势: 增强清晰度:通过平滑价格波动,Heiken Ashi 金条可以更清晰地反映市场趋势,使您更容易识别有利的交易机会。 减少噪音:告别经常导致错误信号的不稳定价格变动。 Quantum Heiken Ashi 指标可过滤噪音,使您能够做出更明智的交易决策 无缝集成:Heiken Ashi 指标专为 MetaTrader 开发,可无缝集成到您的交易平台中。它用户友好、高度可定制,并且与您的其他交易指标和过滤器兼容 无论您是寻求新优势的经验丰富的交易者,
Trend Line Map Pro MT5
STE S.S.COMPANY
4.09 (11)
趋势线图指标是趋势筛选器指标的插件。它用作趋势筛选器(趋势线信号)生成的所有信号的扫描仪。 它是基于趋势筛选器指标的趋势线扫描仪。如果您没有 Trend Screener Pro Indicator,Trend Line Map Pro 将无法使用。 It's a Trend Line Scanner based on Trend Screener Indicator. If you don't have Trend Screener Pro Indicator,     the Trend Line Map Pro will not work . 通过访问我们的 MQL5 博客,您可以下载趋势线图指标的免费版本。购买前试用,不受 Metatrader Tester 限制。 :  点击这里 1. 容易获得的优势 根据货币和时间范围显示买入和卖出信号。 评估自图表中出现箭头以来价格上涨或下跌的点数。 (趋势筛选指标箭头) 显示信号的时序。 获取多时间范围和多货币警报以购买和出售警报。 2. 如何使用趋势线图 如何显示买卖信号仪表板? 如果您有任何问题或需
Golden Spikes Premium
Kwaku Bondzie Ghartey
5 (1)
Golden Spikes Detector Acknowledgement and Dedications:  The name of this indicator was Inspired by an Original; Mr Grant Koopman; a Knowledgeable and experienced Synthetics trader. I dedicate this indicator to Mr Grant.  Overview: The Golden Spikes Premium is a groundbreaking trading indicator meticulously crafted for the Boom and Crash indices on the Deriv market. Tailored to meet the needs of discerning traders, this powerful tool operates exclusively on the one-minute timeframe, providin
Royal Scalping Indicator M5
Vahidreza Heidar Gholami
5 (6)
Royal Scalping Indicator is an advanced price adaptive indicator designed to generate high-quality trading signals. Built-in multi-timeframe and multi-currency capabilities make it even more powerful to have configurations based on different symbols and timeframes. This indicator is perfect for scalp trades as well as swing trades. Royal Scalping is not just an indicator, but a trading strategy itself. Features Price Adaptive Trend Detector Algorithm Multi-Timeframe and Multi-Currency Trend Low
AT Forex Indicator MT5
Marzena Maria Szmit
5 (4)
The AT Forex Indicator MT5 is a sophisticated trading tool designed to provide traders with a comprehensive analysis of multiple currency pairs. This powerful indicator simplifies the complex nature of the forex market, making it accessible for both novice and experienced traders. AT Forex Indicator uses advanced algorithms to detect trends, patterns and is an essential tool for traders aiming to enhance their forex trading performance. With its robust features, ease of use, and reliable signal
TrendMaestro5
Stefano Frisetti
note: this indicator is for METATRADER4, if you want the version for METATRADER5 this is the link:  https://www.mql5.com/it/market/product/108106 TRENDMAESTRO ver 2.4 TRENDMAESTRO recognizes a new TREND in the bud, he never makes mistakes. The certainty of identifying a new TREND is priceless. DESCRIPTION TRENDMAESTRO identifies a new TREND in the bud, this indicator examines the volatility, volumes and momentum to identify the moment in which there is an explosion of one or more of these data a
作者的更多信息
Robust median Renko style indicator for creating custom charts resembling Median Renko, Mean Renko, Turbo Renko and Better Renko candles as well as vanilla Renko with wicks plus Point-O charts. This all in one package provides all of the signals needed by day traders, scalpers, and even long-term traders. Main characteristics The indicator is an overlay on the main chart so it is possible to utilize one-click trading and order manipulation directly on the custom charts. Visual order placement
Create and trade timeframes in seconds. The bar time duration is freely adjustable from 1 second and up. The chart is accurately constructed using real ticks from the broker's server. Main characteristics The indicator is an overlay on the main chart, making it possible to utilize one-click trading and on-chart order manipulation. History calculated using real tick data. Built-in technical studies: 4 moving averages (Simple, Exponential, Smooth, Linear-weighted, Volume-weighted using tick or rea
Professional renko charting on a custom symbol chart accurate pricing to the tick  accurate timeline (no future date projections ) every renko variation in a single package very responsive charts optional display of live trade levels on the chart An Expert Advisor (EA) used to create custom Renko charts and provide real-time updates. This is an MT4 "offline" chart equivalent which is very simple to use. All historical renkos are constructed using real tick data from the broker's server.
Ultimate Renko
Artur Zas
4.62 (13)
Ultimate Renko is a full implementation of a robust Renko style charting solution for MT4. It enables creating custom live charts resembling Median Renko , Mean Renko , Turbo Renko , and Better Renko candles as well as Vanilla Renko and Renko with wicks , PointO charts, and many more. This all-in-one package provides all of the signals needed by day traders, scalpers, and even long-term traders. You can apply all of the standard and custom indicators and technical studies as well as templates to
Robust trading panel for use on any symbol (including RangeBars or Renko custom symbols). The tool can be placed anywhere on the chart and offers the following array of features: One-click instant order entry. Pending order entry using horizontal lines on the chart Pending order entry using keys in Entry price (E/P) and optional Stop Loss (S/L) and/or Take Profit (T/P) A choice between fixed trading volume or risk-based volume calculation based on the available account equity, entry price, and t
Range Bars
Artur Zas
4.2 (5)
The robust charting solution enables creating custom live range bar charts on the MetaTrader 4 trading platform. You can apply all of the standard and custom indicators and technical studies directly to the range bar charts and you can run EAs directly on these charts as well* (for details see text below the input summary). To create a range bar chart you need to attach the Range Bar indicator to a standard time frame (1 minute is recommended) and use the indicator's settings to generate a live
Professional range bar charting on a custom symbol chart accurate pricing to the tick  accurate timeline (no future date projections) very responsive charts An Expert Advisor (EA) is used to create a RangeBar custom chart and provide real-time updates. It is an MT4 "offline" range bars chart equivalent. The simplicity of use - Attach the EA to any time-based chart that you wish to see Range Bars for, input your desired parameters and you are ready to go! You can attach any MT5 compatible indicat
A utility used to create custom Tick or Volume bar charts and provide real-time updates. This is an MT4 "offline" chart equivalent which is very simple to use. You can attach any MT5 compatible indicator or template to the tick chart and perform your technical analysis. Tick charts measure the number of transactions per bar. You can choose any number of ticks per bar but most traders choose Fibonacci numbers (1, 2, 3, 5, 8, 13, 21, 34, 55, 89, 144, 233...). The generator uses tick data to plot
A countdown timer for the  Volume bar chart generator  and  Tick chart generator  products, which are available for download from the MQL5 Market: Tick chart generator: https://www.mql5.com/en/market/product/29215 Volume bar chart generator: https://www.mql5.com/en/market/product/47197 The counter conveniently displays the number of ticks or transactions (depending on the chart) that need to pass for a new bar to start printing. The user can set the following indicator inputs. Volume type
FREE
Range Bars Charting
Artur Zas
2.5 (4)
Range Bars for MetaTrader 5 is a unique tool for conducting technical analysis directly on the charts, as the indicator is an overlay on the main chart and range bars are calculated using real tick data. The trader can place and modify orders directly on the range bar chart (even with the use of one-click trading). Apart from range candles, the indicator also includes the most commonly used technical studies which are 3 moving averages (Simple, Exponential, Smooth, Linear-weighted, Volume-weight
X Tick Chart
Artur Zas
4.75 (8)
The indicator combines the features of both the Tick charts and Volume Bar charts. The mode can be selected in the indicator's settings. Tick charts measure the number of transactions per bar. To give you an example if you have a 233 tick chart, each bar measures 233 transactions per bar and a new bar is plotted after 233 transactions. You can choose any number of ticks per bar but most traders choose Fibonacci numbers (1, 2, 3, 5, 8, 13, 21, 34, 55, 89, 144, 233...). Volume bar charts are desi
The extreme volume indicator helps identify turning points in the market by pinpointing spots of higher than average volume. Such points usually indicate the start of a trend or a turning point in the market. The indicator averages out volume readings over an extended period of time and calculates a volume threshold level. When this level is breached, it identifies the most likely trend direction using the trend of the candle that breached the volume threshold. The direction indicator (red or gr
CMI - Profit from trending and ranging markets. The CMI indicator is a two-part system used to trigger both trend and counter-trend trades, that has been introduced by Daniel Fernandez in an article published in Currency Trading Magazine (August 2011 issue). It is a simple, yet effective indicator, which gauges whether the market has behaved in a choppy (non-directional) manner or trending (directional) manner. CMI calculates the difference between the most recent bar's close and the close n bar
The trend scalper candles are used to identify short-term trends based on the readings of the MACD, RSI and ATR indicators. All indicator calculations are visualized by candle colors which are overlapped on the chart. The indicator uses gray , green and red colors to paint individual candles, which gives you a lot of useful and easy to read information. Gray candles Gray candles indicate a range bound period and the information can be used to trade breakouts. Simply mark the high and low of th
The professional line break chart generator is used to create live line break charts (i.e. 3 line break ). The chart is plotted using MT4's offline charging facility thus making it possible to trade* directly from the chart as well as attach any of the standard or custom indicators to perform technical analysis. The line break chart can be displayed as the most widely used 3 line break chart or a custom variation such as 2 or 5 line break chart . Wicks can be displayed or hidden on the chart - t
The Trade Tracker Library is used to automatically detect and display trade levels on custom charts. It is an especially useful add-on for EAs that trade on custom charts in MT5. With the use of this library, the EA users can see trades as they are placed via the EA (Entry, SL & TP levels) in real-time. The header file and two examples of EA skeleton files are attached in the comments section (first comment). The library will automatically detect the tradable symbol for the following custom
筛选:
无评论
回复评论
版本 2.5 2021.07.28
Bug fixes and code maintenance release.
版本 2.4 2021.05.17
Added duration & range info to data window.
版本 2.3 2021.05.12
Bugfix version
版本 2.2 2021.05.11
Fixed compatibility with StereoTrader when "Shift objects with chart" is set to YES;
Optimized indicator inputs.
版本 2.1 2021.05.06
Fixed MA cross alert bug when the MAs used the shift parameter
版本 2.0 2021.04.23
Added 4 MAs
Added channel indicator
Added pivots
Added alerts
Minor bug fixes
版本 1.1 2020.06.16
Recompiled for better compatibility with the latest MT5 builds