• 概述
  • 评论 (1)
  • 评论 (3)
  • 新特性

Corporate Report

5

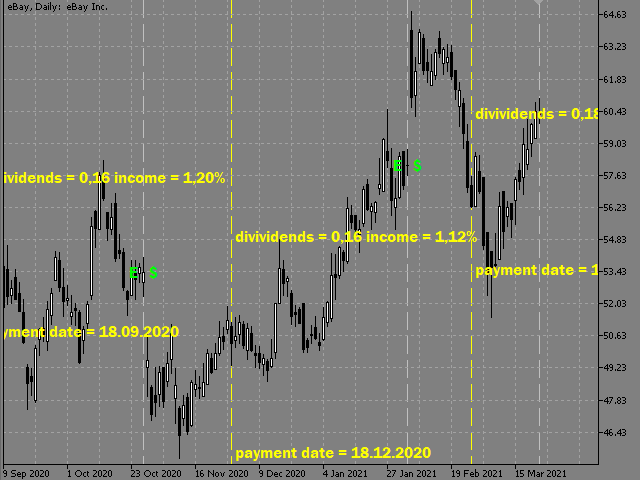
The script displays info about the share's corporate reports and dividends. The data is downloaded from investing.com:

  • Report date
  • Profit per share (EPS)
  • Revenue
  • Market capitalization
  • Amount of dividends
  • Date of payment of dividends
  • Dividend income
The product cannot be tested in the tester (since it is not possible to receive data from the Internet).

Before launching: 
Add 2 URL https://ru.investing.com/earnings-calendar/Service/getCalendarFilteredData and https://ru.investing.com/dividends-calendar/Service/getCalendarFilteredData to the list of allowed URLs. Options -> Expert Advisors -> enable "Allow WebRequest for listed URL".


The program works the following way:

  • Searches for information on the ticker on which the program is running.
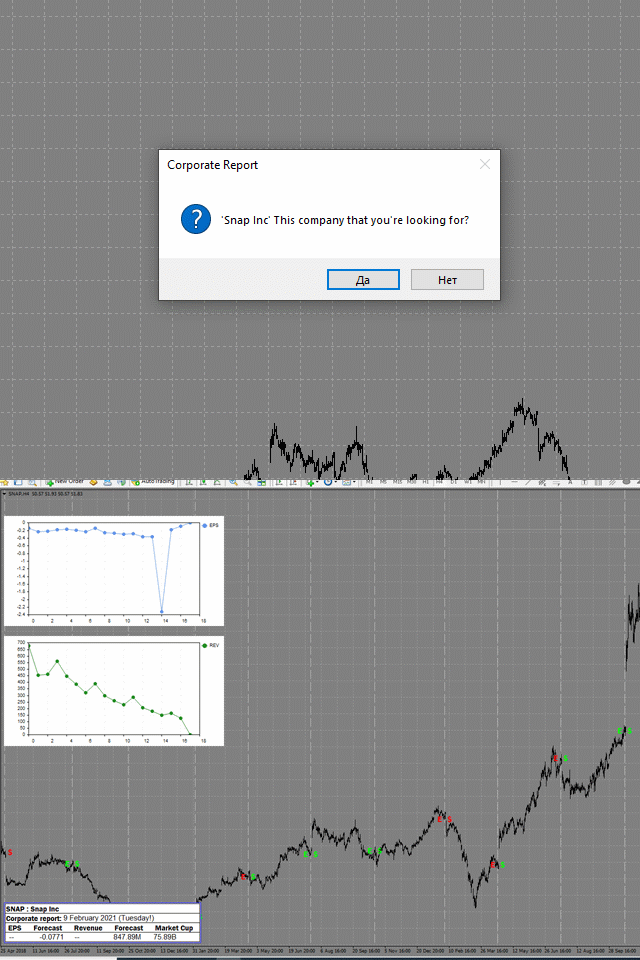
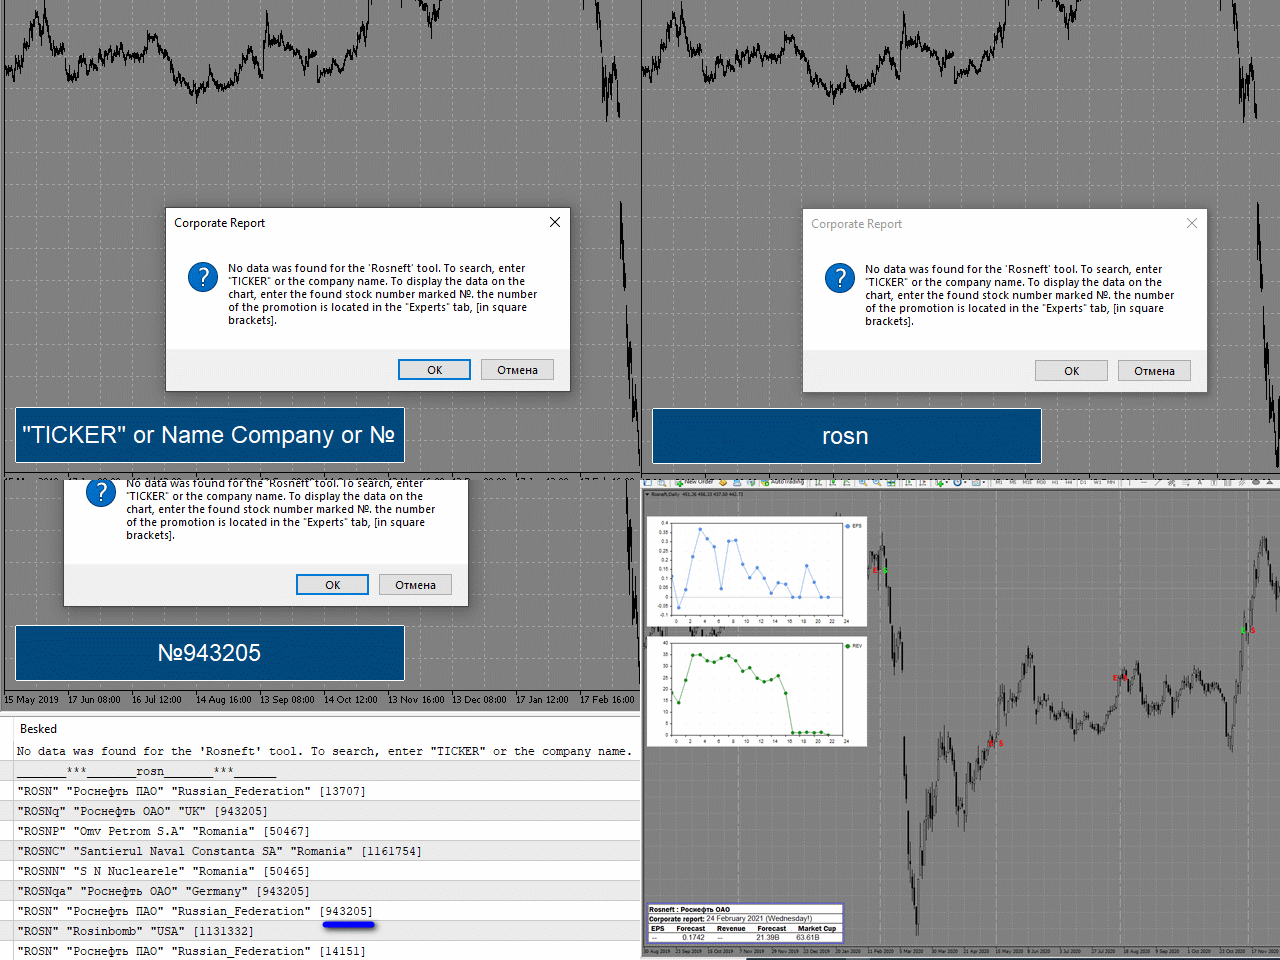
    If the data is not found, it offers to use the search.
    Search by ticker - the ticker must be written in quotation marks, for example: "BA" or "ba".
    Search by company name - the company name should be written without quotation marks, for example: Apple or ford.
    All found options are displayed in the "Experts" tab.
    To display data on the chart, you need to enter the found number from the Experts tab (which is in square brackets) with the sign # for example: № 241 or #241.
    The numbers you have entered are remembered.
    if you want to change the previously selected number, then when the program asks "is this the right company?", you need to click no, and then find and enter a new number.
    to clear all pinned numbers, delete the "Custom Ticker List" file at the path "MQL5\Files\Corporate Report".
  • While searching for information, the background of the graph changes color to blue.
  • Plotting vertical lines corresponding to dates of the published reports about a dividends.
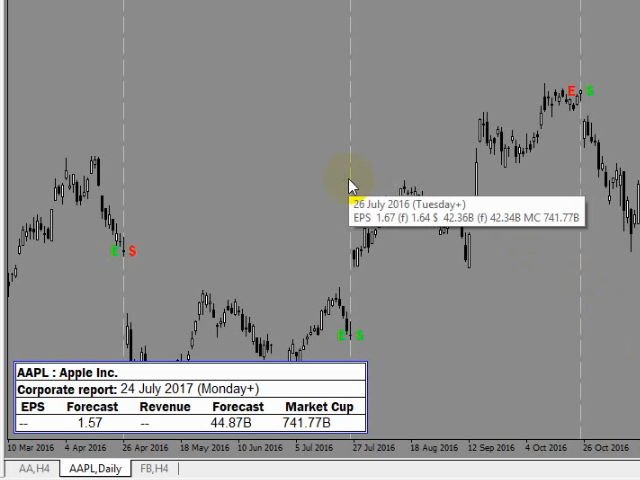
  • Plotting vertical lines corresponding to dates of the published corporate reports. The tooltip of each of the lines contains data on the appropriate corporate report.
    • The E and $ marks are assigned to vertical lines:
    • if EPS value exceeds the forecast, the green E mark is used,
    • if expectations are not met, the red one is used;
    • if Revenue exceeds the forecast, the green $ mark is used,
    • if expectations are not met, the red one is used.
  • The table at the bottom left displays: the ticker (on which the program has been launched) and company name (corresponds to the one downloaded from the website),
    date and info on the expected report as well as the one published not earlier than 5 days ago.
    (5 days after releasing the report, it is moved to the chart as a vertical line and a search for the next report date starts.)
  • The +, - and ! marks at the report date specify the report issue time as follows:
    • Report issue:
    • - Before the market opening,
    • + After the market closure,
    • ! No data.
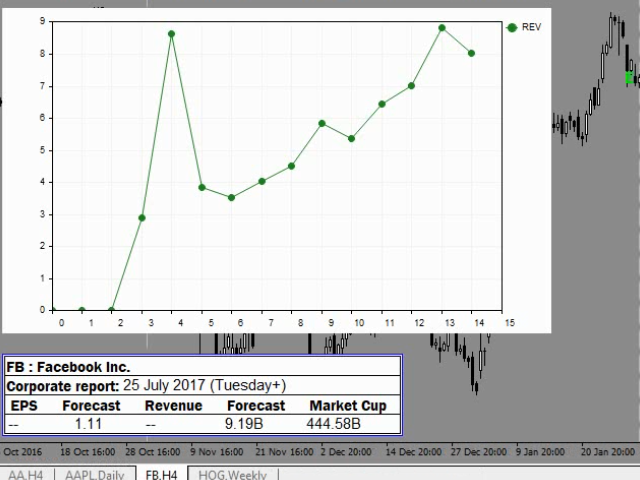
  • Company indicator graphs are displayed on the chart (EPS and Revenue $). The graphs are plotted based on the downloaded reports and data present in the downloaded reports. If some report is missing on the website, the graph is based on available ones. If some indicator is missing in the downloaded report, its value is assumed to be zero on the graph. The graphs can be moved or deleted. Reports located in the table at the bottom left are not considered by the graphs. Only the ones displayed as horizontal lines on the chart are considered instead.
  • The program works in English and Russian.

List of instruments (shares, stock, CFD, ADR) the program works with: 18 054 tickers; The list contains tickers of 80 countries.
The monitor vertical resolution of 900 or more is recommended when using the program for more comfortable trading.

The program and all the information used in it depend on the site investing.com and they work as long as it is possible to get information programmatically from the specified links.
For more convenience, assign a hotkey to the script: right-click "Corporate Report" in the Navigator window -> Set hotkey -> select a suitable combination.
    评论 1
    mambobody
    462
    mambobody 2022.04.19 10:44 
     

    very good product

    推荐产品
    Success comes from knowledge – this is true for most things in life and especially Forex trading. To become successful, a trader needs to learn technical analysis. Technical indicators are a big part of technical analysis. The problem is that, at first sight, names of technical indicators can sound unpleasantly complicated, for example, MACD, RSI or Stochastic. However, we recommend you not to judge a book by its cover. We will provide you with a fair and simple explanation of the most popular t
    实盘交易盈利,回测年化125%,回撤25%,交易量少,不是经常下单,挂起后要有耐心。没有多牛的技术,只是一套简单的交易策略,贵在长期坚持,长期执行。我们有时候就是把自己高复杂,想想我们交易的历程,你就会发现,小白好赚钱,当你懂得越多的时候也是亏损的开始,总是今天用这个技术,明天用那个指标,到头来发现,没有一个指标适合你。其实每个技术指标都是概率性的,没有100%的胜率。很多技术指标你要融合一套交易策略,资金仓位控制,止损止盈比例,一套策略下来下一步你做的就是执行力了,必须要坚决执行你的交易策略,如果不能坚持的话最终还是在亏损。说实话不是每个人都有好的心态和执行力,所以我们做出来这款ea自己来用,发现时间久了扭亏为盈了,那现在就拿出来给大家分享,让更多的人来达到自己的盈利目标。购买后留下邮箱或添加软件里的qq,我们会根据你的资金来调整软件参数。 经测试过的柱数 14794 用于复盘的即时价数量 51321985 复盘模型的质量 n/a 输入图表错误 213935 起始资金 10000.00 点差 当前 (54) 总净盈利 12583.42 总获利 37630.02 总亏损 -25046.
    Magic Reversion Indicator
    Giordano Bruno Rodrigues Machado
    Indicator that indicate where the best point of reverse market.This indicator is a reactive or lagging signal, because the strategy uses a formation of an odd number of bars being the middle bar the highest or lowest in the formation, and the indicator draws when the all bars in the fractal close. However, traders with a pre-existing directional bias will find this indicator extremely useful, picking up early entry points.This indicator is not a boiled-down signals indicator nor a complete tradi
    The indicator detects and displays М. Gartley's Butterfly pattern. The pattern is plotted by the extreme values of the ZigZag indicator (included in the resources, no need to install). After detecting the pattern, the indicator notifies of that by the pop-up window, a mobile notification and an email. The pattern and wave parameters are displayed on the screenshots. The default parameters are used for demonstration purposes only in order to increase the amount of detected patterns. Parameters
    Introduction to X3 Chart Pattern Scanner X3 Cherart Pattern Scanner is the non-repainting and non-lagging indicator detecting X3 chart patterns including Harmonic pattern, Elliott Wave pattern, X3 patterns, and Japanese Candlestick patterns. Historical patterns match with signal patterns. Hence, you can readily develop the solid trading strategy in your chart. More importantly, this superb pattern scanner can detect the optimal pattern of its kind. In addition, you can switch on and off individu
    Trend Catcher with Alert
    Issam Kassas
    4.72 (54)
    趋势捕捉器: 具有警示指标的趋势捕捉器策略是一种多功能的技术分析工具,可帮助交易员识别市场趋势和潜在的进出点。它采用动态趋势捕捉器策略,根据市场条件进行调整,清晰地呈现趋势方向。交易员可以自定义参数,以符合其偏好和风险容忍度。该指标有助于识别趋势,发出潜在的反转信号,充当跟踪止损机制,并提供实时警报,以便及时应对市场。 具有警示指标的趋势捕捉器策略是一种多功能的技术分析工具,可帮助交易员识别市场趋势和潜在的进出点。它采用动态趋势捕捉器策略,根据市场条件进行调整,清晰地呈现趋势方向。交易员可以自定义参数,以符合其偏好和风险容忍度。该指标有助于识别趋势,发出潜在的反转信号,充当跟踪止损机制,并提供实时警报,以便及时应对市场。 特点: 趋势识别:信号牛市趋势和熊市趋势。 趋势反转:当蜡烛颜色从牛市变为熊市,反之亦然时,提醒可能的反转。 实时警报:为新趋势识别生成警报。 建议: 货币和货币对:EURUSD,AUDUSD,XAUUSD... 时间框架:H1。 账户类型:任何ECN,低点差账户。
    FREE
    Canadian Taiga
    Charbel Abboud
    CANADIAN TAIGA是一个专业的投资组合EA,使用趋势跟踪交易系统,基于波动率突破和突破支撑/阻力位的原则。它适用于所有加拿大元货币对。CANADIAN TAIGA的核心原则是利用复杂的对冲模块,在所有加元货币对上捕捉交易机会。 下载CANADIAN TAIGA并按照建议在所有加元货币对上进行测试,如果它没有达到描述的预期效果,请不要购买它。不要太担心高的建模质量,因为它主要在最低的时间框架(M5)上工作。 非常重要的是,强烈建议您在图表上启动EA,同时禁用自动交易按钮,并在初始化后重新启用自动交易,或者您可以在市场时间以外的图表上激活它,最好是在周末,因为EA可能而且很可能在初始化时执行一次快速的单一交易(立即开仓和平仓),以进行快速执行质量测试。然而,该交易将以最小的手数0.01执行,因此用户将花费几分钱作为佣金。 请记住,任何交易系统的性能都受到经纪商条件的高度限制 - 甚至不要想在随机的经纪商上尝试 - 只在知名的真正的ECN经纪商上尝试,他们的点差小,佣金低。        推荐的时间框架。 M5.        支持所有加元对(USDCAD, CADJ
    The professional utilities "Ichimoku Waves Meter" to analyse graphs using the correct interpretation of Ichimoku kinkōhyō! Is a graphic program that allows traders to quickly and easily measure the proportions between the indicated points on the price graph. This time and price indicator is a basic tool for analysing the chart according to the Ichimoku strategy on the MT4 platform. Using this tool allows an insightful and complete analysis of time waves as well as price waves in a very short t
    PairSync
    Sergio D. Rocha
    This is an utility created as a technical indicator, that helps you to sync more than one chart with the same pair. Intended as a complement for the MarketPatroller indicator. Add this indicator to a chart in your profile (this will be used as a master chart) and add a Text Label (T boxed icon) in name of each chart you want to sync with "SyncPair" and the time frame that you want to use in the synchronized chart, and each time you change the pair in the master chart, SyncPair will change the pa
    Gold Phoenix
    Yaroslav Varankin
    The perfect tool for Scalng in the Forex markets You can trade both from signal to signal and using take profit  The algorithm does not use Zigzag!  No redrawing!  This is a channel instrument that uses a moving average as a filter. Moving Average  There are 2 parameters for the settings Ma Period = 5 period Moving Average  Channel 1.0 distance of channel lines from the chart Price Signal Filter - calculation of signal opening and filter There is a complete set of Alert There is a multi-timefram
    Anubis Skunk
    Sayan Vandenhout
    Anubis Skunk USES THE TREND WAVE INDICATOR AND IT CAN IDENTIFY THE BEGINNING AND THE END OF A NEW WAVE TREND MOVEMENT. AS AN OSCILLATOR, THE INDICATOR IDENTIFIES THE OVERBOUGHT AND OVERSOLD ZONES. IT WORKS GREAT TO CATCH THE SHORT TERM PRICE REVERSALS AND USES A MARTINGALE STRATEGY TO CLOSE ALL TRADES IN PROFIT. USE DEFAULT SETTINGS ON H1 OR HIGHER TIME FRAME ON ANY PAIR FOR MORE ACCURATE TRADES WHY THIS EA : Smart entries calculated by 5 great strategies The EA can be run on even a $
    Vanglutio
    Sayan Vandenhout
    VANGLUTIO USES THE TREND WAVE INDICATOR AND IT CAN IDENTIFY THE BEGINNING AND THE END OF A NEW WAVE TREND MOVEMENT. AS AN OSCILLATOR, THE INDICATOR IDENTIFIES THE OVERBOUGHT AND OVERSOLD ZONES. IT WORKS GREAT TO CATCH THE SHORT TERM PRICE REVERSALS AND USES A MARTINGALE STRATEGY TO CLOSE ALL TRADES IN PROFIT. USE DEFAULT SETTINGS ON H1 OR HIGHER TIME FRAME ON ANY PAIR FOR MORE ACCURATE TRADES WHY THIS EA : Smart entries calculated by 5 great strategies The EA can be run on even a $200
    This is an arrow indicator without a future function,developed based on the most advanced profit trading algorithms.It has the most innovative and advanced dual trend analysis module, as well as the latest and highly effective market trend prediction algorithm.Trends are your friends, and following larger trends can earn the maximum profit in foreign exchange. This indicator helps traders identify current trends and track them. Someone once made a profit of 10 times in a week by relying on it.No
    Scalp Master is a very simple and smooth operation system that is designed to help traders facilitate trading and risk management. No Keyboard need to make, take profit or close orders. Every orders parameters are created automatically based on predefined risk and your strategy lines. Such parameters appear friendly on the screen and you just need 1 click to convert to order. The unique algorithm prevent common missed and hit taking profit strategy. Instead of very subjective partial closed by u
    NewsReady
    Joel Protusada
    NewsReady is a semi-automated Expert Advisor that uses a smart straddle methods It needs to be set in charts 2 to 10 minutes before Economic Data release with a red-flag impact on currencies related to the news. Then it run pending orders in specified number of minutes indicated in the time-period parameter. After the specified time, it will stop trading and will remove all pending orders. Important You can not backtest this tool because it is semi-automated and can only be set and run a few mi
    Trend Ray
    Andriy Sydoruk
    The indicator shows the potential trend direction by cyclical-wave dependence. Thus, all the rays of the intersection will be optimal rays, in the direction of which the price is expected to move, taking into account the indicator period. Rays can be used as a direction for potential market movement. But we must not forget that the approach must be comprehensive, the indicator signals require additional information to enter the market.
    Free automatic fibonacci
    Tonny Obare
    4.66 (47)
    Free automatic Fibonacci is an indicator that automatically plots a Fibonacci retracement based on the number of bars you select on the BarsToScan setting in the indicator. The Fibonacci is automatically updated in real time as new highest and lowest values appears amongst the selected bars. You can select which level values to be displayed in the indicator settings. You can also select the color of the levels thus enabling the trader to be able to attach the indicator several times with differe
    FREE
    该指标建立了趋势线的扇形(在单击某个蜡烛之后),类似于经典的江恩角。该指标的特点是它不仅在固定比例上构建角度,而且还使用一定数量柱线的平均价格(可选)。 有两种方法可以计算指标中角度的平均价格(可选): 1) 计算从高到低的平均价格变动(对于一定数量的柱); 2) 计算从开盘到收盘的平均价格变动; 选项: 1.Method——构造角的方法; 2. FixedScale - 固定比例(如果在Method中选择了Fixed_Scale); 3. SecondaryAngles - 控制绘制次角的权限; 4. RayRight - 为趋势线设置射线; 5. DrawBackground - 画线作为背景; 6. AnglesQuantity——角度数; 7. Bars_To_Process - 周期,柱的数量,在此基础上确定平均价格,角度的“速度”。如果为零或更低,则根据所有历史数据计算; 8. RisingMainAnglesClr、RisingSecondaryAnglesClr、FallingMainAngle
    Market Profile 3
    Hussien Abdeltwab Hussien Ryad
    3 (2)
    Market Profile 3 MetaTrader 4 indicator  — is a classic Market Profile implementation that can show the price density over time, outlining the most important price levels, value area, and control value of a given trading session. This indicator can be attached to timeframes between M1 and D1 and will show the Market Profile for daily, weekly, monthly, or even intraday sessions. Lower timeframes offer higher precision. Higher timeframes are recommended for better visibility. It is also possible t
    FREE
    Mongol Indicator2
    Sumiyabazar Buyanjargal
    It's a variation of mid of HH and LL since it compares the higher of HH or LL against a period and twice the number of bars back to avoid whipsaws. I used to display this against lines on a chart, but made a histogram out of it and it looks interesting. It looks good at gauging trend strength and general turns (see image below). The name of the indicator is BAM, which is an acronym for "Below and Above Mid". Ways to use it: 1. To see general trend on longer TFs (more than 30 ba
    VR Cub
    Vladimir Pastushak
    VR Cub 这是获得高质量切入点的指标。该指标的开发是为了促进数学计算并简化对仓位入场点的搜索。多年来,该指标所针对的交易策略已被证明其有效性。交易策略的简单性是其巨大的优势,即使是新手交易者也能成功进行交易。 VR Cub 计算开仓点以及获利和止损目标水平,这显着提高了效率和易用性。查看使用以下策略进行交易的屏幕截图,了解简单的交易规则。 设置、设置文件、演示版本、说明、问题解决,可以从以下位置获取 [博客] 您可以在以下位置阅读或撰写评论 [关联] 版本为 [MetaTrader 5] 计算入场点的规则 开仓 要计算入场点,您需要将 VR Cub 工具从最后一个高点拉伸到最后一个低点。 如果第一个点在时间上早于第二个点,交易者等待柱线收于中线上方。 如果第一个点在时间上晚于第二个点,交易者等待柱线收于中线下方。 根据上述条件,严格在 柱线收盘 后建仓。 换句话说,如果我们在小时图上进行交易,那么从最高点到最低点的时间距离必须超过24小时,最高点和最低点之间的点数必须大于或等于平均价格变动每天。 维持和改变市场地位 可以有多个未平仓头寸;每个头寸都可以单独修改。 VR Cu
    Vanexio
    Sayan Vandenhout
    VANEXIO USES THE TREND WAVE INDICATOR AND IT CAN IDENTIFY THE BEGINNING AND THE END OF A NEW WAVE TREND MOVEMENT. AS AN OSCILLATOR, THE INDICATOR IDENTIFIES THE OVERBOUGHT AND OVERSOLD ZONES. IT WORKS GREAT TO CATCH THE SHORT TERM PRICE REVERSALS AND USES A MARTINGALE STRATEGY TO CLOSE ALL TRADES IN PROFIT. USE DEFAULT SETTINGS ON H1 OR HIGHER TIME FRAME ON ANY PAIR FOR MORE ACCURATE TRADES WHY THIS EA : Smart entries calculated by 5 great strategies The EA can be run on even a $20000
    FREE
    Rainbow MT4
    Jamal El Alama
    Rainbow MT4 is a technical indicator based on Moving average with period 34 and very easy to use. When price crosses above MA and MA changes color to green, it’s a signal to buy. When price crosses below MA and MA changes color to red, it’s a signal to sell. The Expert advisor ( Rainbow EA MT4) based on Rainbow MT4 indicator, as you can see in the short video below is now available here .
    FREE
    This Dashboard displays signals in grid view for the 28 major fx currency pairs. It is Mainly used for forex scalping in between 10 to 20 pips maximum and can be used on major trend market decisions. It Uses mainly Moving average and does not give false signal. All you need to note is the point in the grid where the signal occurs.  A beep sound is heard whenever there is a new signal and it will be displayedat the top of the chart.
    Easily trade chart patterns and trendlines you draw on the chart. You can trade : Harmonic Patterns  By using Buy the Support / Sell the Resistance Breakout Patterns By using breakout lines You can trade :Triangles (Symmetrical, Ascending, and Descending),Flags,Double Top and Double Bottom,Head and Shoulders and Inverse Head and Shoulders,Rising and Falling Wedges,Bullish and Bearish Rectangles,Bearish and Bullish Pennants (Symmetrical, Ascending, and Descending),Trendline breakouts,Cup w
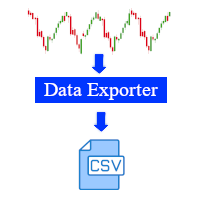
    这个软件是用于任何仪器的实时数据导出工具,它将数据导出为CSV文件。 使用说明: 在任何仪器上部署,并在提示时将间隔变量更改为您喜欢的持续时间(默认设置为30秒)。间隔设置了导出程序捕获数据并导出之前的秒数(最小秒数可以为1秒,但这将导致生成一个大文件,并可能在Python或其他软件中处理时出现问题)。建议的最小间隔时间为15秒。 从您的MQL4数据文件夹中找到导出的文件(在终端中点击文件 -> 打开数据文件夹)。在这个数据文件夹中,找到FILES文件夹,您的导出的CSV文件应该在那里。 特点和功能: 导出的数据包括:日期、时间、开盘价、最高价、最低价、收盘价、成交量。 导出器将自动包括在导出文件中的所有可用数据。 数据始终以最新的蜡烛数据在第一行进行排序。这样做是为了使第三方后处理软件能够轻松找到最新的数据。 在使用Python或其他数值处理软件进一步处理文件时,您可以在间隔之间使用该文件。 该导出器经过质量测试,并按预期工作。然而,如果您发现任何错误、问题或有需要实现的想法,请与我联系,我们可以进一步讨论。
    Magic EA MT4
    Kyra Nickaline Watson-gordon
    3 (1)
    Magic EA is an Expert Advisor based on Scalping, Elliot Waves and with filters such as RSI, Stochastic and 3 other strategies managed and decided with the robot smartly. Large number of inputs and settings are tested and optimized and embedded in the program thus inputs are limited and very simple. Using EA doesn't need any professional information or Forex Trading Knowledge. EA can trade on all symbols and all time frames, using special and unique strategies developed by the author. The EA
    Индикатор отображает 4 текущих уровня между, которыми находится цена. Уровни вычисляются на основе диапазона предыдущей недели. Количество и значение уровней произвольное   и выражается в процентах . Положение уровней отсчитывается от минимума предыдущего дня (пример можно посмотреть в описании параметров). Целесообразно размещать уровни в строке настроек по порядку, тем не менее индикатор сам их отсортирует и если обнаружатся уровни отстоящие менее чем на 1% выдаст ошибку. Индикатор работает н
    Trade Vantage ver4
    Yvan Musatov
    5 (1)
    Introducing Trade Vantage : Professional Market Analyst Trade Vantage is a highly effective analytical tool that uses a specialized algorithm for trading on the Forex and cryptocurrency markets. Its operating principle is based on price analysis for a certain time interval, identifying the strength and amplitude of price movements using a unique indication system. When a trend loses its strength and changes direction, the expert closes the previous position and opens a new one. The bot also tak
    Exp Swing
    Vladislav Andruschenko
    4.28 (39)
    它使用称为 Swinger (Pendulum, Cheburashka) 的著名策略模型 - 交替放置增加手数的挂单。 策略在于放置两个相反的挂单。当价格向某个方向移动时,触发一个挂单,同时增加另一个订单的手数。 EA 提供三种类型的挂单(TypeofTrade) 放置后自动开仓(即时开仓AutoTrade) 手动开仓后的开仓管理(Manual opening ManualTrade) 按高/低水平开盘(过去的 TFTrade 柱线的高低) OCO(一个取消另一个)订单是一种由两个订单组成的条件订单。如果第二个订单被执行,第一个订单就会自动取消。 Swing - 完整说明 MT5 version 如何购买 如何安装     如何获取日志文件     如何测试和优化     Expforex 的所有产品 这个怎么运作? 开始时,EA 发出两个订单 - 买入止损 和 卖出止损 ,距离当前价格的距离为 StopOrderDeltaifUSE。 如果 Buy Stop 触发,则 Sell Stop 将被删除,并且将放置一个交易量为 BuyStop   *   Martin
    FREE
    该产品的买家也购买
    Unlimited Trade Copier Pro is a tool to copy trade remotely to multiple MT4, MT5 and cTrader accounts at different computers/locations over internet. This is an ideal solution for you if you are a signal provider and want to copy your trades to other receivers globally on your own rules. One provider can copy trades to multiple receivers and one receiver can get trade from multiple providers as well. The provider can even set the subscription expiry for each receiver, so that receiver will not b
    Mentfx Mmanage
    Anton Jere Calmes
    5 (15)
    The added video will show you the full functionality, effectiveness, and simplicity of this trade manager. Drag and Drop Trade Manager. Draw your entry and have the tool calculate the rest. Advanced targeting and close portions of a trade directly available in tool (manage trades while you sleep). Market order or limit order on either side with factored spread. Just draw the entry, the tool does the rest. Hotkey setup to make it simple. Draw where you want to enter, and the stop loss, the tool c
    Forex Market View Dashboard and CSM
    Opengates Success International
    5 (1)
    FFXMV Dashboard + CSM is a custom indicator combined with Currency Strength Meter . It is created to give the Traders a full view of what is going on in the market. It uses a real time data to access the market and display every bit of information needed to make a successful trading. Before attaching this Indicator to your window chart, go to your MT4's Market Watch panel and HIDE all the Currency pairs you don't need or trade and leave the rest there. The reason is that FFMV Dashboard will DISP
    News Trader Pro
    Vu Trung Kien
    4.41 (17)
    新闻操盘手专业版 是一个独特的机器人,让您使用您预先定义的策略进行消息交易。它从几个流行的外汇网站加载的每条消息的片断。您可以选择任何消息和预设的策略进行交易,之后新闻操盘手专业版根据选定的策略,在新闻来临时自动进行交易。 新闻发布给出了赚点数的机会,因为在那个时刻,价格通常有大动作。现在,利用这款工具,新闻交易变得比以往任何时候更容易,更灵活,更令人兴奋。不要等待,不要错失,不要再迷惑了。每周只需针对重要新闻设置一次,这个工具将完全按照您的计划进行精准交易。 演示版: 由于这不是一个自动交易机器人 (它是半自动), 您需要下载单独的演示版本: https://www.mql5.com/zh/market/product/5931 参考: 如果您只需要加载新闻 (无需交易), 您可以购买新闻加载机专业版: https://www.mql5.com/zh/market/product/5463 功能 包括所有 新闻加载机专业版 的功能 (查看详情)。 针对每条新闻构建您自己的策略,具有非常灵活的参数。 支持五种高级策略,带有大量控制参数 (止损, 止盈, 尾随, 网格间隔, 手数缩放
    ADAM for FTMO 40
    Vyacheslav Izvarin
    5 (1)
    ADAM EA Special Version for FTMO  Our 1st EA created using ChatGPT technology Trade only GOOD and checked PROP FIRMS  Default parameters for Challenge $100,000 Tested on EURUSD and GBPUSD only  Use 15MIN Time Frame Close all deals and Auto-trading  before Weekend at 12:00 GMT+3  Friday For Prop Firms MUST use special Protector  https://www.mql5.com/en/market/product/94887 ---------------------------------------------------------------------------------------------------------------------------
    延迟套利是一种交易策略,它允许交易者通过对两个或多个经纪人之间定价效率低下所带来的机会快速采取行动来获得即时利润:它需要与滞后经纪人进行交易,提前知道未来价格,从其他价格馈送中获得,一秒钟前。这些低效率可能是由流动性提供者或经纪人方面的网络问题引起的。在理想的交易条件下,延迟套利是一种零风险策略,不需要分析或指标。 [ 安装指南 | 更新指南 | 故障排除 | 常见问题 | 所有产品 ] 100% 自托管 这是非常容易使用 没有使用安装程序、配置文件或 DLLS 同时与多达 8 个经纪商交易 交易无限的符号或工具 EA 的每个实例同时充当价格馈送和交易终端。因此,除非您明确想要这样做,否则无需找到快速和慢速的代理或执行复杂的测量。 EA 将与遭受定价缺陷的经纪人进行交易,如果没有,则保持闲置状态。其他特点是: 适应并考虑对代理服务器的 ping 适应点差、佣金、止损位和冻结位 交易可以在到期时关闭 支持非常规符号名称 它可以下SL和TP订单以确保安全 灵活的风险管理 符合 NFA-FIFO 标准 Latency Arbitrage EA 最初于 2014 年开发并于
    三角套利策略利用三个相关货币对之间的低效率,当低效率得到解决时,进行抵消交易,这些交易相互抵消以获得净利润。一笔交易涉及三笔交易,将初始货币兑换为第二笔,第二笔兑换为第三笔,第三笔兑换为初始。在第三笔交易中,套利者从市场交叉汇率与隐含交叉汇率不一致时存在的差异中锁定零风险利润。 [ 安装指南 | 更新指南 | 故障排除 | 常见问题 | 所有产品 ] 三角套利环的一个例子是美元、英镑和欧元。这种套利机会涉及的货币对是欧元/美元、英镑/美元和欧元/英镑。这些对可以被认为是具有分子和分母的代数公式。欧元/美元的分子是欧元,而该货币对的分母是美元。这个等式计算出欧元除以美元。这三个货币对组成了一个三元环,可以表示如下: MEAN = EURUSD - EURGBP * GBPUSD 平均值大致以零为中心,但有时会严重偏离该值。低于零的平均值意味着买入 EURUSD、卖出 EURGBP 并用 GBPUSD 对冲可能获利。同样,高于零的平均值意味着卖出 EURUSD、买入 EURGBP 并用 GBPUSD 对冲可能获利。如果合并的交易成本小于差异,则可以进行交易并
    The  Easy Strategy Builder (ESB)  is a " Do It Yourself " solution that allows you to create a wide range of the automated trading strategies without any line of codes. This is the world’s easiest method to automate your strategies that can be used in STP, ECN and FIFO brokers. No drag and drop is needed. Just by set conditions of your trading strategy and change settings on desired values and let it work in your account. ESB has hundreds of modules to define unlimited possibilities of strategi
    FTMO Protector 7
    Vyacheslav Izvarin
    PROTECT YOUR FTMO Account in a simplest way Must-Have   Account Protector for any Prop-trading Account and Challenge MT4 / MT5 Expert Advisor that protects your Forex Prop Trading account from an unexpected drawdown! FTMO Protector  is a Tool that lets you manage trades and control your profit and loss across multiple Robots and currency pairs using a simple parameters and settings. Use as many EAs and Instruments you need, the Protector will: 1.   Calculate your midnight (01:00 System time) Bal
    FTMO Sniper 4
    Vyacheslav Izvarin
    Dedicated for FTMO and other Prop Firms Challenges 2020-2024 Trade only GOOD and checked PROP FIRMS  Default parameters for Challenge $100,000 Best results on GOLD and US100  Use any Time Frame Close all deals and Auto-trading  before  US HIGH NEWS, reopen 2 minutes after Close all deals and Auto-trading  before Weekend at 12:00 GMT+3  Friday Recommended time to trade 09:00-21:00 GMT+3 For Prop Firms MUST use special Protector  https://www.mql5.com/en/market/product/94887 -------------------
    If you wish to draw Support and Resistance lines, view: daily market opening, classical pivot levels, Fibonacci pivot levels, trend lines, Fibonacci levels, the remaining time to candle closing, and current spread. If you seek to place your orders with the exact lot that meets your desired stop loss risk. If you wish to do all this and more with just one click, then this is the perfect tool to use. This tool will allow you to feel more relaxed when deciding to open orders, as well as predicting
    Unlimited Binary Options Copier Remote is a powerful tool to copy binary options trades remotely between multiple accounts at different locations over internet. This is an ideal solution for signal provider, who want to share his binary options trades with the others globally on his own rules. One provider can copy trades to unlimited receivers and one receiver can get trade from unlimited providers as well. The provider can set the subscription expiry for each receiver, so that receiver will no
    Semi Automated EA for working as your trading assistant. Overview Trading planner will make you act like professional traders in real markets. Before entering markets, they make a plan for their trades, screening out all opportunities in all time frames. Trading Planner can be used for all Time Frames (M1 ~ MN). Simply draw trendline as a trend and Support/Resistance . At this version , market opportunities will be taken by trendline using strategy of 1, 2, 3 . Simply draw the trendline by defi
    Pairs Trade
    Oleg Pechenezhskiy
    The Pairs Trade indicator is a utility for semi-automatic pair trading. It allows combining the charts of two arbitrary instruments, even if the schedules of their trading sessions are different. It displays a spread chart in the form of a histogram with an overlaying moving average. It calculates the swap that will be charged for the synthetic position (in the deposit currency). It is possible to set a level for automatic opening of a synthetic position on the spread chart (analogous to the 'se
    This Stacker EA will: Automatically set Stop loss on a new order Automatically set Take profit on a new order Stack (or open up to 4 additional orders at the same time) when a new order is placed, the SL/TP can be preset individually for each order. Provides a transparent replacement for the standard 1-click trading buttons in MetaTrader 4 (1 click still works and SL/TP will automatically be set as well as Stacking). Automatically calculate lot order size according to preset risk management perc
    FXFledgling Exit Tool is a complete risk management tool that analyzes both the open trades and the direction of the pair of open trades. As long as the suggested entry and lotsizing management presented here is followed strictly, you will have a high chance (but no guarantee) of surviving the trade. What It Does It is used as an exit tool. It helps the trader to manage any manual trade that he transacted. It does the following: Trail Stop Dynamic Stop Loss - a calculated stop-loss that change
    Crypto Market Pro
    Daniil Kurmyshev
    5 (2)
    New opportunities for analyzing cryptocurrency in the usual MetaTrader 4. For example : We select the symbol of the cryptocurrency and attach any indicators, Expert Advisors or scripts. Startup Mode View cryptocurrency; Data collection. Capabilities Work as with a standard currency chart; Automatic update of open charts; Selection of individual cryptocurrency for updating; Selection of individual timeframes for updating; Work on the desired timeframes; Open charts do not affect the work of C
    斐波那契折返和扩展画线工具 适用于MT4平台的斐波那契折返和扩展画线工具,非常适合于利用帝纳波利点位交易法和黄金分割交易的交易者 主要功能: 1.可以直接画线多组斐波那契折返,重要折返点之间的关系一目了然 2.可以画出斐波那契扩展 3.画线的斐波那契折返和扩展均可左右移动方便观察,有数值显示 4.图表显示非常清爽 5.可通过数字键切换周期 功能键: 1.按 [ 画折返,按需画折返,最多可画8组 2.按 ] 画扩展 3.按 \ 删除当前周期下的所有扩展和折返 4.移动、删除折返和扩展 (1)点击第一组折返的F5线条, 点击1次(变成黄色),按键盘上的Delete可删除该焦点的折返。 点击2次(恢复颜色),可以移动折返到合适的位置 (2)点击COP的线条 点击1次(变成黄色),按键盘上的Delete可该组折返 点击2次(恢复颜色),可以移动扩展到合适的位置 5.修改折返和扩展: (1)选择焦点F或反弹点数字(F或反弹点字体变大,变成黄色),移动鼠标。 (2)选择ABC三点中的某一个(字体变大,变成黄色),移动鼠标。 如何使用可以看相关视频
    Советник риск-менеджер с огромным арсеналом возможностей защиты вашего депозита. Для инвесторов, которые решили передать капитал в доверительное управление. Когда у трейдера нет доступа к настройкам - нивелирует торговые риски. А также для трейдеров, которые осознали необходимость стороннего контроля за их торговлей для улучшения торговых результатов.  Для максимальных результатов - должен стоять на отдельном VPS сервере и у трейдера не должно быть возможности менять настройки в торговый период.
    Grid Hero War Pad
    Chock Hwee Ng
    3.4 (5)
    Grid Hero War Pad is a  GRAPHICAL MANUAL TRADER version of the original Grid Hero EA, designed and created for ADVANCED TRADERS who are experienced in plotting their own market entries. It is coded using ADVANCED GRAPHICAL INTERFACE programming, that combines the power of discretionary trading with Grid Hero algorithm in the form of a graphical console with button-click easy execution. It allows you to execute trades manually using Market Orders and Pending Orders, and then automatically uses t
    MirrorEA
    Eugenio Bravetti
    The new version of  MirrorSoftware 2021  has been completely rewriten and optimized.  This version requires to be loaded only on a single chart because  it can detect all actions on every symbol and not only the actions of symbol where it is loaded. Even the  graphics and the configuration mode  have been completely redesigned. The MirrorSoftware is composed of two components (all components are required to work):  MirrorController  (free indicator): This component must be loaded into the MAST
    Open charts
    Maksim Slovakov
    Скрипт открывает графики по всем инструментам находящимся в окне "Обзор рынка" и по желанию может задать для всех графиков один шаблон. Так-же можно удалить все графике открытые в терминале Мт4. В скрипте имеются следующие настройки: "Таймфрейм" по умолчанию M30;             (Можно поставить свой: M1, M5, M15, M30, H1, H4, D1, W1, MN.) "Задержка" по умолчанию "0";                  (Задержка перед открытием следующего графика в миллисекундах.) "Шаблон" по умолчанию "True";                (True=пр
    Quantized Trend
    Oleg Pechenezhskiy
    This utility automatically draws the trend channel on the price chart. For the time interval from the specified date to the current bar, the drawn channel is almost optimal. Placing the beginning of the channel at a more distant historical price extremum, you get a visualization of a longer-term trend. Channel slope is not a continuous value, but takes one of discrete values (in AxB format, where A is the number of price points (points), and B is the number of timeframes). This program works ONL
    Forex copier
    Alexandr Bryzgalov
    We offer simple and reliable software that can  copy trades  between any MT4 accounts. Easy to use MetaTrader copier which saves valuable time Reliable, so you are protected from technical issues Powerful, with a lot of features available Who can use this MT4 copier? Forex Copier is a solution for individual traders or account managers who need to execute trade signals from external sources or who need to  manage several MetaTrader 4 accounts  at the same time. We do not offer you “yet another
    Trendline Scalper Robot
    Vijay Vikram Singh Kushwah
    Trading  Robot which automates your scalping and take your profitability  and forex trading experience to the next level ,Computer cannot analyse market as humans do, at same time we cannot compete with them in terms of speed of execution, hft  & emotionlessness  .  ​In this scalp-trading robot we have integrated human analysis with quick algorithmic execution  to enter and exit trades at fraction of seconds Get More details at :  https://www.noemotionfx.com/tl-scalper-ea To test , use it in dem
    Automatic enumeration of input parameters of the TrendImprovement Pro indicator to find the optimal combination. Description. A powerful tool for testing the input parameters for the TrendImprovement Pro indicator will allow you to quickly find the most profitable options for the input parameters. Settings DateOrBars – switch for using time or number of bars;  MaxBars - the maximum number of bars for calculation; StartHistory - indicator start time; BEGINNING - the initial historical data (I
    Advanced Smart Renko and Heiken Ashi Candle Trader is ONE STOP SOLUTION based semi/fully - automated multi-currency EA carefully engineered for traders to enter the trade based on their Analysis or in fully automated mode for scalping, trend trading, candle breakout trades and also automated news trading with inbuilt trade management solution.    Advantages    No grid / Martingale Works on Classic Renko, Renko Heiken Ashi charts and classic Heiken Ashi charts    Features Multi-Currency Ma
    Binary expert
    Dmitriy Konogorov
    Expert for a binary options on mt4, he have  two built-in a indicators and many different settings. The expert has one a level of martingale, but it is recommended to use it on  the instruments with a yield of 85 percent. it can be used simultaneously on a variety of currency instruments. All settings have already been made, but you can also configure them yourself . Currency for do trading is a Russian ruble. Good trading to everyone.
    This program is created by algorithm which economy based logic in the trading market. 1. The program able to work with all of currency and trading items  2. Take profit and loss are basically handled by EA program Recommendation: EUR_USD is the most preferred. Please use this program only for MT4. LOT should be managed depends on own deposit. Otherwise, high risk will be driven(e.g 0.1~0.2 lot is recommended when the deposit is 10,000 dollar)
    In foreign exchange trading, the most important investment principle is to ensure the safety of the principal, and risk prevention and control is the primary operation concept. How to manage the account funds is to control the position size and the profit and loss of the order, this EA is designed based on this idea. It can directly manage the risk control of the trading account and realize two functions. One is to close the position according to the profit and loss ratio, and the other is to au
    作者的更多信息
    Running along Lines MT5
    Pavel Verveyko
    5 (1)
    The indicator draws support and resistance lines on an important part of the chart for making decisions. After the trend line appears, you can trade for a breakout or rebound from it, as well as place orders near it. Outdated trend lines are deleted automatically. Thus, we always deal with the most up-to-date lines. The indicator is not redrawn . Settings: Size_History  - the size of the calculated history. Num_Candles_extremum  - the number of candles on each side of the extremum. Type_Ar
    Ichimoku Map MT5
    Pavel Verveyko
    Ichimoku Map (instant look at the markets) - built on the basis of the legendary Ichimoku Kinko Hyo indicator. The task of the Ichimoku Map is to provide information about the market strength on the selected time periods and instruments, from the point of view of the Ichimoku indicator. The indicator displays 7 degrees of buy signal strength and 7 degrees of sell signal strength. The stronger the trend, the brighter the signal rectangle in the table. The table can be dragged with the mouse. T
    Scalper Assistant MT5
    Pavel Verveyko
    5 (2)
    The indicator is a trading system for short-term trading. Scalper Assistant helps to determine the direction of the transaction, and also shows the entry and exit points. The indicator draws two lines (possible points for opening positions). At the moment of the breakdown of the upper line up (and when all trading conditions are met), an up arrow appears (a buy signal), as well as 2 goals. At the moment of the breakdown of the lower line down (and when all trading conditions are met), a do
    Gold n XAU MT5
    Pavel Verveyko
    The trading system is designed to work with gold on time periods: 30M, 1H. The indicator allows you to adjust to the market situation. Parameters for 1H :   PERIOD=9F ,   FILTER=300 .   Parameters for  30M :   PERIOD=22B ,   FILTER=450 .     A small adjustment to a specific broker is allowed .   If you change the amount of history displayed, you may also need to adjust the parameters. The indicator is not redrawn.     "Gold n XAU" uses different rules for entering a trade and different
    Turn
    Pavel Verveyko
    The indicator shows the market turning points (entry points). Reversals allow you to track rebound/breakout/testing from the reverse side of the lines of graphical analysis or indicators. Reversals can be an independent signal. The indicator allows you to determine reversals taking into account the trend and without it. You can choose a different period for the movement preceding the reversal, as well as the volatility coefficient. When plotting reversals, the indicator takes into account vola
    Length Movement
    Pavel Verveyko
    5 (1)
    Measures the length of the selected movement in points, shows the duration of the movement, as well as the speed of movement.   Outputs the average value of each dimension. It is designed to calculate the expected target based on typical market movements. The intended goal will provide information about the ratio of the stop size to the possible profit and will allow you not to open positions with a small expected profit. It will also help you determine the point at which it is more logical t
    The indicator allows you to quickly switch from one instrument to another, from one time period to another using the keyboard or buttons on the monitor. Each command can be assigned a hot key from 0-9, a-Z (case-insensitive) and VK_OEM_COMMA ("<" on the keyboard) and VK_OEM_PERIOD (">" on the keyboard). This can help you to operate the maximum number of instruments that are available at your broker, analyze more instruments/periods in less time. This product cannot be tested in the tester , beca
    Ratio TP SL
    Pavel Verveyko
    5 (1)
    This indicator allows you to measure the profitability of each specific transaction (the ratio of Stop and Profit). The indicator allows you to adjust the ratio by step size and number of steps. You can build an unlimited number of ratios to compare the risks from different movements. Note: in MT4, the number of horizontal lines in a single ratio cannot exceed 32. Building a line : click the " Ratio " button and draw a line (mouse click - the first point of the line, where the mouse is relea
    Channel FTF
    Pavel Verveyko
    The Envelopes indicator determines the presence of a trend or flat. It has 3 types of signals, shows the probable retracement levels and levels of the possible targets. The Fibonacci coefficients are used in the indicator's calculations. Signals (generated when touching the lines or rebounding from lines): Trend - the middle line of the Envelopes has a distinct inclination; the lines below the channel's middle line are used for buy trades, the lines above the middle line and the middle line itse
    Mr Big
    Pavel Verveyko
    The indicator shows and highlights the chart candles, which are formed as a result of large players entering the market in large volumes. Such candles can also be formed after achieving a certainty on the market, when most of the participants hold positions in the same direction. The movement is likely to continue in that direction after such candles. The indicator highlights the significant candles from the existing ones on the chart; The indicator allows identifying the trends based on candles
    Splash
    Pavel Verveyko
    The indicator identifies the most suitable moment for entering the market in terms of market volatility, when the market has the strength to move (the signal is indicated by an arrow under the candle). For each of the signals, the presence of trends on the current and higher timeframes is determined, so that the signal is in the direction of the majority of positions opened on the market (denoted near the signal by abbreviations of timeframes with a trend present). The signal appears after the c
    The indicator displays the key support and resistance levels on the chart. The significance of these levels lies in that the price may reverse or strengthen the movement when passing such levels, since they are formed as a consequence of the natural reaction of market participants to the price movement, depending on which positions they occupied or did not have time to occupy. The psychology of the level occurrence: there always those who bought, sold, hesitated to enter or exited early. If the
    This indicator is a multitimeframe trading strategy. It has the levels for stop loss, take profit and entry point. The order level can also be set manually. The indicator uses the regularity of the market, which manifests itself on all instruments, and does not require adjustment of the parameters. The strategy uses a proprietary approach to determining: trend, volatility, hierarchy of timeframe significance, the size of the history period (the number of candles), which is important for making a
    Trend Sync
    Pavel Verveyko
    5 (1)
    The indicator shows the trend of 3 timeframes: higher timeframe; medium timeframe; smaller (current) timeframe, where the indicator is running. The indicator should be launched on a chart with a timeframe smaller than the higher and medium ones. The idea is to use the trend strength when opening positions. Combination of 3 timeframes (smaller, medium, higher) allows the trend to be followed at all levels of the instrument. The higher timeframes are used for calculations. Therefore, sudden change
    The indicator detects important peaks and troughs (extremes) on the chart. These points can be used to plot support/resistance levels and trend lines, as well as any other graphical analysis. These points can serve as reference points for setting trading orders. The indicator does not redraw . Settings: Size_History  - the size of the calculated history. Num_Candles_Right  - number of candles to the right of the peak or trough. Num_Candles_Left  - number of candles to the left of the pea
    Running along Lines
    Pavel Verveyko
    3 (2)
    The indicator draws support and resistance lines on an important part of the chart for making decisions. After the trend line appears, you can trade for a breakout or rebound from it, as well as place orders near it. Outdated trend lines are deleted automatically. Thus, we always deal with the most up-to-date lines. The indicator is not redrawn . Settings: Size_History  - the size of the calculated history. Num_Candles_extremum  - the number of candles on each side of the extremum. Type_Ar
    Key Volumes
    Pavel Verveyko
    1 (1)
    The indicator shows key volumes confirmed by the price movement. The indicator allows you to analyze volumes in the direction, frequency of occurrence, and their value. There are 2 modes of operation: taking into account the trend and not taking into account the trend (if the parameter Period_Trend = 0, then the trend is not taken into account; if the parameter Period_Trend is greater than zero, then the trend is taken into account in volumes). The indicator does not redraw . Settings Histo
    Catch Impulse
    Pavel Verveyko
    This trading system is based on market impulses of varying complexity.   To generate a signal, the indicator uses the moments when the direction of the pulse and the necessary section of the trend coincide. The indicator also takes into account the current market volatility. Stop_loss tags can be set with the parameter "0" or "1", then Stop_Loss will take into account market volatility.   Take_Profit tags can be set with the parameter "0", then Take_Profit will take into account market volat
    Indexes
    Pavel Verveyko
    The stocks that make up the index are one of the drivers of the movement. Analyzing the financial performance of all elements of the index, we can assume further development of the situation. The program (script) displays corporate reports of shares that are part of the index selected in the settings.   "Indexes" cannot be tested in the tester (since there is no way to get information from the Internet). Information is downloaded from the site investing.com: Report Date Earnings per share
    Fibo World
    Pavel Verveyko
    The indicator builds a graphical analysis based on the Fibonacci theory. Fibo Fan is used for the analysis of the impulses and corrections of the movement. Reversal lines (2 lines at the base of the Fibonacci fan) are used to analyze the direction of movements. The indicator displays the of 4 the target line in each direction. The indicator takes into account market volatility. If the price is above the reversal lines, it makes sense to consider buying, if lower, then selling. You can op
    The indicator determines the state of the market: trend or flat. The state of the market is determined by taking into account volatility. The flat (trading corridor)is displayed in yellow. The green color shows the upward trend. The red color shows the downward trend. The height of the label corresponds to the volatility in the market. The indicator does not redraw . Settings History_Size   - the amount of history for calculation. Period_Candles  - the number of candles to calculate the

    The indicator plots flexible support and resistance levels (dots). A special phase of movement is used for construction. Levels are formed dynamically, that is, each new candle can continue the level or complete it. The level can provide resistance or support to the price even where it is no longer there. Also, support and resistance levels can change roles. The importance of levels is affected by: the amount of time the level is formed and the number of touches. The significance of these l
    The indicator is a trading system for short-term trading. Scalper Assistant helps to determine the direction of the transaction, and also shows the entry and exit points. The indicator draws two lines (possible points for opening positions). At the moment of the breakdown of the upper line up (and when all trading conditions are met), an up arrow appears (a buy signal), as well as 2 goals. At the moment of the breakdown of the lower line down (and when all trading conditions are met), a do
    Gold n XAU
    Pavel Verveyko
    The trading system is designed to work with gold on time periods: 30M, 1H. The indicator allows you to adjust to the market situation. Parameters for 1H :   PERIOD=9F ,   FILTER=300 .   Parameters for  30M :   PERIOD=22B ,   FILTER=450 .   A small adjustment to a specific broker is allowed .   If you change the amount of history displayed, you may also need to adjust the parameters. The indicator is not redrawn.     "Gold n XAU" uses different rules for entering a trade and different ru
    Target Hunter
    Pavel Verveyko
    The indicator determines the most important component of any trading system - the possible exit point from the transaction. As the price moves, depending on the market situation, the indicator builds goals. The target becomes relevant when the price starts moving towards the target. If the movement is strong, then it may take a certain number of targets to stop or reverse price. The accumulation of targets is most likely able to stop the price. Some goals are executed several times. But the
    The indicator builds "psychological levels": levels of round numbers and intermediate levels of round numbers. Round numbers play an important role in forming support and resistance levels. There is a pattern in which the decline or growth of the price can stop at round numbers. The level whose price ends at 0 is the level of a round number of the first order. Intermediate level, this is the level between two round levels, for example, between 10 and 20 this is level 15. In the " Num_Zero
    Ichimoku Map
    Pavel Verveyko
    Ichimoku Map (instant look at the markets) - built on the basis of the legendary Ichimoku Kinko Hyo indicator. The task of the Ichimoku Map is to provide information about the market strength on the selected time periods and instruments, from the point of view of the Ichimoku indicator. The indicator displays 7 degrees of buy signal strength and 7 degrees of sell signal strength. The stronger the trend, the brighter the signal rectangle in the table. The table can be dragged with the mouse. T
    The indicator displays a stock chart of a non-standard type, in which the price and time have the same value. The usual chart of Japanese candlesticks does not take into account all the information that the time analysis can give. Renko charts do not use all the information that price can give in relation to time. The "Chart Price and Time" indicator takes into account price and time equally and shows the predominance of price or time. Taking into account price and time equally gives an i
    The indicator tracks sharp volatility (moments when the market has shown increased activity and movement may occur), on the selected instruments and time periods. The information is displayed as colored rectangles. Thus, it is possible to assess at a glance which tool should be given priority attention. The indicator will be useful for scalpers when they need a quick reaction or for traders working with a large number of instruments. The indicator does not redraw. The indicator displays 8 degr
    This program is designed to test ideas and acquire analytical skills. The main task of the analyst is to be able to predict the direction and range on the chart, where the price should soon come. This product cannot be tested in the tester. All the functionality is shown in full in the description and screenshots. How it works : Situations for analysis are selected at random. (The more historical data, the greater the number of examples). Click " Start Game ". Between the orange vertical li
    筛选:
    mambobody
    462
    mambobody 2022.04.19 10:44 
     

    very good product

    回复评论
    版本 1.6 2021.03.21
    Added information about dividends.
    版本 1.5 2020.12.20
    Search optimization
    版本 1.4 2020.12.19
    1 Improved search.
    2 While searching for information, the background of the graph changes color to blue.
    版本 1.3 2020.12.16
    Updated the list of shares.
    Search for tickers is optimized, search results are displayed in the "experts" tab.
    版本 1.1 2020.06.09
    Recompilation.