• 概述
  • 评论 (3)
  • 评论 (4)
  • 新特性

Length Movement

5

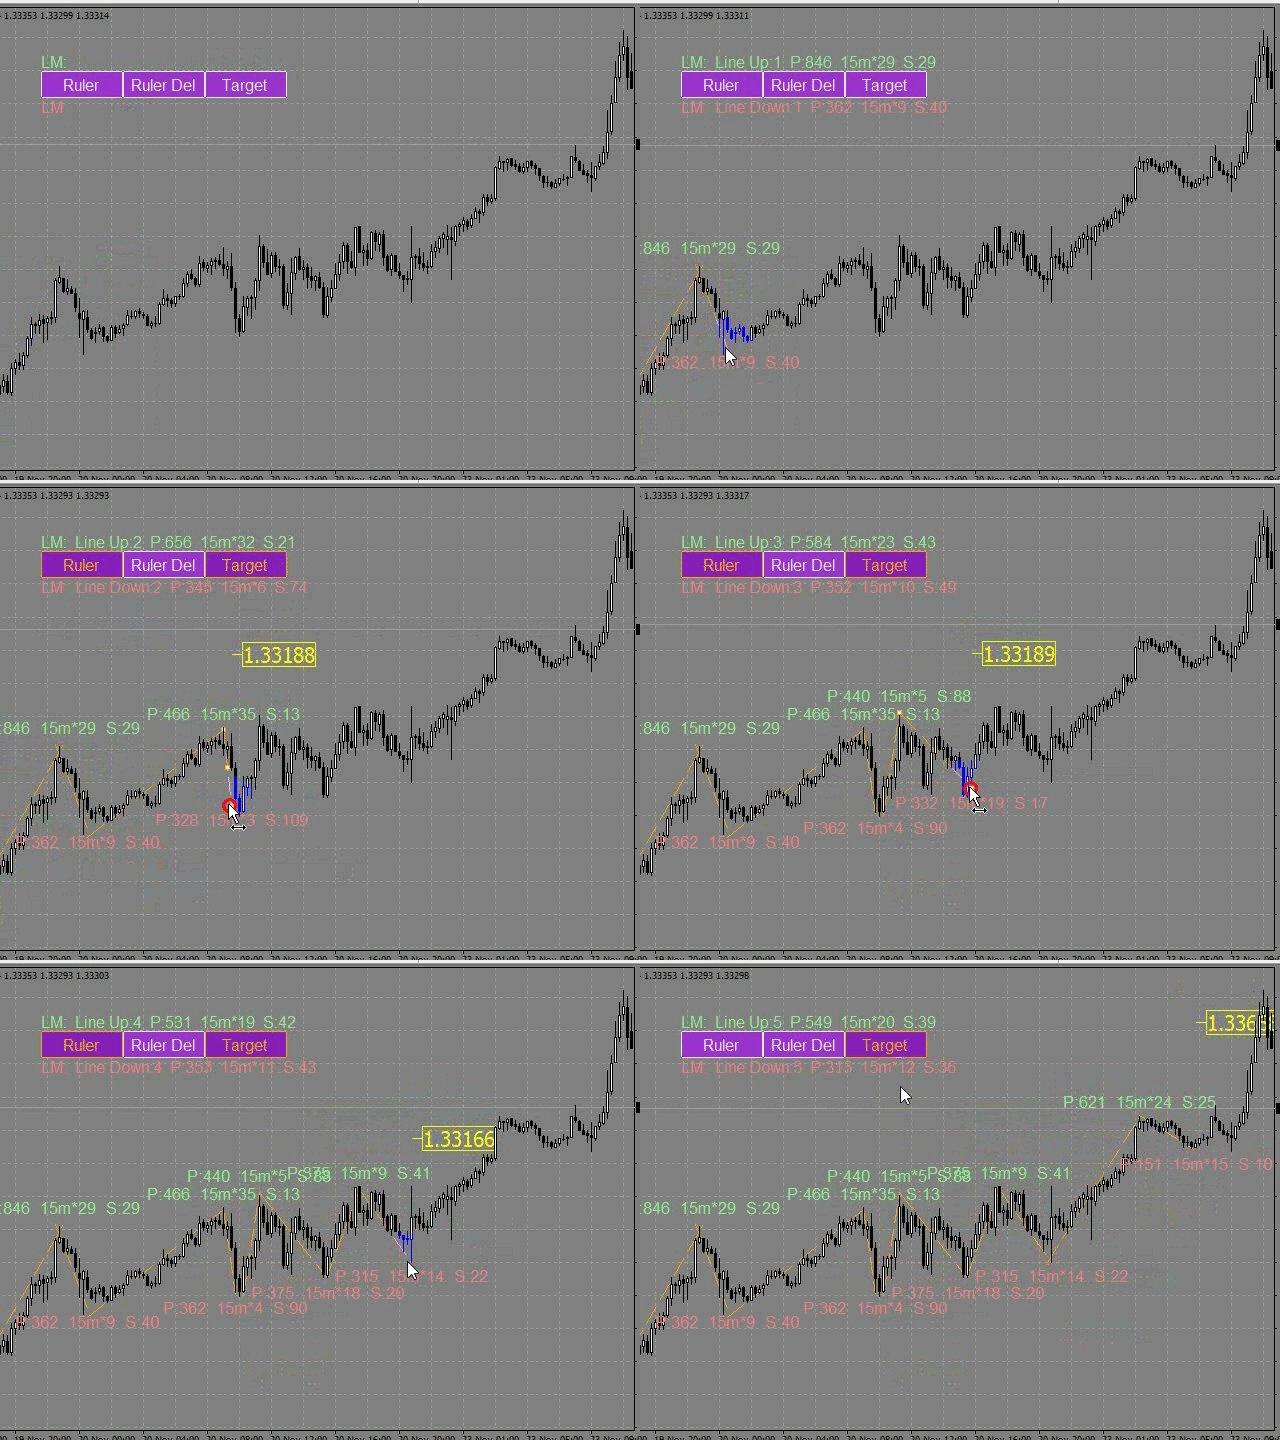
Measures the length of the selected movement in points, shows the duration of the movement, as well as the speed of movement. Outputs the average value of each dimension.
It is designed to calculate the expected target based on typical market movements.
The intended goal will provide information about the ratio of the stop size to the possible profit and will allow you not to open positions with a small expected profit.
It will also help you determine the point at which it is more logical to close a position. 

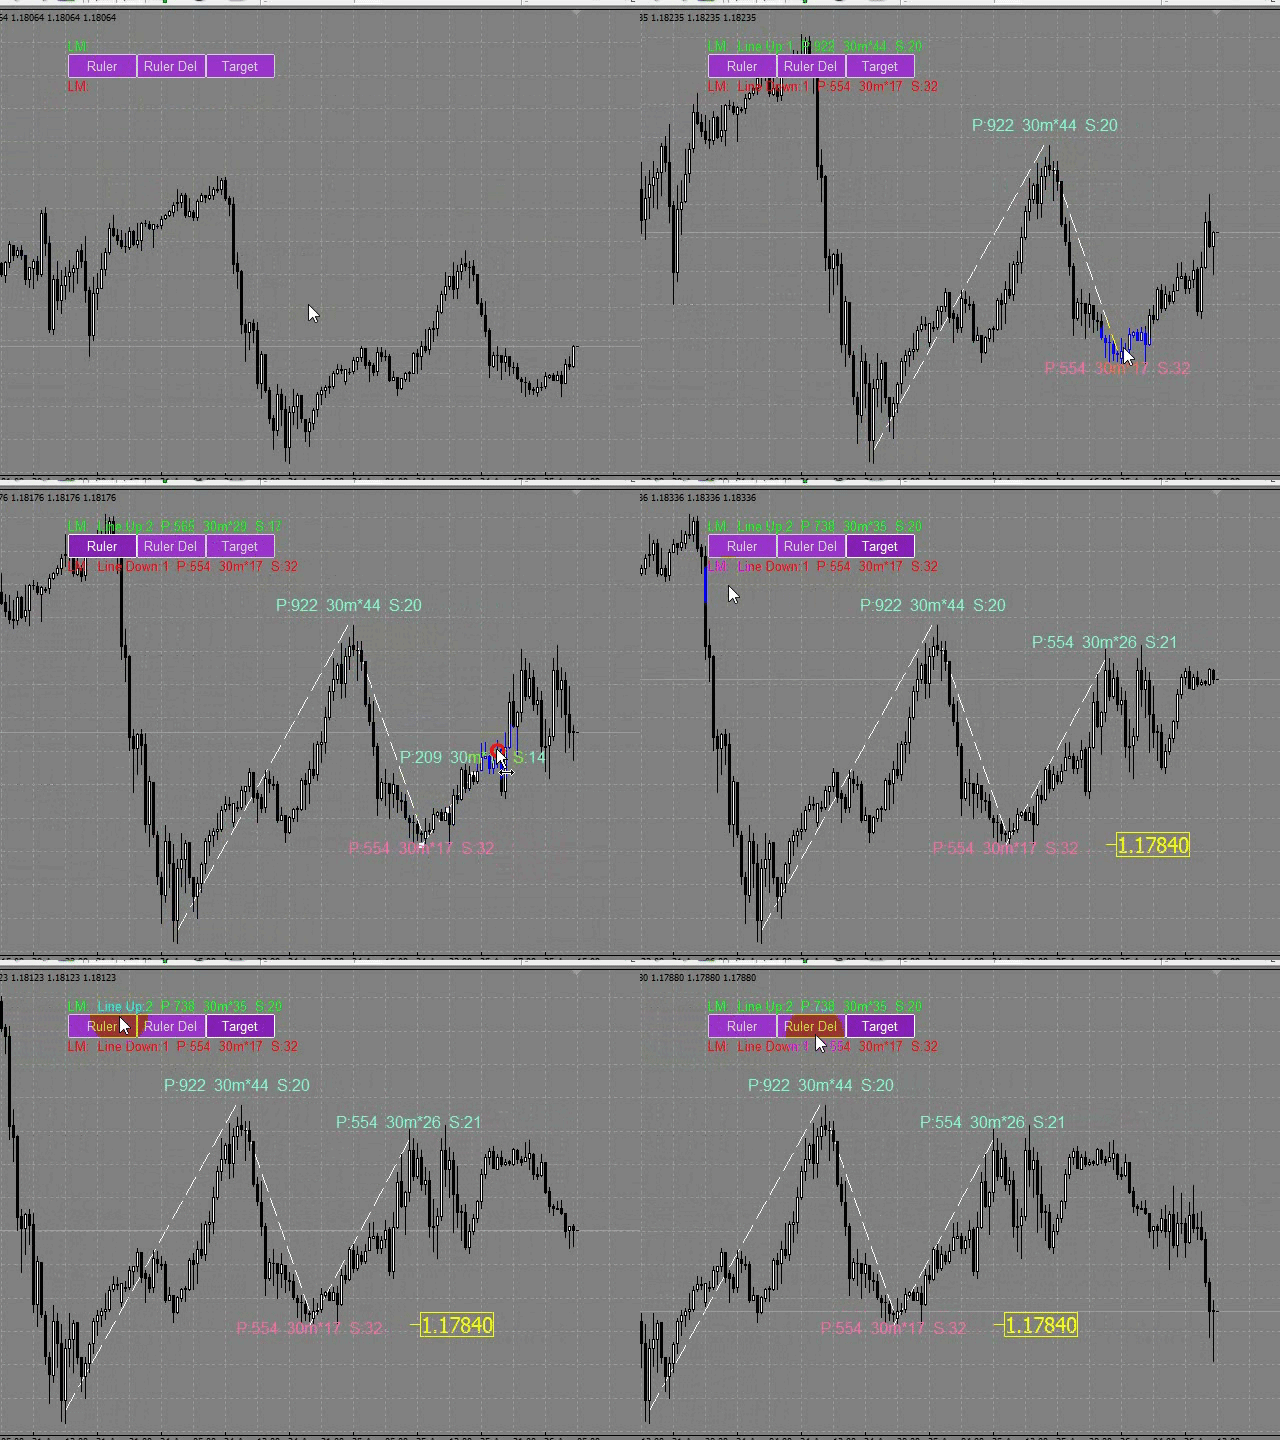
Building a line: click the "Ruler" button and draw a line (clicking the mouse - the first point of the line, where the mouse is released - the second point of the line).
(Lines, text placemarks, and the goal are only visible on the time graph where they were drawn.)

Line changes: select a line and drag it with the mouse.
When you rebuild a line, the value of the text label and the goal (if the goal is enabled) will change immediately.

Delete all measurement lines: click "Ruler_Del". During the number of seconds selected in the "Ruler_Del_Cancel" setting, the "Ruler_Del" button can be clicked to cancel, and the "Ruler_Del" command will be canceled.

Delete the selected measurement lines: select the measurement line and press "delete" on the keyboard. The text label from the measurement line will also be removed, and the goal will change.

Building a goal: the "Target" button sets/deletes a goal. To calculate the goal, you need at least two lines in different directions.

Line_Metrics - Text label of the line.
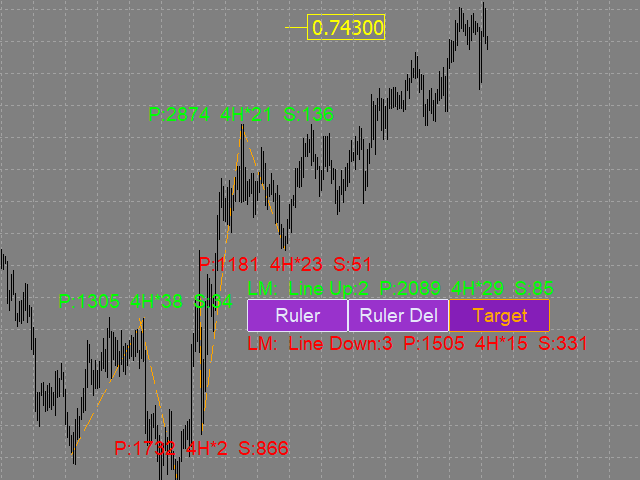
For example, we have an ascending line with the parameters: P:817 4H*10 S: 81. the line Length is 817 points, the line is drawn on a 4-hour chart, based on 10 candles, (that is, the time of the movement(line) is 40 hours).
The speed of the motion in paragraphs 81. This means that on average, each candle participating in the line construction passed 81 points.

Average_Lines_Metrics - Text label for "average values". LM: Line Up:3 P:1586 4H*40 S: 39 means that the text label of the average value is calculated based on 3 ascending measuring lines Line Up: 3 (measuring lines of 0 points, lines of other time periods and tools are not taken into account in the calculations).
The average line length in points is 1586 points P:1586.
The graph where the lines are counted is 4-hour 4H*40. On average, the line consists of 40 4h*40 candles.
On average, the price passes 39 points S:39 per candle.


The size of buttons and text labels for "average values" depends on the font in the Button_Font setting and its size in the Button_FontSize setting.
On-screen buttons can be dragged with the mouse.
You can assign keyboard shortcuts to on-screen buttons (a-Z, 0-9).


Settings

  • Ruler_key - hotkey for drawing a measuring line (you can assign (a-Z, 0-9)) .
  • Ruler_Del_key - hotkey for deleting all measuring lines (you can assign (a-Z, 0-9)) 
    (measurement lines are deleted after the pause selected in the Ruler_Del_Cancel setting).
  • Target_or_Target_Del_key - hotkey for setting / deleting a goal (a-Z, 0-9)
  • (you need at least two lines in different directions to set a goal).
  • Ruler_Del_Cancel - time to cancel the Ruler_Del_key command (in seconds).
  • Button_Background_Color - buttons background color (if Button_Background_Color=clrNONE, the buttons background is the same as the graph background color).
  • Button_Pressed_Color - color of the text and border of the Ruler button when pressed.
  • Line_Metrics_Indent - indent of the text label from the measuring line (in points).
  • Line_Metrics_Orientation - displays the labels of measuring lines vertically / horizontally / diagonally.
  • Target_Orientation - left-hand / right-hand placemark of the goal.
  • Here are the most important settings. You can also change the following characteristics for measuring lines, buttons, and text labels: color, thickness, font, and font size.
评论 3
Trader mql5
1265
Trader mql5 2019.04.24 10:15 
 

A very quick and easy way of measuring in points. It is unique and have not found anything like it! Excellent support from Pavel.

推荐产品
M5 时间框架的机器人黄牛。交易 GBPUSD 货币对。该机器人是由一家专业交易商公司专门开发的,用于英镑交易。机器人每天大约打开 5 到 15 笔交易。最好与英镑兑美元点差低至 10 点的经纪商进行交易。建议的最低存款为 500 美元或更多。 优点: 不使用鞅。 不是网。 每笔交易都有止损。 专门针对 GBPUSD 对的专业机器人。 机器人黄牛,在 M5 时段进行盘中交易。 这个机器人如何交易? 为了分析市场,机器人使用两个指标的价格模型和战略市场模式:抛物线止损和反转系统以及布林带。机器人首先使用价格内插统计分析市场的价格变动。接下来,机器人读取这些指标并比较它们现在和过去的运动趋势。如果存在表明市场反转或回滚的模式巧合,那么机器人将进行交易。机器人将根据余额大小按比例计算每笔交易的手数。交易者可以使用“Percentage_of_lots”参数调整该比例。机器人开始交易后,它开始通过修改追踪止损来伴随它。此外,每笔交易都有自己的止损,设置为限制可能的损失。 机器人规格: 时间范围(期间) M5 货币对 GBPUSD 存款 500 美元起 建议点差高达 10 点。 建议:
Extremes Day
Aleksey Maltsev
v. 1.0 This indicator can show with maximum accuracy up to 1 bar the presence of a Maximum/minimum on the chart, regardless of the timeframe. It has a flexible configuration. You can use either one value on all TF, or you can use your own value on each TF individually. This indicator is already being improved and those who purchase it receive all updates for free. Next, it is planned to display an indication of the strength of the pivot point at each extremum (in % or in color drawing). It wi
RiverScope Lite automatically determines the nearest most important price levels and support and resistance zones in history, it also identifies a large number of price action patterns (the lite version is limited to 10, while the full version has 30+). The support and resistance levels are determined based on an algorithm that calculates and filters the historical values of the price, its movement character, volumes, etc. It displays the current situation, therefore the nearest levels change in
Exp Swing
Vladislav Andruschenko
4.35 (43)
它使用称为 Swinger (Pendulum, Cheburashka) 的著名策略模型 - 交替放置增加手数的挂单。 策略在于放置两个相反的挂单。当价格向某个方向移动时,触发一个挂单,同时增加另一个订单的手数。 EA 提供三种类型的挂单(TypeofTrade) 放置后自动开仓(即时开仓AutoTrade) 手动开仓后的开仓管理(Manual opening ManualTrade) 按高/低水平开盘(过去的 TFTrade 柱线的高低) OCO(一个取消另一个)订单是一种由两个订单组成的条件订单。如果第二个订单被执行,第一个订单就会自动取消。 Swing - 完整说明 MT5 version 如何购买 如何安装     如何获取日志文件     如何测试和优化     Expforex 的所有产品 这个怎么运作? 开始时,EA 发出两个订单 - 买入止损 和 卖出止损 ,距离当前价格的距离为 StopOrderDeltaifUSE。 如果 Buy Stop 触发,则 Sell Stop 将被删除,并且将放置一个交易量为 BuyStop   *   Martin 的 Sel
FREE
Chinetti pip collector XL is a complete turnkey trading system. If a trader does not yet have his own trading system, he can apply Chinetti pip collector XL to trading. Trading with this indicator is very easy. Even a beginner in Forex can handle it. Trading rules: wait for the indicator to start drawing a blue line. This means that the price trend is starting now. Now we are waiting for the indicator to analyze the market and draw an up arrow on the chart. At this point, we open a buy order.
使用说明: https://www.mql5.com/zh/blogs/post/754946 MT4版本: https://www.mql5.com/zh/market/product/88205 MT5 版本: https://www.mql5.com/zh/market/product/88204 ---------------------------------------------- 1.复制订单,从12个主帐号到100个从帐号.从帐号数量可以自定,从12个到100个。 2.支持MT4到MT4, MT4到MT5, MT5到MT4,MT5 到MT5. 3.识别不同平台的交易品种后缀,如EURUSD,EURUSDm,EURUSDk. 4.自定义货币匹配,如XAUUSD=GOLD. 5.可复制所有交易,或只复制BUY,SELL,CLOSE指令 6.可选择是否复制止盈止损 7.可反向复制,如主帐号是BUY,从帐户就是SELL,反之也是。当主帐号平仓时,从帐户不管是同向复制还是反向复制,都会同时平仓 8.发生意外如从帐号关闭时,主帐号有平仓信号而从帐号没有及时复制,当从帐号再次启
VR Grid
Vladimir Pastushak
5 (3)
VR 网格指示器 设计 用于创建具有用户定义设置的图形网格。与 标准网格 不同,VR 网格用于构建 圆形关卡 。根据用户的选择,轮次级别之间的步长可以是任意的。此外,与其他指标和实用程序不同,即使时间段发生变化或终端重新启动,VR Grid 也能保持网格的位置 。 设置、设置文件、演示版本、说明、问题解决,可以从以下位置获取 [博客] 您可以在以下位置阅读或撰写评论 [关联] 版本为 [MetaTrader 5] 垂直级别 基于实际时间间隔并 忽略缺失 或不存在的周期。因此,级别之间的步长严格对应于用户选择的值。 使用 VR 网格指标时,交易者 可以更改任何级别的垂直线和水平线的样式 、颜色和粗细。这使您可以控制金融工具的 回合水平 。 整数位是 以两个或多个零结尾 的价格(例如:1.23500、5.65900、1923.200)。人们相信,这样的水平 经常充当 作为支撑或阻力的强点。 Horizontal line settings Horizontal line step Horizontal line color Horizontal line style Horizonta
FREE
Supply and Demand zones
Makarii Gubaydullin
Supply / demand zones: observable areas where price has approached many times in the past. My   #1 Utility:  65+ features, including this indicator  |   Contact me  for any questions  |  MT5 version The indicator shows where the price could potentially be reversed again. Usually, the more times the price has been rejected from the level, the more significant it is. In the input settings   you can adjust: Enable or disbale Weak zones; Show or hide zone description; Font size; Set the basic color
Trade with Gann on your side!! MASTER CIRCLE 360 CIRCLE CHART, originally created by Gann admitted that this is “The Mother of all charts”. It is one of the last studies that this great trader left for us. The numeric tab le is apparently quite simple like all the tables and is based on square numbers, the SQUARE OF 12 and is by evolution, one of the most important square numbers. Here we can find CYCLE, PRICE AND TIME thanks to angles and grades, to show past and future support and resistance.
Day Pattern
Oleksandr Martsynyshen
Description: - D ay Pattern - an indicator that helps to identify patterns of price changes for the development of trading algorithms and strategies. For whom this tool? - For developers of trading strategies and algorithms. - Medium- and long-term traders. Time frames H1-W1. Features of the indicator: - There is a function of exporting indicator values to a file of the csv format. - Using the information panel, you can conduct an express analysis of trading tool. - The indicator is sui
Volume Confirm Trend Zone is the indicator for filtering sideways and confirm trend to help your system trading. Indicator can use every currency pairs, every time frame, and every broker. You can see trend zone when color to change in volume indicator. Features When the color changes to the blue: Buy Zone is a strong trend. When the color changes to the red: Sell Zone is a strong trend.
Introduction It is common practice for professional trades to hide their stop loss / take profit from their brokers. Either from keeping their strategy to the themselves or from the fear that their broker works against them. Using this indicator, the stop loss / take profit points will be drawn on the product chart using the bid price. So, you can see exactly when the price is hit and close it manually.  Usage Once attached to the chart, the indicator scans the open orders to attach lines for t
Master scalping M1
Nataliia Marchuk
Master Scalping M1 is an innovative indicator that uses an algorithm to quickly and accurately determine the trend.The indicator calculates the time of opening and closing positions, the indicator's algorithms allow you to find the ideal moments to enter a deal (buy or sell an asset), which increase the success of transactions for most traders. Benefits of the indicator: Easy to assemble, does not overload the chart with unnecessary information. Can be used as a filter for any strategy. Works on
Day By Day
Maksim Neimerik
Day By Day Требования к использованию советника: Для работы даного советника никакие требования не предусмотрены! Советник представляет собой систему, которая работает по сигналам индикатора RSI. Работает советник по времени терминала с 10:00 по 10:20, это значит что в это время он пытается войти в рынок, если по истечении этого времени войти не удается - ждет следующего дня. Рекомендуемая валюта: EURUSD, USDJPY; Таймфрейм : H1; Мониторинг:   https://www.mql5.com/ru/signals/557506 Оптимальные на
Description: Please tick "Show object descriptions" in chart properties to enable hrays views That utility converts a trendline into a horizontal ray known as tool for drawing supply and demand zones. Simply create a trendline on a chart and once selected, it will get converted. Ray remains horizontal while dragging.  Quick ray plot: press "R" key to create horizontal ray. It will be snapped to the nearest OHLC value Further versions will be improved. For feature request please post new comm
Displays the local time with the time difference you set. (It does not correspond to the time difference in 30-minute increments.) It also displays a price line with a good price, such as 100.000 .100 or .200. The standard gridlines are displayed with the time and price by MT4, but they are very confusing as they become the broker's time and are displayed at the halfway point along with the price. It hides them and displays gridlines at user-defined time differences and prices in easy-to-unders
Golden Flash Scalper
Felipe Jose Costa Pereira
Golden Scalper XAU/USD – 专为黄金市场(XAU/USD)设计的高效剥头皮交易指标 如果您是黄金市场(XAU/USD)的交易员,正在寻找一个强大的工具来最大化您的利润,进行高效的剥头皮交易,那么 Golden Scalper XAU/USD 将是您的完美选择。此指标使用先进的模式识别技术,提供 高精度的交易信号 ,让每一笔交易都充满信心。 主要特点: 剥头皮交易中的无与伦比的精确度: Golden Scalper XAU/USD 专为黄金市场优化,提供 优质的交易信号 ,帮助您进行 快速且有利可图的交易 。 先进的模式识别技术: 通过使用复杂的模式识别技术,指标能够识别最佳的入场机会,过滤掉虚假信号,大大提高交易成功率。 高精度: 依托智能算法,指标能够在波动性大、快速变化的黄金市场中提供 可靠的交易信号 ,确保您的每一次交易都有更高的成功概率。 专为剥头皮交易优化: 该指标的优势在于其 在剥头皮交易中的高效性 ,能够帮助您在短时间框架内发现最佳的入场和退出点 简易的用户界面: Golden Scalper XAU/USD 拥有直观的用户界面,信号显示在图表上,简
Trade Manager MT4 DaneTrades
Levi Dane Benjamin
4.33 (9)
交易管理器可帮助您快速进入和退出交易,同时自动计算风险。 包括帮助您防止过度交易、报复性交易和情绪化交易的功能。 交易可以自动管理,账户绩效指标可以在图表中可视化。 这些功能使该面板成为所有手动交易者的理想选择,并有助于增强 MetaTrader 4 平台。多语言支持。 MT5版本  |  用户指南+演示 交易经理在策略测试器中不起作用。 如需演示,请参阅用户指南 风险管理 根据%或$自动调整风险 可选择使用固定手数或根据交易量和点自动计算手数 使用 RR、点数或价格设置盈亏平衡止损 追踪止损设置 最大每日损失百分比,在达到目标时自动平仓所有交易。 保护账户免遭过多提款并阻止您过度交易 最大每日损失(以美元为单位)在达到目标时自动关闭所有交易。 保护账户免遭过多提款并阻止您过度交易 一键实现所有交易的盈亏平衡 自动计算从手机/电话发送的交易的风险 OCO 在设置中可用 交易和头寸管理 通过设置每月、每周、每天、每小时或每分钟的最大交易次数,停止过度交易和报复性交易。 高级挂单管理。 调整何时关闭挂单的规则 追踪挂单 支持市价订单和挂单 每日最大利润目标(以美元为单位)以确保头寸并停止
Rua TrailingStop BreakEven Little
PHAM KIM QUY RuaCoder
4.5 (2)
Rua TrailingStop BreakEven Little The EA not for Real Account. You can EA for Real Account with link:   https://www.mql5.com/en/market/product/47635 Uses of EA - Trailingstop: Move stoploss continuously. - Breakeven: Move the stoploss once. Custom parameters: All OrderOpenTime:     + true: acts on all order     + false: only affect the order opened since EA run All OrderType:     + true: acts on all order.     + false: only the order is running (Buy, Sell) TraillingStop: true (Use), false (do n
FREE
Quantum Currency Strength Indicator
QUANTUM TRADING SOFTWARE LIMITED
Your success as a forex trader depends on being able to identify when a currency or currency pair is oversold or overbought. If it is strong or weak. It is this concept which lies at the heart of forex trading. Without the Quantum Currency Strength indicator, it is almost impossible. There are simply too many currencies and too many pairs to do this quickly and easily yourself. You need help! The Quantum Currency Strength indicator has been designed with one simple objective in mind. To give you
The Compare Graphs indicator is an analysis tool that allows traders to compare two or more graphs on the same chart window. This indicator is commonly used in trading platforms such as MetaTrader and provides a clearer comparison of different financial instruments or time frames. Functions of the Compare Graphs indicator may include: Selecting Charts: The trader can select the charts he wants to compare, such as price charts of different currency pairs or indicators on the same chart. Setting
Blahtech Market Profile
Blahtech Limited
4.53 (15)
Was: $249  Now: $149   Market Profile defines a number of day types that can help the trader to determine market behaviour. A key feature is the Value Area, representing the range of price action where 70% of trading took place. Understanding the Value Area can give traders valuable insight into market direction and establish the higher odds trade. It is an excellent addition to any system you may be using. Blahtech Limited presents their Market Profile indicator for the MetaTrader community. In
Unlimited Binary Options Copier Remote is a powerful tool to copy binary options trades remotely between multiple accounts at different locations over internet. This is an ideal solution for signal provider, who want to share his binary options trades with the others globally on his own rules. One provider can copy trades to unlimited receivers and one receiver can get trade from unlimited providers as well. The provider can set the subscription expiry for each receiver, so that receiver will no
RaysFX Supertrend Bar RaysFX Supertrend Bar è un indicatore personalizzato per MetaTrader 4. Utilizza l'indice di canale delle materie prime (CCI) per generare segnali di trading. L'indicatore mostra dei puntini in una finestra separata sotto il grafico principale per indicare i segnali di trading. Caratteristiche principali: Calcola il CCI per diversi periodi temporali. Visualizza puntini per indicare i segnali di trading. Permette all'utente di modificare i periodi temporali e la distanza tra
Point61 Indicator
Evgeniy Machok
5 (1)
The Point61 indicator is the result of many years of monitoring of price behavior of currency pairs and metals. It is not a secret, that in times of uncertainty, traders are looking for possible levels of support and resistance - the point, where price should stop its movement. There are 2 possible scenarios at these points: 1. Reverse (correction) to the opposite direction; 2. Breakthrough to continue movement. Very often these points are used to set stop orders - TakeProfit or StopLoss
Arrow Micro Scalper 是一款专为剥头皮和短期交易而设计的指标,可集成到任何图表和金融工具(货币、加密货币、股票、金属)中。 在她的工作中,她使用波浪分析和趋势方向过滤器。建议在从 M1 到 H4 的时间范围内使用。 如何使用指标。 该指标包含 2 个用于更改设置的外部参数,其余参数已默认配置。 大箭头表示趋势方向的变化,蓝色箭头表示下降趋势的开始,粉红色箭头表示上升趋势的开始。 “ Only trending direction ”参数启用和禁用使用内部趋势的模式,提供使用您自己的趋势或不使用趋势的机会,并且还启用/禁用仅根据趋势显示趋势箭头和信号箭头。 小信号箭头,该指标最重要的对象,粉色代表“买入”交易,蓝色代表“卖出”交易。 “ Smoothing ”参数决定信号箭头出现的时间,操作范围为 7 到 25,为时间范围 M1-M5 选择大值,为 M15-H1 选择中值,为 H4 - D1 选择小值。 趋势箭头和开始信号箭头有警报。 指标不会重新绘制。
该指标的独特之处在于交易量核算算法:在所选时段内直接进行累积,而无需参考当天的开始。可以从计算中排除最后的柱线,那么当前数据对之前形成的显着水平(交易量)的影响较小。 为了更精确的计算,默认使用 M1 图表中的数据。规范了价格量的分配步骤。默认情况下,显示的右边框设置为用于分析的数据开头对应的栏,但如果需要,可以设置为您需要的栏。显示的音量带的长度(右边界)由系数调节,也可以向左或向右移动到 0(当前)条或参照当前条进行镜像。 参数: Accumulation period -  累积量计算周期 Number of excluded last bars - 从计算中排除的最后一根柱线的数量   Accumulation price step -  按价格参数的成交量总和步骤 Graph length multiplier - 显示数据的长度比例 Use data from timeframe - 用于分析的图表(时间范围) Graph show shift - 开始显示数据的移位,如果留为0,则数据将从分析数据周期开始时间对应的条开始显示; “-1”——显示在左侧; “-2” - 显示
Horizontal tick volumes (HTV) Horizontal tick volumes - an easy and convenient indicator of a horizontal market profile in a user-selected time. Produces a visual image of strong trading levels by maximum peaks past volumes and trading direction by color (sell or buy), and also allows you to detect smaller trading levels by differentiating past volumes. In the "Optimal" mode, when displayed on chart periods up to and including "M30", the data of one-minute bars are used, on H1 and H4 - five-minu
我们为您提供一个指标"蜡烛收盘台",它将成为您在贸易领域不可或缺的助手。 这就是为什么知道蜡烛何时关闭会有所帮助的原因: 如果你喜欢使用蜡烛花纹进行交易,你就会知道蜡烛何时关闭。 此指标将允许您检查是否形成了已知模式以及是否存在交易的可能性。 该指标将帮助您做好市场开放和市场关闭的准备。 可以设置一个计时器来创建计划新闻的预览,这样就可以检查市场对此的反应。 您可以设置指示灯,以便在蜡烛关闭前几秒钟发送警报/警告。 通知/警报/警报可以发送到: 屏幕警报 电子邮件 移动应用 MT4烛台计时器指示器为什么有用 那么烛台计时器什么时候有用呢?如果你长期交易,你可能不需要蜡烛计时器指示器,因为你的参赛不会受到一分钟或一小时的太大影响。但是,如果你在短时间内是黄牛或交易员,那么你知道时机非常重要。 外汇市场24小时开放,只在周末关门,有些策略可能会受到您入仓时出现错误时机的严重影响。 MT4蜡烛计时器指示器可以显示当前蜡烛中的剩余时间,以便为下一次蜡烛打开做好准备。 可以从这一指标中受益的一些情况例子有: 预定消息传出 地理市场开闭 预定发生的事件,通常是金融、经济或政治事件
RTSPattern
Tomas Belak
The indicator provides a superior alternative to price action analysis. It enables the identification of normalized patterns, which are then transformed into a graphical representation to forecast future steps within a time series. In the top-left corner, you'll find information regarding the expected prediction accuracy, determined through a complex MSQE calculation. You have the flexibility to adjust the time window, making it easy to validate the indicator's performance. Additionally, you can
该产品的买家也购买
Trade Assistant MT4
Evgeniy Kravchenko
4.43 (182)
它有助于计算每笔交易的风险,容易安装新的订单,具有部分关闭功能的订单管理, 7 种类型的追踪止损和其他有用的功能。 附加材料和说明 安装说明 - 应用程序说明 - 模拟账户应用程序的试用版 线条功能  - 在图表上显示开仓线、止损线、止盈线。 有了这个功能,就可以很容易地设置一个新的订单,并在开仓前看到它的附加特性。   风险管理  - 风险计算功能在考虑到设定的风险和止损单的大小的情况下,计算新订单的成交量。它允许你设置任何大小的止损,同时观察设定的风险。 批量计算按钮 - 启用 / 禁用风险计算。 在 " 风险 " 一栏中设置必要的风险值,从 0 到 100 的百分比或存款的货币。 在 " 设置 " 选项卡上选择风险计算的变量: $ 货币, % 余额, % 资产, % 自由保证金, % 自定义, %AB 前一天, %AB 前一周, %AB 前一个月。   R/TP 和 R/SL - 设置止盈和止损的关系。 这允许你设置相对于损失的利润大小。 例如, 1 : 1 - 这决定了 TP = SL 的大小。 2 : 1 - 这意味着 TP 是 SL 的两倍。 RR - 它禁用比率。  
欢迎来到 Trade Manager EA——这是一个终极风险管理工具,旨在使交易变得更直观、精准和高效。它不仅仅是一个下单工具,而是一个用于无缝交易计划、仓位管理和风险控制的全面解决方案。不论您是新手交易员、资深交易员,还是需要快速执行的剥头皮交易员,Trade Manager EA 都可以满足您的需求,适用于外汇、指数、大宗商品、加密货币等各种市场。 借助 Trade Manager EA,复杂的计算已成过去。只需分析市场,在图表上用水平线标记入场、止损和止盈,设置您的风险水平,Trade Manager 就会立即计算出理想的头寸规模,并实时显示以点、账户货币计价的止损和止盈。每笔交易都得以轻松管理。 主要功能: 头寸规模计算器 :根据定义的风险瞬间确定交易规模。 简单的交易计划 :在图表上用可拖动的水平线直接计划交易,设置入场、止损和止盈。 实时显示 SL 和 TP :以账户货币、点或分显示止损和止盈,便于分析。 高级保护工具 盈亏平衡选项 : 基本盈亏平衡 :当您的交易达到设定水平时自动保护利润。 多级盈亏平衡 :设置多达 4 个级别以逐步保护利润。 尾随止损选项 : 基本尾随
TradePanel MT4
Alfiya Fazylova
4.9 (86)
交易面板是一个多功能的交易助手。该应用程序包含超过 50 个用于手动交易的交易功能,并允许您自动化大多数交易操作。 注意,该应用程序在策略测试器中不起作用。购买之前,您可以在模拟帐户上测试演示版本。演示版 这里 。 完整说明 这里 。 贸易。 让您一键执行交易操作: 通过自动风险计算打开挂单和仓位。 一键打开多个订单和仓位。 打开订单网格。 按组关闭挂单和持仓。 头寸反转(关闭买入并打开卖出或关闭卖出并打开买入)。 锁定头寸(开立额外头寸,以平衡买入和卖出头寸的交易量)。 一键部分平仓所有仓位。 为同一价格水平的所有头寸设置止盈和止损。 将所有头寸的止损设置为该头寸的盈亏平衡水平。 开单建仓时,您可以应用以下功能: 计算交易量的多个订单或仓位之间的分布(一键开仓多个订单或仓位时)。 图表上未来订单交易水平的可视化。 设置开仓时允许的最大点差大小。 止盈和止损之间的自动比率。 虚拟止损和止盈。 根据当前点差的大小自动增加止损和止盈的大小。 根据 ATR 指标的读数计算止盈和止损。 设置挂单的到期日期。 挂单设置为“追踪”(挂单自动跟随当前价格移动指定距离)。 管理通过移动终端(手机)开立
The product will copy all telegram signal to MT4   ( which you are member  ) , also it can work as remote copier.  Easy to set up, copy order instant, can work with almost signal formats, image signal, s upport to translate other language to English Work with all type of channel or group, even channel have "Restrict Saving Content", work with  multi channel, multi MT5 Work as remote copier: with signal have ticket number, it will copy exactly via ticket number. Support to backtest signal. How to
Telegram To MT4 Receiver
Levi Dane Benjamin
5 (4)
将信号从您所属的任何渠道(包括私人和受限渠道)直接复制到您的 MT4。 该工具在设计时充分考虑了用户的需求,同时提供了管理和监控交易所需的许多功能。 该产品采用易于使用且具有视觉吸引力的图形界面。 自定义您的设置并在几分钟内开始使用该产品! 用户指南 + 演示  |     MT5版本  |     不和谐版本 如果您想尝试演示,请参阅用户指南。 Telegram To MT4 接收器在策略测试器中不起作用! Telegram 至 MT4 功能 一次复制多个通道的信号 从私人和受限频道复制信号 不需要机器人令牌或聊天 ID(如果出于某种原因需要,您仍然可以使用这些) 使用风险百分比或固定手数进行交易 排除特定符号 选择复制所有信号或自定义要复制的信号 配置单词和短语以识别所有信号(默认值应适用于 99% 的信号提供商) 配置时间和日期设置以仅在需要时复制信号 设置一次打开的最大交易量 交易和头寸管理 使用信号或自动设置的管理 通过设置每月、每周、每天、每小时或每分钟的最大交易次数,停止过度交易和报复性交易。 支持市价订单和挂单 每日最大利润目标(以美元为单位)以确保头寸并停止过度
Ultimate Trailing Stop EA
BLAKE STEVEN RODGER
4.33 (15)
This EA Utility allows you to manage (with advanced filtering) unlimited open orders (manual or EA) with 16 trailing stop methods: fixed, percent, ATR Exit, Chandelier Exit, Moving Average, Candle High Low Exit, Bollinger Bands, Parabolic, Envelope, Fractal, Ichimoku Kijun-Sen, Alligator, Exit After X Minutes or Bars, RSI and Stochastic. The trailing stop can be either real or virtual, and you can exit fully or with a partial close percent on touch or bar close.  Moreover, you can add (overrid
The Expert Advisor will help you forward all pop-up alert with screenshot from  MetaTrader 4 to Telegram channel/ group, also forward all notifications to Telegram. Parameters  -  Telegram Bot Token - create bot on Telegram and get token.  -  Telegram Chat ID  - input your Telegram user ID,  group / channel ID  -  Forward Alert - default true, to forward alert.  -  Send message as caption of Screenshot - default false, set true to send message below Screenshot  How to setup and guide  - Telegram
The product will copy all  Discord  signal   to MT4   ( which you are member  ) , also it can work as remote copier.  Easy to set up. Work with almost signal formats, support to translate other language to English Work with multi channel, multi MT4. Work with Image signal. Copy order instant, auto detect symbol. Work as remote copier: with signal have ticket number, it will copy exactly via ticket number. How to setup and guide: Let read all details about setup and download Discord To MetaTrader
News Trapper EA
Noha Mohamed Fathy Younes Badr
4.85 (13)
Hi, all.  News trapper EA It is an expert for trading news very safe expert  Automated Trading on the news of the economic calendar. It shows stable trading during last 10  years. EA doesn't use dangerous technologies like martingale, grid. The Expert is very simple to use.      sale will end after 48 h how to install it     and set files     read the blog         after purchase contact me to add you to   VIP   channel  The program contains flexible settings for trading on the news of the econo
Online Accounts Manager MT4
Kyra Nickaline Watson-gordon
5 (1)
OneClick Online Account Manager is a powerful utility that helps you to manage all your accounts from a centralized panel. It is suitable for all single account traders and specially for multiple accounts traders. The utility help you to : Monitor status of all accounts on a private web page. Some information such as account connection status, account profit, DD, Balance, Equity, Margin Level, Number of positions and orders, Daily and Weekly profit/loss and also overall summation of all these p
Ultimate MT4 to Telegram (UMT) sends controlled trades (via symbol, magic, comment) to your telegram channel. It sends open and closed trades, including pending orders and TP/SL modifications, along with chart screenshots, to any telegram channel. Additionally, you can send trade reports of open trades and summary profit/pip reports for day, week, or month. You can customize the design of the trade actions or reports with variables and emoticons.  A beautiful panel allows you to visualize all t
FX28 Trader
Tsvetan Tsvetanov
5 (1)
介绍FX28 Trader Dashboard – 您的终极交易管理工具 通过FX28 Trader Dashboard,解锁您交易体验的全部潜力,这是一款全面而直观的交易管理工具,旨在将您的外汇交易提升到新的水平。无论您是经验丰富的交易员还是刚刚开始您的金融之旅,这个强大的工具旨在简化您的交易活动并提高您的决策过程。 主要特点: 用户友好界面: FX28 Trader Dashboard拥有用户友好的界面,适应各个层次的交易员。通过几次点击轻松导航各种功能和工具,确保您只需轻松几下就完全掌控了交易。 实时市场数据: 利用实时市场数据源,始终保持领先地位,为您提供有关货币对、趋势和市场波动的最新信息。做出明智的决策,充满信心地执行交易。 高级交易分析: 通过高级分析深入了解您的交易绩效。跟踪交易历史,分析趋势,并识别模式,以优化您的策略和改善您的结果。 风险管理工具: 用我们强大的风险管理工具保护您的投资。轻松设置止损和获利订单,自定义仓位大小,并轻松实施风险收益比,确保自律和受控的交易方法。 多时间框架分析: FX28 Trader Dashboard允许您同时分析不同时间框架的市
RedFox Copier Pro
Rui Manh Tien
4.73 (11)
Time saving and fast execution Whether you’re traveling or sleeping, always know that Telegram To Mt4 performs the trades for you. In other words, Our   Telegram MT4 Signal Trader  will analyze the trading signals you receive on your selected Telegram channels and execute them to your Telegram to MT4 account. Reduce The Risk Telegram To Mt4   defines the whole experience of copying signals from   Telegram signal copier to mt4 platforms. Users not only can follow all instructions from the signa
Trade Copier Pro
Vu Trung Kien
4.57 (14)
Trade Copier Pro 是一个强大的工具,多账户之间进行远程复制的贸易超过互联网不同的位置。这是一个信号提供商的理想解决方案,谁想要与全球范围内对自己规则的人分享他的贸易。一个供应商的交易可以复制到多接收器和一个接收器可以得到贸易额从多供应商也是如此。 供应商和接收器可与供电内置的数据库管理系统来管理他的合作伙伴名单。 这个工具允许全局配置模式(copy过来互联网)和本地模式(在同一台PC/服务器内复制)之间进行选择。 要求: MetaTrader4的4.00版构建670或以上。 参考: 如果你只需要在本地复制与更低的价格,你可以检查Auto Trade Copier在: https://www.mql5.com/en/market/product/4676 以下是亮点功能:     在一个工具提供商或接收器之间转换角色。     一个供应商的交易可以复制到多接收器和一个接收器可以从多个供应商收到交易。     供应/接收器可通过供电数据库管理系统,而无需额外的工具管理自己的接收器/供应商名单(添加,删除,编辑,启用/禁用)。     全球模式(copy过来互联网)和本
Trade Assistant Pro 36 in 1
Makarii Gubaydullin
4.95 (19)
多功能工具:超过65个功能,其中包括:手数计算,价格行为,盈亏比,交易管理,供需区域。 演示版   |   用户手册   |  MT5版 该实用程序在策略测试器中不起作用:您可以在此处下载 演示版来测 试产品。 任何问题 / 改进意见 / 如果发生了故障或错误  都可以联系我 Trading functions require permitted auto trading (including on the broker's side) 简化,加快并且自动化你的交易过程。利用这款工具的控制功能就能增强普通交易端的执行力。 建立一笔新的交易:手数 / 风险 / 盈亏计算 1. 手数计算工具 (基于风险规模的交易量计算) 2. 风险计算工具 (基于手数大小的风险额计算) 3. 盈亏比 4. 订单的激活和触发,买入或卖出限价/买入或卖出止损:MT4也适用 5. 虚拟的止损/止盈 (隐藏的止损,止盈:交易商不可见) 6.  智能的止损/入场点:当价格柱在收盘时已超越了才入场 (避免无效触发) 7. 隐藏掉挂单 (虚拟的订单) 8. 预订挂单:在市场关闭的时候你也可以下挂单 (适合周末做计划的
This means now you can trade on multiple MetaTrader 4 accounts simultaneously, mirror the trades of any trading bot to your friends and family accounts (even if it is locked to your MT4 account number), create investment portfolios of many MT4 accounts, remove risk of unregulated Forex brokers, turn losing trading strategy into a winner and become an independent account manager immediately without the need to sign any contracts or opening expensive PAMM accounts with the broker. Reverse Trading
Riskless Pyramid
Snapdragon Systems Ltd
5 (1)
Introduction This powerful MT4 trade mangement EA offers a way potentially to aggressively multiply trade profits in a riskfree manner. Once a trade has been entered with a defined stoploss and take profit target then the EA will add three pyramid add-on trades in order to increase the overall level of profit. The user sets the total combined profit target to be gained if everything works out. This can be specified either as a multiple of the original trade profit or as a total dollar amount. Fo
2025 happy new year -50% discount ($199 -> $99) Advanced trading tool: One click smart orders that execute under your conditions Developed by trader for trading community:  position size calculator (lot size), open position after price action, strategy builder, set and forget trading, mobile notifications... Risk Management -  Risk percentage position size calculator, gain percentage, target risk reward ratio, spread and commissions are included in calculations 7 Advanced order types   - Set a
Chart Logic
D Armond Lee Speers
Chart Logic is here!  Chart automation for MT4: put your Ideas into Actions! Chart Logic is an EA for MT4 that lets you automate actions on your charts.  You define "conditions" and 'actions"; when all the conditions are true, then all the actions are triggered.  Conditions can refer to a wide range of observations, about account information, candle data, technical indicators, key levels, price, time, market data, trades and so on.  And actions can send alerts/notifications, open/close/modify tr
Auto Trailing Assistant
Emmanuel Lovski Ijeawele Maduagwuna
介紹自動追蹤助理 - 您的終極外匯自動追蹤管理解決方案 自動追蹤助手是一款非常先進的程序,旨在徹底改變您透過追蹤停損管理交易的方式。憑藉其全面的功能,這個強大的工具使您能夠輕鬆、精確地優化交易結果。 ATA  在下面的說明中代表 自動追蹤助理 。  (*)常規設定概述: 價格單位選擇 :使用者可以選擇 PIP 或 POINTs 尾隨選項來處理部位(無論您喜歡哪一種)。因此,如果您為 EURUSD(x ...) 頭寸輸入 200 點,則該實用程式在該頭寸上執行的追蹤距離通常會轉換為 20 點。 尾隨模式 :有六種尾隨模式。預設模式設定為百分比鎖定尾隨模式,模式一。這種模式最適合簡單的利潤保留。在某些情況下,市場方向會發生逆轉,並且有利可圖的貿易變得無利可圖。此模式確保當前市場價格與鎖定利潤價格水準之間保持合理的價差,以便在趨勢有利的情況下可以累積更多的利潤,在趨勢有利的情況下交易也不會造成損失。其次,如果趨勢顯著逆轉,交易者可以開始另一個頭寸,並滿足於最後一個頭寸以盈利告終的事實。 基於點的動態模式與眾所周知的典型 Meta Trader 追蹤功能相同。無需右鍵單擊每筆正在進行的交易來
Ultimate Trade Copier
BLAKE STEVEN RODGER
5 (1)
This trade copy utility allows you to instantly and seamlessly replicate and synchronize unlimited orders from multiple master accounts to multiple slave accounts on your local machine. You can create custom channels (or portfolios) with advanced filtering capabilities to copy from multiple master accounts to multiple slave accounts. Moreover, you can tailor these channels with a range of lot sizing and trade condition options to ensure that copied trades outperform the original source. You can
Custom Ultimate Sniper Dashboard
Hispraise Chinedum Abraham
5 (2)
这个自定义终极狙击手仪表盘是原始终极狙击手仪表盘指标的一个EA升级。它与多达98种不同的算法一起工作,以确保它能捕捉到你工作的资产类别上的趋势的真实性质。 它是对我们几个月来从大多数客户那里得到的很多建议和意见的直接回应。   这个自定义版本是完全可定制的。 由98个独立的自定义算法提供。 非常漂亮的视觉界面,因此你可以轻松和自信地跟踪任何货币对或时间框架的整体市场趋势 可以向telegram发送实时警报 允许你根据你所交易的货币对创建自己的指数 可以向你的手机实时发送警报,所以你不必在电脑前就知道有一个动作正在酝酿。 让你从输入设置中设置8个指数 让你设置你想获得警报的指数和时间框架 当检测到没有互联网连接时,会显示警报   自定义终极狙击手仪表盘已经进行了大量的优化,在动作开始后立即显示。这样,你就不会错过你感兴趣的货币对的任何变动。它的速度非常快,可以在移动发生时迅速捕捉到,并实时向你发送警报,这样你就可以利用移动的优势,而不必整天坐在办公桌前。 它是任何交易策略的一个超级补充,你可以将这个工具与任何其他交易策略和指标一起使用。它主要是为了与我们的其他指标配合使用。 它是完全可定
TakePropips TradePad Pro
Eric John Pajarillaga Aldana
5 (4)
TakePropips TradePad Pro 包括一个强大的交易管理器、货币强度计、账户报告工具、风险管理工具等等! 它是您将遇到的最先进的外汇交易经理和交易助手之一!对于想要更有效地管理贸易交易的交易者来说,它是完美的解决方案。 您可以在我们的博文中下载用户手册: User Manual 您可以在 Strategy Tester 上测试此交易系统(启用可视模式)。如果您喜欢在实时图表上进行测试,也可以给我发消息以获取 7 天试用版。 视频教程也可在说明下方获得更多详细信息。 如果您有任何疑问或需要帮助,请随时与我联系,我很乐意提供帮助。 TradePad Pro 适用于所有外汇对、金属、商品、指数和加密货币。 主要特点 订单管理 - 公开市场或挂单,轻松调整止盈、止损和手数大小。 获利计算 - 手动点数、ATR 乘数和风险回报率。 止损计算- 手动点,   ATR 乘数和供应/需求。 批量计算 - 手动点,   每笔交易的风险百分比和风险金额。 账户保护 - 回撤保护允许您设置账户回撤的最大限额以避免进一步损失。利润保护为您的账户设置最大利润限额以避免过度交易。 编辑订单管理
SPAs
Eugeni Neumoin
Программу можно использовать как советник для ручной и полуавтоматической торговли. Или как индикатор для выявления структуры рынка. В торговой части программы отсутствуют ордера Sell, Buy. А также лимитные и стоповые ордера. Вместо этого на график выводится торговая рамка для сделок на продажу -  SELL  или на покупку - BUY . У торговой рамки имеются три уровня. Уровень открытия будущего ордера. Уровень стопа и уровень профита. Влево от торговой рамки выводятся три линии. Перемещая данные линии
Mentfx Mmanage
Anton Jere Calmes
5 (15)
The added video will show you the full functionality, effectiveness, and simplicity of this trade manager. Drag and Drop Trade Manager. Draw your entry and have the tool calculate the rest. Advanced targeting and close portions of a trade directly available in tool (manage trades while you sleep). Market order or limit order on either side with factored spread. Just draw the entry, the tool does the rest. Hotkey setup to make it simple. Draw where you want to enter, and the stop loss, the tool c
Equity Protection EA
CARLOS ALBERTO VALLOGGIA
5 (3)
Equity Protection EA 一般特徵: 完全控制交易時段的結果。 控制所有外匯交易品種,指數,金屬,股票等的整體結果。對全球股票進行控制。 達到盈虧率時,關閉所有交易品種上的所有交易。- 數量和百分比均可更改的配置。 通過全局跟踪止損來保護結果- 本屆會議取得的成果記錄(更高的權益和更低的權益)。 登錄時,所有計算始終在資產負債表上執行,因此不會影響交易的平倉或平倉。 在Metatrader 4中,您可以用一定比例的賬戶損益來平倉單個交易。 觸發獲利或止損時自動關閉平台的選項。- 通知功能:觸發TP / SL級別時,將報告發送到電話(按通知)或電子郵件的選項。- 觸發TP / SL時可以選擇刪除掛單- 觸發TP / SL時可以選擇截屏並保存在文件中。- 更改字體大小的選項。- 選擇在“獲利百分比”和“止損百分比”中默認設置值 停用自动交易:达到全球止损或止盈水平时,股票保护将停用自动交易,以防止其他EA开立新交易。重要提示:对于Metaquotes市场的规则,“关闭自动交易”功能不可用,如果您需要使用该功能,请通过电子邮件与我联系:tradingxbots@gmail.
Telegram Signal pro
Sara Sabaghi
4.88 (8)
What is it? Think about it, you can send all the orders/positions info to your telegram channel or group to create your community or VIP signals on telegram. Position info means this EA forward all of your new positions open details (Open price, Open time, Position Type, position Symbol and volume), positions changes ( SL or TP modifying or pending price changes) and position close (Close price, profit or loss, position duration time) and also EA Send NEWS alert (Economic calendar event) on your
Unlimited Trade Copier Pro is a tool to copy trade remotely to multiple MT4, MT5 and cTrader accounts at different computers/locations over internet. This is an ideal solution for you if you are a signal provider and want to copy your trades to other receivers globally on your own rules. One provider can copy trades to multiple receivers and one receiver can get trade from multiple providers as well. The provider can even set the subscription expiry for each receiver, so that receiver will not b
ADAM for FTMO 40
Vyacheslav Izvarin
5 (1)
ADAM EA Special Version for FTMO  Our 1st EA created using ChatGPT technology Trade only GOOD and checked PROP FIRMS  Default parameters for Challenge $100,000 Tested on EURUSD and GBPUSD only  Use 15MIN Time Frame Close all deals and Auto-trading  before Weekend at 12:00 GMT+3  Friday For Prop Firms MUST use special Protector  https://www.mql5.com/en/market/product/94887 ----------------------------------------------------------------------------------------------------------------------------
作者的更多信息
Fibo World MT5
Pavel Verveyko
The indicator builds a graphical analysis based on the Fibonacci theory. Fibo Fan is used for the analysis of the impulses and corrections of the movement. Reversal lines (2 lines at the base of the Fibonacci fan) are used to analyze the direction of movements. The indicator displays the of 4 the target line in each direction. The indicator takes into account market volatility. If the price is above the reversal lines, it makes sense to consider buying, if lower, then selling. You can open posi
Trend Sync
Pavel Verveyko
5 (1)
The indicator shows the trend of 3 timeframes: higher timeframe; medium timeframe; smaller (current) timeframe, where the indicator is running. The indicator should be launched on a chart with a timeframe smaller than the higher and medium ones. The idea is to use the trend strength when opening positions. Combination of 3 timeframes (smaller, medium, higher) allows the trend to be followed at all levels of the instrument. The higher timeframes are used for calculations. Therefore, sudden change
Running along Lines MT5
Pavel Verveyko
5 (1)
The indicator draws support and resistance lines on an important part of the chart for making decisions. After the trend line appears, you can trade for a breakout or rebound from it, as well as place orders near it. Outdated trend lines are deleted automatically. Thus, we always deal with the most up-to-date lines. The indicator is not redrawn . Settings: Size_History  - the size of the calculated history. Num_Candles_extremum  - the number of candles on each side of the extremum. Type_Arrow
Turn
Pavel Verveyko
The indicator shows the market turning points (entry points). Reversals allow you to track rebound/breakout/testing from the reverse side of the lines of graphical analysis or indicators. Reversals can be an independent signal. The indicator allows you to determine reversals taking into account the trend and without it. You can choose a different period for the movement preceding the reversal, as well as the volatility coefficient. When plotting reversals, the indicator takes into account volati
The indicator allows you to quickly switch from one instrument to another, from one time period to another using the keyboard or buttons on the monitor. Each command can be assigned a hot key from 0-9, a-Z (case-insensitive) and VK_OEM_COMMA ("<" on the keyboard) and VK_OEM_PERIOD (">" on the keyboard). This can help you to operate the maximum number of instruments that are available at your broker, analyze more instruments/periods in less time. This product cannot be tested in the tester , beca
Ratio TP SL
Pavel Verveyko
5 (1)
This indicator allows you to measure the profitability of each specific transaction (the ratio of Stop and Profit). The indicator allows you to adjust the ratio by step size and number of steps. You can build an unlimited number of ratios to compare the risks from different movements. Note: in MT4, the number of horizontal lines in a single ratio cannot exceed 32. Building a line : click the " Ratio " button and draw a line (mouse click - the first point of the line, where the mouse is release
Corporate Report
Pavel Verveyko
5 (1)
The script displays info about the share's corporate reports and dividends. The data is downloaded from   investing.com : Report date Profit per share (EPS) Revenue Market capitalization Amount of dividends Date of payment of dividends Dividend income The product cannot be tested in the tester (since it is not possible to receive data from the Internet). Before launching:  Add 2   URL   https://ru.investing.com/earnings-calendar/Service/getCalendarFilteredData  and   https://ru.investing.com/di
Channel FTF
Pavel Verveyko
The Envelopes indicator determines the presence of a trend or flat. It has 3 types of signals, shows the probable retracement levels and levels of the possible targets. The Fibonacci coefficients are used in the indicator's calculations. Signals (generated when touching the lines or rebounding from lines): Trend - the middle line of the Envelopes has a distinct inclination; the lines below the channel's middle line are used for buy trades, the lines above the middle line and the middle line itse
Mr Big
Pavel Verveyko
The indicator shows and highlights the chart candles, which are formed as a result of large players entering the market in large volumes. Such candles can also be formed after achieving a certainty on the market, when most of the participants hold positions in the same direction. The movement is likely to continue in that direction after such candles. The indicator highlights the significant candles from the existing ones on the chart; The indicator allows identifying the trends based on candles
Splash
Pavel Verveyko
The indicator identifies the most suitable moment for entering the market in terms of market volatility, when the market has the strength to move (the signal is indicated by an arrow under the candle). For each of the signals, the presence of trends on the current and higher timeframes is determined, so that the signal is in the direction of the majority of positions opened on the market (denoted near the signal by abbreviations of timeframes with a trend present). The signal appears after the c
The indicator displays the key support and resistance levels on the chart. The significance of these levels lies in that the price may reverse or strengthen the movement when passing such levels, since they are formed as a consequence of the natural reaction of market participants to the price movement, depending on which positions they occupied or did not have time to occupy. The psychology of the level occurrence: there always those who bought, sold, hesitated to enter or exited early. If the
This indicator is a multitimeframe trading strategy. It has the levels for stop loss, take profit and entry point. The order level can also be set manually. The indicator uses the regularity of the market, which manifests itself on all instruments, and does not require adjustment of the parameters. The strategy uses a proprietary approach to determining: trend, volatility, hierarchy of timeframe significance, the size of the history period (the number of candles), which is important for making a
The indicator detects important peaks and troughs (extremes) on the chart. These points can be used to plot support/resistance levels and trend lines, as well as any other graphical analysis. These points can serve as reference points for setting trading orders. The indicator does not redraw . Settings: Size_History  - the size of the calculated history. Num_Candles_Right  - number of candles to the right of the peak or trough. Num_Candles_Left  - number of candles to the left of the peak or
Running along Lines
Pavel Verveyko
3 (2)
The indicator draws support and resistance lines on an important part of the chart for making decisions. After the trend line appears, you can trade for a breakout or rebound from it, as well as place orders near it. Outdated trend lines are deleted automatically. Thus, we always deal with the most up-to-date lines. The indicator is not redrawn . Settings: Size_History  - the size of the calculated history. Num_Candles_extremum  - the number of candles on each side of the extremum. Type_Arrow
Key Volumes
Pavel Verveyko
1 (1)
The indicator shows key volumes confirmed by the price movement. The indicator allows you to analyze volumes in the direction, frequency of occurrence, and their value. There are 2 modes of operation: taking into account the trend and not taking into account the trend (if the parameter Period_Trend = 0, then the trend is not taken into account; if the parameter Period_Trend is greater than zero, then the trend is taken into account in volumes). The indicator does not redraw . Settings History_S
Catch Impulse
Pavel Verveyko
This trading system is based on market impulses of varying complexity.   To generate a signal, the indicator uses the moments when the direction of the pulse and the necessary section of the trend coincide. The indicator also takes into account the current market volatility. Stop_loss tags can be set with the parameter "0" or "1", then Stop_Loss will take into account market volatility.   Take_Profit tags can be set with the parameter "0", then Take_Profit will take into account market volatil
Indexes
Pavel Verveyko
The stocks that make up the index are one of the drivers of the movement. Analyzing the financial performance of all elements of the index, we can assume further development of the situation. The program (script) displays corporate reports of shares that are part of the index selected in the settings.   "Indexes" cannot be tested in the tester (since there is no way to get information from the Internet). Information is downloaded from the site investing.com: Report Date Earnings per share (E
Fibo World
Pavel Verveyko
The indicator builds a graphical analysis based on the Fibonacci theory. Fibo Fan is used for the analysis of the impulses and corrections of the movement. Reversal lines (2 lines at the base of the Fibonacci fan) are used to analyze the direction of movements. The indicator displays the of 4 the target line in each direction. The indicator takes into account market volatility. If the price is above the reversal lines, it makes sense to consider buying, if lower, then selling. You can open posi
The indicator determines the state of the market: trend or flat. The state of the market is determined by taking into account volatility. The flat (trading corridor)is displayed in yellow. The green color shows the upward trend. The red color shows the downward trend. The height of the label corresponds to the volatility in the market. The indicator does not redraw . Settings History_Size   - the amount of history for calculation. Period_Candles  - the number of candles to calculate the indicat
The indicator plots flexible support and resistance levels (dots). A special phase of movement is used for construction. Levels are formed dynamically, that is, each new candle can continue the level or complete it. The level can provide resistance or support to the price even where it is no longer there. Also, support and resistance levels can change roles. The importance of levels is affected by: the amount of time the level is formed and the number of touches. The significance of these lev
The indicator is a trading system for short-term trading. Scalper Assistant helps to determine the direction of the transaction, and also shows the entry and exit points. The indicator draws two lines (possible points for opening positions). At the moment of the breakdown of the upper line up (and when all trading conditions are met), an up arrow appears (a buy signal), as well as 2 goals. At the moment of the breakdown of the lower line down (and when all trading conditions are met), a down ar
Gold n XAU
Pavel Verveyko
The trading system is designed to work with gold on time periods: 30M, 1H. The indicator allows you to adjust to the market situation. Parameters for 1H :   PERIOD=9F ,   FILTER=300 .   Parameters for  30M :   PERIOD=22B ,   FILTER=450 .   A small adjustment to a specific broker is allowed .   If you change the amount of history displayed, you may also need to adjust the parameters. The indicator is not redrawn.     "Gold n XAU" uses different rules for entering a trade and different rules fo
The indicator builds "psychological levels": levels of round numbers and intermediate levels of round numbers. Round numbers play an important role in forming support and resistance levels. There is a pattern in which the decline or growth of the price can stop at round numbers. The level whose price ends at 0 is the level of a round number of the first order. Intermediate level, this is the level between two round levels, for example, between 10 and 20 this is level 15. In the " Num_Zeros "
Ichimoku Map
Pavel Verveyko
Ichimoku Map (instant look at the markets) - built on the basis of the legendary Ichimoku Kinko Hyo indicator. The task of the Ichimoku Map is to provide information about the market strength on the selected time periods and instruments, from the point of view of the Ichimoku indicator. The indicator displays 7 degrees of buy signal strength and 7 degrees of sell signal strength. The stronger the trend, the brighter the signal rectangle in the table. The table can be dragged with the mouse. The
The indicator displays a stock chart of a non-standard type, in which the price and time have the same value. The usual chart of Japanese candlesticks does not take into account all the information that the time analysis can give. Renko charts do not use all the information that price can give in relation to time. The "Chart Price and Time" indicator takes into account price and time equally and shows the predominance of price or time. Taking into account price and time equally gives an idea
The indicator tracks sharp volatility (moments when the market has shown increased activity and movement may occur), on the selected instruments and time periods. The information is displayed as colored rectangles. Thus, it is possible to assess at a glance which tool should be given priority attention. The indicator will be useful for scalpers when they need a quick reaction or for traders working with a large number of instruments. The indicator does not redraw. The indicator displays 8 degree
Alert Creator
Pavel Verveyko
The Alert Creator indicator is designed to create alerts for selected conditions. You can select one or several indicators for the notification. If several conditions are selected, the alert is triggered when all the selected conditions are met. The signals can be configured separately for buying and separately for selling. Example, a buy alert: the closing price is above the moving average, the RSI is below 20. (In this example, 2 indicators are used to generate an alert: MA and RSI) At the
Trend Arithmetic
Pavel Verveyko
The indicator determines the strength of the trend and its possible reversal points, based on the author's arithmetic approach . Each new peak or trough is a trend development. Such peaks and troughs are numbered so that the strength of the trend development can be seen. Attempts to change the trend are also numbered. This gives an understanding of a possible change in the direction of the trend. Indicator signals are generated when trying to change the trend . In the settings, it is possible
Level Predictor
Pavel Verveyko
该指标绘制可能成为未来显着支撑位和阻力位的潜在水平。 该线越长,在该水平击穿后价格反转或价格变动增加的可能性就越高。 随着电平形成概率的降低,线的长度减小。 该指标不需要调整。 在设置中,您可以更改指示器的设计。 " Line_Length "按钮放置在图表上以调整线的长度(为了便于感知指标)。 所选的" Line_Length "设置将为每个时间段和仪器保存。 " Line_Length "按钮可以用鼠标拖动。 当悬停在按钮的左边缘时,它会用选定的颜色突出显示,按下时,数字会减少,指示线会缩短。 当您将鼠标悬停在按钮的右边缘时,它会以选定的颜色突出显示,按下时,数字会增加,指示线会延长。 _________________
Flat Control
Pavel Verveyko
The indicator defines a trading corridor, a flat market, and corrections. Allows you to compare the significance of different flat and trend areas (by time of existence and by volatility). This makes it possible to assess the market cycle and its mood at a glance. That is, how long does the flat last on average, and how long is the trend and what kind of volatility they have in points. As a rule, the longer the flat lasts, the more likely it is to accumulate the potential for a strong movem
筛选:
mambobody
462
mambobody 2022.06.28 04:25 
 

用户没有留下任何评级信息

krisnara123
2083
krisnara123 2020.12.15 20:57 
 

用户没有留下任何评级信息

Trader mql5
1265
Trader mql5 2019.04.24 10:15 
 

A very quick and easy way of measuring in points. It is unique and have not found anything like it! Excellent support from Pavel.

回复评论
版本 1.5 2020.12.08
Added a goal label - the goal is set automatically if the "goal" button is enabled.
(to set a goal, you need at least two lines in different directions).

Added text placemark orientation (right/left).

Added the ability to cancel the "delete all measuring lines" command
(you can select the desired number of seconds in the settings).

Average time indicators have been added to the "average values" text labels. And the number of measurement lines.
版本 1.4 2020.12.02
Added text labels for "average values".
"Average values" are calculated along the lines of the time period of the open chart.
The "measuring line" drawn on the H4 graph is visible and is taken into account in calculations only on the H4 graph.
版本 1.3 2020.12.01
1 Added new information about the line: time (now you can see the time period on which the line is drawn, and the number of candles in the line of this time period).
2 Added new information about the line: speed (average size of candlesticks in the line).
3 Improved drawing mechanism: you need to click the "Pips" button and draw on the graph (clicking the mouse is the first point of the line, where the mouse is released - the second point of the line).
4 Now you can drag the buttons with the mouse.
5 Keyboard shortcuts (you can assign keyboard shortcuts (A-Z) to on-screen buttons).
6 When you rebuild a line, the value of the text label changes immediately.
版本 1.2 2020.06.09
Recompilation.
版本 1.1 2019.06.18
Added settings:
1) indentation of the price tag.
2) option for calculating points (standard, fractional, rounded).