Future Candle Two Candle
- 指标
- Denis Luchinkin
- 版本: 1.1
- 更新: 27 三月 2018
- 激活: 20
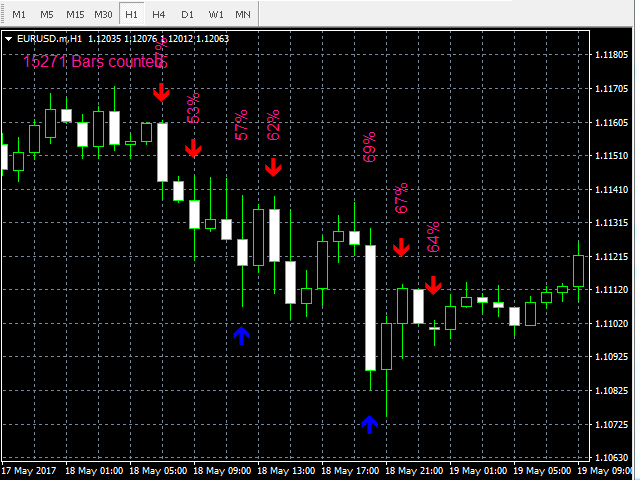
Future Candle Two Candle is an arrow indicator of candlestick patterns, based on the calculation of historical statistics. It identifies and calculates patterns consisting of two candles.
Advantages of the indicator
- Gives information about the next candle right now;
- The indicator values are based on statistical data on the history of the current instrument;
- Forecasts and displays the result of trading based on its signals;
- The colors of the indicator have been selected for a comfortable operation with the black and white styles of the chart;
- Despite the extensive calculations, it does not load the terminal.
Parameters
- Spread - spread in points for calculation of the expected value of trading results;
- Min_Win,% - the minimum percentage probability of occurrence of the event, necessary for using it as a signal;
- Min_Count - the minimum number of the same events in history necessary to calculate the statistics on the event (relevant for timeframes D1 and higher);
- Info_About_Future_Candle - display the additional information on the signal:
- Theoretical_Mathematical_Expectation - the theoretical expected value of the trading result for the current signal (recommended);
- Practical_Mathematical_Expectation - the practical expected value of the trading result for the current signal;
- Theoretical_Length_Of_Candle - the theoretical expected value of the length of the next candle in the signal's direction;
- Practical_Length_Of_Candle - the practical expected value of the length of the next candle in the signal's direction;
- Nothing - do not display the additional information (recommended);
- Bars_Count - the maximum number of bars for calculation;
- TextSize - size of the text on the chart;
- TextColor - color of the text on the chart;
- alertsOn - enable alerts;
- alertsMessage - display alerts in the terminal;
- alertsEmail - send an email using an address specified on the Email tab of the options window;
- alertsPush - send push notifications to the mobile terminals, whose MetaQuotes IDs are specified in the Notifications tab.
- alertsSound - play an audio file when an alert is generated;
- soundfile - name of the audio file.
How to Use the Indicator
Before launching the indicator, it is recommended to download the instrument's history or to scroll the chart 10 000 - 20 000 candles back (this is done quickly on the minimum scale). The indicator calculates the probability of price movement, as well as the theoretical and practical expected values of the trading results with consideration of the specified spread. Signals are generated only if the probability of upwards or downwards price movement is greater than the one specified in the settings and if the expected value of the trading result in that direction is greater than 0. The expected value of the trading result is displayed in points and depends on spread specified in the settings. Increasing the spread in the settings increases the accuracy of signals and decreases their amount. On the contrary, decreasing the spread decreases the accuracy of signals while increasing their number. It is recommended to specify a spread greater than the average spread on the instrument.
