• 概述
  • 评论 (18)
  • 评论 (86)
  • 新特性

Advanced Supply Demand MT5

4.5

任何新手或专业交易者的最佳解决方案!

该指标是一款独特、高质量、且价格合理的交易工具,因为我们已经整合了许多专有功能和新公式。 依据此更新,您将能够显示双重时间帧区域。 您不仅可以显示一个较高的时间帧,还可以同时显示图表时间帧,加上更高的时间帧:显示嵌套时区。 供需双方所有交易者都会喜欢它。 :)


重要信息披露

高级供需的最大潜力,请访问https://www.mql5.com/zh/blogs/post/720245 

想象您的交易如何得以改善,是因为您能够精准定位入场或目标位吗? 构建于新的底层算法,它可以更轻松地识别出买卖双方之间的潜在失衡。 这是因为它以图形方式展示供需最强劲区域,及其过去的表现(显示旧区域)。 这些功能旨在帮助您更轻松地发现最佳入场区域和价位。

现在您可以针对您的交易品种和时间帧来优化和编辑区域强度!

高级供需指标适用于所有产品和时间帧。 它是一个新的公式,非常新的功能是两个区域强度函数可由用户输入进行调整! 这在交易中是一大优势。 当您学习如何使用专有功能,例如带有价格游离最小 X 因子的区域强度时,您能够判断该区域强劲与否。

供需区域用作警报触发器。 您可以选择 3 种警报。 如果价格 1) 进入该区域,和/或 2) 突破该区域,和/或 3) 自该区域形成逆转蜡烛。 您可以在 MetaTrader 4 使用带声音的弹窗式警报,和/或推送电子邮件。 当您收到警报时,您就会知道作为交易者应该做什么。

一条消息会告诉您一连串突破了多少个需求区域,如此您就能顺势交易并寻找趋势的延续。

该指标可以检测嵌套的供需区域!

一个非常强大的功能! 警报将告知供需区域是否嵌套(在)更高时间帧的供需区域内! 可以过滤掉嵌套区域的所有警报。


参数

供需设置:

  • 打印区域之前的最少蜡烛数(用于实时图表)。
  • 价格游离的最小 X 因子 (ATR)(数字越大,区域越强劲)。 针对您的品种和时间帧优化此处!
  • 价格游离的最小 Y 因子(区域大小)第二个输入:数字越大,区域越强劲。 针对您的品种和时间帧优化此处!
  • 一个大区域的极限大小。 最大系数 (ATR)(超大的大区域将会减少。 数字越大,所允许的区域尺寸越大)。

MTF 设置:

  • 加入更高的时间帧
  • 更高的时间帧周期(如果 MTF 等于或低于图表时间帧,采用较高的那个)
  • 打印区域之前的更高时间帧的最少蜡烛数
  • 价格游离的最小 X 因子 (ATR) MTF
  • 价格游离的最小 Y 因子(区域大小)MTF
  • 一个大区域的极限大小。 最大因子 (ATR) MTF(超大区域将会减少。 数字越大,所允许的区域尺寸越大)。
  • 显示内部价格标签 MTF
  • 显示外部价格标签 MTF

图标设置:

  • 显示内部价格标签。
  • 显示外部价格标签。
  • 显示老旧区域(供需计数器需要,见下文)。
  • 显示昨天的最高价/最低价
  • 显示今天的轴点
  • 显示一连串突破供需区域数量(计数器)
  • 显示在上方角落
  • 在生鲜蜡烛上绘制延伸矩形

警报设置:

  • 警报区域命中
  • 警报区域突破
  • 区域逆向蜡烛警报
  • 仅嵌套区域警报! (位于 MTF)
  • 假突破警报
  • FBO 最小柱线点
  • FBO 柱线 收盘价回踩 % (20-90)
  • FBO 形态柱线计数 (1-3)
  • 弹窗式警报(MT4 弹窗和声音)
  • 发送电子邮件警报
  • 发送推送警报

颜色设置:

  • 您知道如何使用它。 每个区域都有自己的颜色。
    若要查看完整列表点击此处

其它设置:

  • 使用 PIN (用于 EA)
  • 显示供应区域的最大数量
  • 显示需求区域的最大数量
  • 若要查看完整列表点击此处

小贴士:

  1. 用户手册:点击这里
  2. 使用我的模板(见评论)。
  3. 针对您的交易品种和时间帧优化区域强度。
  4. 保持顺势。 该指标主要与我的其他专业货币强度指标之一配合使用。
  5. 查看个人资料上我的新闻和博客,了解交易系统和交易示例。

如果您有任何问题,我会随时为您提供帮助。

由衷地问候,Bernhard


评论 18
Ely Alsedy
5880
Ely Alsedy 2024.03.15 09:56 
 

it's a great tool to use for assessing the market zones and make a decision also very good to spot fake outs i love to use it with Demark channel or another channel indicator the support and the author gets a THUMBS UP from me

Claudio Jones
167
Claudio Jones 2024.01.28 21:50 
 

I bought it today at first very promising, light and well built indicator. In the backtest, the reversal arrows work very well in conjunction with the alerts. Everything working perfectly.

update 27/06/24 - without a doubt it remains an excellent indicator.

great profits over this period, I'm on an insane streak. Thanks Bernhard!!!

Heyneke
55
Heyneke 2023.11.09 20:25 
 

Insanely accurate indicator ! Took the time to study the logic and settings behind the indicator. Strongly doubt you’ll find better on the market. Thanks a mil

推荐产品
Noize Absorption Index
Ekaterina Saltykova
Noize Absorption Index - is the manual trading system that measures the difference of pressure between bears forces and bulls forces. Green line - is a noize free index that showing curent situation. Zero value of index shows totally choppy/flat market.Values above zero level shows how powerfull bullish wave is and values below zero measures bearish forces.Up arrow appears on bearish market when it's ready to reverse, dn arrow appears on weak bullish market, as a result of reverse expectation.
Owl Smart Levels MT5
Sergey Ermolov
4.07 (28)
MT4版本  |   FAQ Owl Smart Levels Indicator 是一個完整的交易系統,包含 Bill Williams 的高級分形、構建正確的市場波浪結構的 Valable ZigZag 以及標記準確入場水平的斐波那契水平等流行的市場分析工具 進入市場和地方獲利。 策略的详细说明 指示灯使用说明 顾问-贸易猫头鹰助手助理 私人用户聊天 ->购买后写信给我,我会将您添加到私人聊天中,您可以在那里下载所有奖金 力量在於簡單! Owl Smart Levels 交易系統非常易於使用,因此適合專業人士和剛開始研究市場並為自己選擇交易策略的人。 策略和指標中沒有隱藏的秘密公式和計算方法,所有策略指標都是公開的。 Owl Smart Levels 允許您快速查看進入交易的信號,突出顯示下訂單的水平並向您發送有關已出現信號的通知。 優點很明顯: 清楚地顯示主要和更高時間框架的趨勢方向。 指示儀器信號的出現。 標記開單、止損設置和固定利潤的水平。 沒有多餘的,只有必要的結構! ZigZag 表示全球趨勢的方向,因此也表示貿易方向。 市場反轉點的短線清楚地表明在什麼水平上構建斐波那
Maximum Trend Arrows OT MT5
Mulweli Valdaz Makulana
STRICTLY FOR BOOM INDEX ONLY!!!!! Here I bring the Maximum Trend Arrows OT1.0 MT5 indicator. This indicator is made up of a combination of different trend indicators for entries and exits, for entries an orange arrow will paint on the chart below the current market and a red flag for closing of trades and it produces buy arrows only. When the orange arrow appears, it will appear along with it's sound to notify you. The 1H timeframe is recommended, don't use it anywhere else than on the 1H timefr
Magic Finger 能帮助你清晰的发现趋势及交易机会。此系统根据经典策略加上个人交易经验制作。您也可以根据此指标加上您的交易风格去编写EA。 手指指向为开仓信号,变色线为趋势确认。如果您是日内交易者,可以选择在交易活跃的时间段内交易,参考变色线作为下单方向依据,手指信号作为过滤器。 如果你是趋势交易者,可以选择在H1以上的周期,在关键价格区域等待手指信号的出现,并入市交易,然后以变色线作为趋势的确认。 止损可以止损圆点作为依据。 输入参数如下: RISK 5 MONEY RISK 2.0 AlertOption ********************************* Local Alert true TimesOfAlerts 2 E-Mail Alert false App PUSH Notification  false  Display_Option    *********************************  Barclor_Display  true  RS_Display   true  Line2_Display
Heiken Ashi Smoothed Strategy is a very simple but powerful system to get forex market trend direction. This indicator is actually 2 indicators in 1 pack, Heiken Ashi and Heiken Ashi Smoothed Moving Average both included. Because HA (Heiken Ashi) and HAS (Heiken Ashi Smoothed) are calculated in the same one system event with necessary buffers and loop only, so it is the FAST, OPTIMIZED and EFFICIENT HA having the combined indicator of MetaTrader 5. You can choose to display HA and HAS in the sam
Cumulative Delta NG
Anton Polkovnikov
Cumulative delta indicator As most traders believe, the price moves under the pressure of market buying or selling. When someone redeems an offer standing in the cup, the deal is a "buy". If someone pours into the bid standing in the cup - the deal goes with the direction of "sale". The delta is the difference between purchases and sales. A cumulative delta - the difference between the cumulative sum of purchases and sales for a certain period of time. It allows you to see who is currently contr
An indicator of pattern #31 ("Long Island") from Encyclopedia of Chart Patterns by Thomas N. Bulkowski. The second gap is in the opposite direction. Parameters: Alerts - show alert when an arrow appears   Push - send a push notification when an arrow appears (requires configuration in the terminal) GapSize - minimum gap size in points ArrowType - a symbol from 1 to 17 ArrowVShift - vertical shift of arrows in points   ShowLevels - show levels ColUp - color of an upward line ColDn - color of a d
Your Trend Friend
Luigi Nunes Labigalini
5 (1)
The trend is your friend! Look at the color of the indicator and trade on that direction. It does not  repaint. After each candle is closed, that's the color of the trend. You can focus on shorter faster trends or major trends, just test what's most suitable for the symbol and timeframe you trade. Simply change the "Length" parameter and the indicator will automatically adapt. You can also change the color, thickness and style of the lines. Download and give it a try! There are big movements w
Atomic Analyst MT5
Issam Kassas
4.32 (19)
首先值得强调的是,该交易指标是非重绘、非延迟的指标,这使其成为手动和机器人交易的理想选择。 用户手册:设置、输入和策略。 Atomic Analyst是一种PA价格行动指标,利用价格的力量和动量来寻找市场上更好的机会。配备了高级过滤器,可帮助去除噪音和假信号,并提高交易潜力。使用多层复杂的指标,Atomic Analyst扫描图表,并将复杂的数学计算转化为任何初学者都能理解并用来做出一致交易决策的简单信号和颜色。 “Atomic Analyst”是专为新手和经验丰富的交易者量身定制的综合交易解决方案。它将高级指标和一流功能融合为一体的交易策略,使其成为所有类型交易者的多功能选择。 日内交易和剥头皮策略:专为快速准确的日内交易和短期交易而设计。 日内和摆动交易策略:可用作追求价格大幅波动的日内和摆动交易者的可靠工具。 多货币和市场:凭借其可靠的精度,在不同的工具和市场上运作。 多个时间框架:可在多个时间框架上使用,性能良好。 稳定性:所有指标均不重绘、不重绘和不滞后,确保可靠的信号。 信号清晰度:提供箭头信号,用于清晰的入场和出场点。 实时警报:通过交易入场、SL和TP警报通知交易者
How to use Pair Trading Station Pair Trading Station is recommended for H1 time frame and you can use it for any currency pairs. To generate buy and sell signal, follow few steps below to apply Pair Trading Station to your MetaTrader terminal. When you load Pair Trading Station on your chart, Pair Trading station will assess available historical data in your MetaTrader platforms for each currency pair. On your chart, the amount of historical data available will be displayed for each currency pai
Wave Trend MT5
Diego Arribas Lopez
MT4 Version Wave Trend MT5 Wave Trend is an oscillator, which helps identifing in a extremely accurate manner market reversals. The Oscillator being obove the overbought level and a cross down of the fast into the slow MA usually indicates a good SELL signal. If the oscillators is below the oversold level and the fast MA crosses over the slower MA usually highlights a good BUY signal. The Wave Trend indicator can be also used when divergences appear against the price, indicating the current move
Robust median Renko style indicator for creating custom charts resembling Median Renko, Mean Renko, Turbo Renko and Better Renko candles as well as vanilla Renko with wicks plus Point-O charts. This all in one package provides all of the signals needed by day traders, scalpers, and even long-term traders. Main characteristics The indicator is an overlay on the main chart so it is possible to utilize one-click trading and order manipulation directly on the custom charts. Visual order placement i
Crash 1000 Scalping Indicator for the Crash 1000 Deriv Synthetic Index. Introduction The Crash 1000 Scalping Indicator is a specialized tool designed for the Crash 1000 index on the Deriv Synthetic market. This indicator is particularly useful for scalping on the M1 timeframe, helping traders to identify precise entry and exit points for buy positions. It is designed to be non-repainting, providing clear signals with audible alerts and push notifications, and is compatible with mobile devices th
Inguz
Maxim Kuznetsov
Ing (inguz,ingwar) - the 23rd rune of the elder Futhark ᛝ, Unicode+16DD. Add some runic magic to your trading strategies. The correct marking of the daily chart will indicate to you the successful moments for counter-trend trading. Simple to use, has high efficiency in volatile areas. Be careful in lateral movements. Signals ᛝ are generated when the main lines of construction intersect. Red arrow down - recommended sales Blue up arrow - recommended purchases rare purple arrows indicate exce
Renko Gold
Ignacio Agustin Mene Franco
Renko Gold! clearly indicates the floors and ceilings where it goes from 4 lines, the line below that marks the floor in green confirming with the thinnest line clarifies the purchase entry, the same is for sale, the top line marks the ceiling and the thinnest red line marks the sale, This indicator works for all temporalities! For Forex and Synthetic Indices markets! It also works for crypto markets! Good profit! World Investor.
Introduction The "Two Moving Average Crossover" indicator for MetaTrader 5 (MT5) is a technical analysis tool that displays two moving averages and notifies when the moving averages cross each other. The indicator calculates and plots two moving averages, one of which is faster and the other is slower. When the faster moving average crosses above the slower moving average, it is considered a bullish signal, indicating a potential trend reversal or the start of a new uptrend. Conversely, when th
Mine Farm
Maryna Kauzova
Mine Farm is one of the most classic and time-tested scalping strategies based on the breakdown of strong price levels. Mine Farm is the author's modification of the system for determining entry and exit points into the market... Mine Farm - is the combination of great potential with reliability and safety. Why Mine Farm?! - each order has a short dynamic Stop Loss - the advisor does not use any risky methods (averaging, martingale, grid, locking, etc.) - the advisor tries to get the most
This indicator is the same as the popular Heiken Ashi Smoothed. The Heikin Ashi indicator for MetaTrader 5 already exists, but it has two disadvantages: It paints the candles not accurate. It's not possible to change the candle width. See also Heikin Ashi in MQL5 Code Base . In this version there are no such disadvantages.
首先,值得强调的是,这个交易工具是非重绘、非重画和非滞后的指标,非常适合专业交易。 在线课程,用户手册和演示。 智能价格行动概念指标是一个非常强大的工具,既适用于新手,也适用于经验丰富的交易者。它将超过20个有用的指标合并到一个指标中,结合了高级交易思想,如内圈交易员分析和智能资金概念交易策略。该指标侧重于智能资金概念,提供有关大型机构交易方式的见解,帮助预测它们的动向。 它在流动性分析方面尤其擅长,有助于理解机构的交易方式。它擅长预测市场趋势,并仔细分析价格波动。通过将您的交易与机构策略对齐,您可以更准确地预测市场走向。该指标多才多艺,擅长分析市场结构,识别重要的订单区块,并识别各种模式。 它擅长识别BOS和CHoCH等模式,理解动量的转变,并突出显示供需强劲的关键区域。它还擅长发现强大的不平衡,并分析价格创造更高高点或更低低点的模式。如果您使用斐波那契回撤工具,该指标可以满足您的需求。它还可以识别相等的高点和低点,分析不同的时间框架,并通过仪表板显示数据。 对于使用更高级策略的交易者,该指标提供了工具,如公平价值差指标和优惠和折扣区域的识别。它特别关注高时间框架订单区块,并
Antique Trend
Nadiya Mirosh
The Antique Trend Indicator is a revolutionary trend trading and filtering solution with all the important features of a trend tool built into one tool! The Antique Trend indicator is good for any trader, suitable for any trader both for Forex and binary options. There is no need to configure anything, everything has been perfected by time and experience, it works great during flats and trends. The Antique Trend indicator is a tool for technical analysis of financial markets, reflecting curren
Mega Spikes Max
Niccyril Chirindo
5 (1)
Are you tired of missing out on the biggest opportunities in Boom and Crash trading? Mega Spikes Max is your ultimate tool for dominating the markets, giving you the precision and confidence you need to succeed. Why Choose Mega Spikes Max? Stay Ahead with Real-Time Alerts Never miss a profitable trade again. Get instant notifications directly to your mobile or desktop when a spike is imminent, even if you're away from your screen. Accurate Spike Detection Engineered for pinpoint accuracy, Mega
Rigonstructor
Mark Lapukha
5 (1)
这是一个构造函数。即策略的创造者。而且不仅如此。这是 MetaTrader 5 中大多数标准内置指标的信号指标。将您的指标组合成信号箭头。例如,您有一个策略,您需要找出其盈利能力,在菜单中包含必要的项目并获取统计数据。如果您没有策略,可以在互联网上获取,或者创建自己的策略。 Rigonstruktor 将帮助您解决这一切。该套件包括现成的外汇、倒卖和二元期权策略。包括文字说明。视频培训课程已经为您准备好了。还有电报聊天来获取支持和帮助。取出并连接指示器。得到一个箭头。探索策略。查看统计数据并得出结论。设计师为此准备了一切。还有时间过滤器,以及许多变化。您可以随时在支持和帮助聊天中询问和查找。构造函数的版本将更新,添加越来越多的指标。
对任何新手或专家交易者来说都是最好的解决方案! 这个指标是一个独特的、高质量的、负担得起的交易工具,因为我们已经纳入了一些专有的功能和一个秘密的公式。只需一张图表,它就能给出所有28种货币对的警报。想象一下,你的交易将如何改善,因为你能够准确地确定新趋势或剥头皮机会的触发点 建立在新的基础算法上,它使识别和确认潜在交易变得更加容易。这是因为它以图形方式显示了一种货币的强势或弱势是否正在加速,并测量了这种加速的速度--把它想象成你汽车中的速度表。当你加速时,事情显然会发生得更快,这在外汇市场上也是一样的,即如果你配对的货币正在向相反的方向加速,你就会发现一个潜在的有利可图的交易。 货币动量的垂直线和箭头将指导你的交易! 动态的市场斐波那契23水平被用作警报触发器,将适应市场活动。如果冲动触及黄色触发线,您将在MetaTrader或您的电子邮件或推送警报中收到警报。然后你就知道作为一个交易员应该做什么。货币对和方向已经给出。只要点击警报按钮,就可以切换到该货币对或打开一个新的图表,以便进一步分析。警报级别可以通过用户输入来改变,可以选择3个敏感度级别。 尽早获得新趋势的初始化触发
Candle Pattern Finder MT5
Pavel Zamoshnikov
4.2 (5)
This indicator searches for candlestick patterns. Its operation principle is based on Candlestick Charting Explained: Timeless Techniques for Trading Stocks and Futures by Gregory L. Morris. If a pattern is detected, the indicator displays a message at a bar closure. If you trade using the MetaTrader 4 terminal, then you can download the full analogue of the " Candle Pattern Finder for MT4 " indicator It recognizes the following patterns: Bullish/Bearish (possible settings in brackets) : Hammer
HMA Trend Professional MT5
Pavel Zamoshnikov
4.25 (4)
Improved version of the free HMA Trend indicator (for MetaTrader 4) with statistical analysis. HMA Trend is a trend indicator based on the Hull Moving Average (HMA) with two periods. HMA with a slow period identifies the trend, while HMA with a fast period determines the short-term movements and signals in the trend direction. The main differences from the free version: Ability to predict the probability of a trend reversal using analysis of history data. Plotting statistical charts for analyzi
Blahtech Market Profile MT5
Blahtech Limited
5 (10)
Was: $249  Now: $149   Market Profile defines a number of day types that can help the trader to determine market behaviour. A key feature is the Value Area, representing the range of price action where 70% of trading took place. Understanding the Value Area can give traders valuable insight into market direction and establish the higher odds trade. It is an excellent addition to any system you may be using. Inspired by Jim Dalton’s book “Mind Over Markets”, this indicator is designed to suit the
Flow Bookmap
Thalles Nascimento De Carvalho
Flow Bookmap:可视化市场流动并保护您的交易 ️ 想通过准确的买卖信息主宰市场吗? Flow Bookmap 是一款为希望深入了解市场行为的交易者设计的终极工具。它将订单流数据转化为 MT5 图表上的直观界面,突出显示对快速和安全决策至关重要的区域。 如何运作 Flow Bookmap 解释了市场上买家和卖家之间的互动,突出了关键的不平衡区域(imbalances): 当买方占主导地位时,价格往往会下跌,因为卖方在更有利的条件下调整价格。 当卖方占主导地位时,价格往往会上涨,基于相同的平衡逻辑。 此外,指标直接在图表上绘制信息,随着实时数据的收集创建历史。这意味着,随着计算的完成,指标会构建不平衡区和买卖双方的互动,允许动态且精准地可视化市场条件。大宗价格区间充当图表上的防守区域,帮助保护您的交易。 Flow Bookmap 的独特优势 1️⃣ 清晰直观的图形界面 直接在图表上查看: 突出的买卖双方。 不平衡区域(imbalances)使用特定颜色: 绿色:强烈的买方压力。 红色:强烈的卖方压力。 金色(Gold):关键的不平衡区域。 2️⃣ 利用兴
PipFinite Trend PRO MT5
Karlo Wilson Vendiola
4.84 (551)
Breakthrough Solution For Trend Trading And Filtering With All Important Features Built Inside One Tool! Trend PRO's smart algorithm detects the trend, filters out market noise and gives entry signals with exit levels. The new features with enhanced rules for statistical calculation improved the overall performance of this indicator. Important Information Revealed Maximize the potential of Trend Pro, please visit www.mql5.com/en/blogs/post/713938 The Powerful Expert Advisor Version Automatin
PZ Penta O MT5
PZ TRADING SLU
The Penta-O is a 6-point retracement harmonacci pattern which usually precedes big market movements. Penta-O patterns can expand and repaint quite a bit. To make things easier this indicator implements a twist: it waits for a donchian breakout in the right direction before signaling the trade. The end result is an otherwise repainting indicator with a very reliable trading signal. The donchian breakout period is entered as an input. [ Installation Guide | Update Guide | Troubleshooting | FAQ | A
该产品的买家也购买
Quantum TrendPulse
Bogdan Ion Puscasu
5 (13)
介绍 Quantum TrendPulse   ,这是一款终极交易工具,它将 SuperTrend   、   RSI 和 Stochastic 的强大功能整合到一个综合指标中,以最大限度地发挥您的交易潜力。该指标专为追求精准和效率的交易者而设计,可帮助您自信地识别市场趋势、动量变化以及最佳进入和退出点。 主要特点: 超级趋势整合: 轻松跟随当前的市场趋势并乘上盈利浪潮。 RSI 精度: 检测超买和超卖水平,非常适合把握市场逆转时机,可用作 SuperTrend 的过滤器 随机精度: 利用随机振荡在波动的市场中寻找隐藏的机会, 用作超级趋势的过滤器 多时间范围分析: 从 M5 到 H1 或 H4,在不同时间范围内关注市场动态。 可定制的警报: 当您的自定义交易条件得到满足时收到通知,这样您就不会错过任何交易。 无论您是新手还是经验丰富的交易员,   Quantum TrendPulse 都能为您提供所需的优势,帮助您增强策略并自信地进行交易。借助这一强大的指标,将洞察力转化为利润 — 掌控您的交易! ***购买 Quantum TrendPulse,即可免费获得 Quantum Tr
TPSpro RFI Levels MT5
Roman Podpora
4.53 (19)
指示       俄罗斯 -        英语   建议 与指示器一起使用     -       TPSpro 趋势专业版 -   MT4版本       交易中的一个关键要素是做出买卖交易工具决定的区域或水平。尽管主要参与者试图隐藏他们在市场中的存在,但他们不可避免地会留下痕迹。我们的任务是学习如何识别这些痕迹并正确解释它们。 主要功能: 向卖家和买家显示活跃区域! 该指标显示所有正确的初始买入和卖出脉冲水平/区域。激活这些水平/区域后,开始寻找切入点,水平会改变颜色并填充特定阴影。此外,还会显示箭头,以便更直观地了解情况。 显示更高时间范围内的级别/区域(MTF 模式) 添加了使用更高时间间隔显示级别/区域的功能。此外,该指标还具有自动趋势检测功能(   TPSproTREND PRO   )。 用于交易的单独专业的逐步算法。 该算法专为日内交易而设计,既可顺势交易,也可逆势交易。每个活动模板均提供详细说明。 适用于多种时间范围 。 TPSpro RFI 水平指标可用于图表上的任何时间范围,从一分钟(M1)开始一直到每月(MN)。 图形和声音警报。 该指标提供图形和声音指示,
RelicusRoad Pro MT5
Relicus LLC
4.78 (18)
现在$ 147(更新后增加到$ 499) - 无限帐户(PC或Mac) RelicusRoad 用户手册 + 培训视频 + 访问 Private Discord Group + VIP 身份 一种看待市场的新方式 RelicusRoad 是世界上最强大的外汇、期货、加密货币、股票和指数交易指标,为交易者提供保持盈利所需的所有信息和工具。我们提供技术分析和交易计划,帮助每一位交易者取得成功,从初学者到高级。它是一个关键的交易指标,可以提供足够的信息来预测未来的市场。我们相信一个完整的解决方案,而不是图表上几个没有意义的不同指标。这是一个多合一指标,显示无与伦比且非常准确的信号、箭头 + 价格行为信息。 RelicusRoad 基于强大的人工智能,提供缺失的信息和工具来教育您并使您成为交易专家,成为成功的交易者。 几乎所有技术指标都滞后,这意味着它们只能报告已经发生的事情。因此,他们只确认您过去可以看到的价格已经在哪里。我们相信领先指标可以预测未来价格,而无需重新绘制,也不要过度依赖可能改变并导致重新绘制的滞后指标。如果您根据滞后指标进行交易并建立头寸,您就知道您已经大部分时间
介绍     Quantum Breakout PRO   ,突破性的 MQL5 指标,正在改变您交易突破区域的方式!由拥有超过13年交易经验的资深交易员团队开发,     量子突破 PRO     旨在通过其创新和动态的突破区域策略将您的交易之旅推向新的高度。 量子突破指标将为您提供带有 5 个利润目标区域的突破区域的信号箭头,以及基于突破框的止损建议。 它既适合新手交易者,也适合专业交易者。 量子 EA 通道:       点击这里 重要的!购买后请私信我领取安装手册。 建议: 时间范围:M15 货币对:GBPJPY、EURJPY、USDJPY、NZDUSD、XAUUSD 账户类型:ECN、Raw 或 Razor,点差极低 经纪商时间:GMT +3 经纪商:IC Markets、Pepperstone with Raw 和 Razor 的点差最低 规格: 不重漆! 最多 5 个建议利润目标区域 建议止损水平 可定制的盒子。您可以设置自己的 Box Time Start 和 Box Time End。 接触 如果您有任何疑问或需要帮助,请通过私人消息与我联系。
Royal Scalping Indicator M5
Vahidreza Heidar Gholami
5 (6)
Royal Scalping Indicator is an advanced price adaptive indicator designed to generate high-quality trading signals. Built-in multi-timeframe and multi-currency capabilities make it even more powerful to have configurations based on different symbols and timeframes. This indicator is perfect for scalp trades as well as swing trades. Royal Scalping is not just an indicator, but a trading strategy itself. Features Price Adaptive Trend Detector Algorithm Multi-Timeframe and Multi-Currency Trend Low
可以说,这是您可以为MetaTrader平台找到的最完整的谐波价格形成自动识别指标。它检测19种不同的模式,像您一样认真对待斐波那契投影,显示潜在的反转区域(PRZ),并找到合适的止损和获利水平。 [ 安装指南 | 更新指南 | 故障排除 | 常见问题 | 所有产品 ] 它检测19种不同的谐波价格形态 它绘制了主要,衍生和互补的斐波那契投影(PRZ) 它评估过去的价格走势并显示每个过去的形态 该指标分析其自身的质量和性能 它显示合适的止损和获利水平 它使用突破来表明合适的交易 它在图表上绘制所有样式比率 它实现了电子邮件/声音/视觉警报 受斯科特·M·卡尼(Scott M. Carney)的书的启发,该指标旨在满足最纯粹和最熟练的交易者的需求。但是,它采取了一种使交易更容易的方式:在向交易发出信号之前,它会等待Donchian朝正确方向突破,从而使交易信号非常可靠。 斐波那契投影与向量无关 它实现了电子邮件/声音/推送警报 它绘制了ABCD投影 重要提示: 为了符合 Scott M. Carney先生 的商标申诉,某些图案名称已重命名为不言自明的替代方式, Scott M.
CONTACT US  after purchase to get the Indicator Manual. Try Now—Limited 50% Discount for First 10 Buyers! Download the  Metatrader 4 Version Due to regulatory restrictions, our service is unavailable in certain countries such as India, Pakistan, and Bangladesh. William Delbert Gann (W.D. Gann) was an exceptional market analyst, whose trading technique was based on a complex blend of mathematics, geometry, astrology, and ancient mathematics which proved to be extremely accurate. A Note from t
PZ Mean Reversion MT5
PZ TRADING SLU
3 (2)
采用专业和量化方法进行均值回归交易的独特指标。它利用了价格以可预测和可衡量的方式转移并返回均值这一事实,这允许明确的进入和退出规则大大优于非量化交易策略。 [ Installation Guide | Update Guide | Troubleshooting | FAQ | All Products ] 清晰的交易信号 非常容易交易 可定制的颜色和尺寸 实现性能统计 优于大多数交易策略 显示合适的止损和止盈水平 它实现了电子邮件/声音/视觉警报 这个怎么运作 该指标从更高的时间范围测量完全可定制的移动平均线的标准偏差,并使用趋势跟踪方法精确地找到交易。交易是通过深入当前图表的价格行为发现的,并在价格返回到平均价格区间时关闭,根据您选择的更高时间范围计算。由于其编码方式,该指标将远离高波动性和强劲趋势市场,并且仅在可预测的情况下进行交易,在可接受的波动性与方向性比率范围内,回归均值是可行的。 指标剖析 绿线是更高时间范围内的移动平均线(也就是平均值) 虚线区域是移动平均线周围的典型价格区间 蓝线是看涨交易的突破价格 红线是看跌交易的突破价格 交易是针对均值进行的,并在典型的价格
Elliot Waves Analyzer Pro
Viktor Weidenthal
2.67 (3)
Elliot Waves Analyzer Pro calculates Elliot Waves to Help Identify Trend direction and Entry Levels. Mainly for Swing Trading Strategies. Usually one would open a Position in trend direction for Wave 3 or a Correction for Wave C . This Indicator draws Target Levels for the current and next wave. Most important Rules for Elliot Wave Analysis are verified by the Indicator.  The Pro version analyzes Multiple Timeframes and shows the Subwaves and Target-Levels.   For an Overview  " Elliot Waves Anal
Blahtech Supply Demand MT5
Blahtech Limited
4.54 (13)
Was: $299  Now: $149  Supply Demand uses previous price action to identify potential imbalances between buyers and sellers. The key is to identify the better odds zones, not just the untouched ones. Blahtech Supply Demand indicator delivers functionality previously unavailable on any trading platform. This 4-in-1 indicator not only highlights the higher probability zones using a multi-criteria strength engine, but also combines it with multi-timeframe trend analysis, previously confirmed swings
Quantum Trend Sniper
Bogdan Ion Puscasu
4.73 (51)
介绍   量子趋势狙击指标 ,突破性的 MQL5 指标,正在改变您识别和交易趋势反转的方式!由拥有超过13年交易经验的资深交易员团队开发,     量子趋势狙击指标   旨在通过其创新的方式以极高的准确度识别趋势反转,将您的交易之旅推向新的高度。 ***购买量子趋势狙击指标,即可免费获得量子突破指标!*** 当量子突破指标识别出趋势反转时,它会向您发出警报和信号箭头,并建议您三个止盈水平。 它既适合新手交易者,也适合专业交易者。 量子 EA 通道:       点击这里 MT4版本:       点击这里 建议: 时间范围: 所有时间范围。为了获得最佳结果,我们建议在 M15、M30 和 H1 时间范围内使用它。 货币对:欧元兑美元、英镑兑美元、澳元兑美元、欧元兑英镑、, EURAUD,  XAUUSD 账户类型:ECN、Raw 或 Razor,点差极低 经纪时间:任意 经纪商:IC Markets、Pepperstone with Raw 和 Razor 的点差最低 建议止损:50 点 建议止盈水平:20 点、50 点和 100 点 规格: 不重漆! 最
TPA True Price Action indicator reveals the true price action of the market makers through 100% non-repainting signals strictly at the close of a candle! TPA shows entries and re-entries, every time the bulls are definitely stronger than the bears and vice versa. Not to confuse with red/green candles. The shift of power gets confirmed at the earliest stage and is ONE exit strategy of several. There are available now two free parts of the TPA User Guide for our customers. The first "The Basics"
AT Forex Indicator MT5
Marzena Maria Szmit
5 (5)
The AT Forex Indicator MT5 is a sophisticated trading tool designed to provide traders with a comprehensive analysis of multiple currency pairs. This powerful indicator simplifies the complex nature of the forex market, making it accessible for both novice and experienced traders. AT Forex Indicator uses advanced algorithms to detect trends, patterns and is an essential tool for traders aiming to enhance their forex trading performance. With its robust features, ease of use, and reliable signal
TrendMaestro5
Stefano Frisetti
note: this indicator is for METATRADER4, if you want the version for METATRADER5 this is the link:  https://www.mql5.com/it/market/product/108106 TRENDMAESTRO ver 2.4 TRENDMAESTRO recognizes a new TREND in the bud, he never makes mistakes. The certainty of identifying a new TREND is priceless. DESCRIPTION TRENDMAESTRO identifies a new TREND in the bud, this indicator examines the volatility, volumes and momentum to identify the moment in which there is an explosion of one or more of these data a
MetaForecast M5
Vahidreza Heidar Gholami
5 (2)
MetaForecast能够根据价格数据中的谐波来预测和可视化任何市场的未来走势。虽然市场不总是可预测的,但如果价格中存在模式,MetaForecast可以尽可能准确地预测未来。与其他类似产品相比,MetaForecast通过分析市场趋势可以生成更精确的结果。 输入参数 Past size (过去的尺寸) 指定MetaForecast用于创建生成未来预测模型的柱数量。该模型以一条黄色线绘制在所选柱上。 Future size (未来的尺寸) 指定应预测的未来柱数量。预测的未来以粉色线表示,并在其上绘制了蓝色回归线。 Degree (程度) 此输入确定了MetaForecast将在市场上进行的分析级别。 Degree 描述  0 对于程度0,建议使用较大的值来设置“过去的尺寸”输入,以覆盖价格中的所有高峰、低谷和细节。  1 (建议的) 对于程度1,MetaForecast可以理解趋势,并通过较小的“过去的尺寸”生成更好的结果。  2 对于程度2,除了趋势,MetaForecast还可以识别反转点。对于大于1的程度,必须使用较高的“细节”和“噪音减少”输入值。  大于2 不建议使用大于
Fxaccurate Trend Trading is a method that focuses on identifying and capitalizing on market trends in the foreign exchange (Forex) market. This strategy is grounded in the principle that once a trend is established, it tends to persist, allowing traders to enter positions that align with the market's prevailing direction. Fxaccurate Trend Trading relies on various tools, indicators, and methodologies to spot, confirm, and trade in the direction of a trend, whether it’s upward (bullish) or downwa
AriBot
Arman Belassarov
AriMax   – AI-Powered Trading Robot AriMax is a cutting-edge AI-powered trading robot designed to help traders maximize profits while minimizing risk. Utilizing advanced machine learning algorithms and real-time market analysis, AriMax identifies high-probability trade opportunities with precision and speed. Key Features:     AI-Driven Market Analysis   – Analyzes market trends and patterns to make data-driven trading decisions.     Automated Execution   – Places trades seamlessly with optimiz
Wave Anatomy MT5
Trade The Volume Waves Single Member P.C.
Wave Anatomy Visit:  http://www.trafethevolumewaves.com  for more information Construct your own 5 Waves and analyze the price movements stages: Easy Movement Hard time to move Fast move This indicator is based on Wyckoff’s, David’s Weis and my Speed Index Theory. This indicator will you help analyze what is happening in 5 Price Waves that you can construct yourself. This tool is designed for scalpers and swing traders and will help them to analyze any wave on any timeframe at the same time. Fur
Volume by Price MT5
Brian Collard
3.25 (4)
The Volume by Price Indicator for MetaTrader 5 features Volume Profile, Footprint and Market Profile TPO (Time Price Opportunity). Volume and TPO histogram bar and line charts. Volume Footprint charts. TPO letter and block marker collapsed and split structure charts. Static, dynamic and flexible range segmentation and compositing methods with relative and absolute visualizations. Session hours filtering and segment concatenation with Market Watch and custom user specifications. Graphical layeri
ON Trade Gann Squares MT5
Abdullah Alrai
5 (2)
Gann 方块指标是一种强大的市场分析工具,基于 W.D. Gann 在其“市场预测数学公式”一文中介绍的数学概念。该指标融合了与平方数(如 144、90 和 52)有关的 Gann 技术,以及平方 9。此外,它还融入了  关于如何将平方 9 与通道和星形图案结合使用的方法。 用户手册和使用方式: 在使用该指标之前,我们建议您阅读用户手册,并与我们联系以获得任何澄清。您可以在我们的网站上找到完整的用户手册。 该指标提供了 MT5 的完整版本供购买,也提供了 MT4 的免费版本供测试。提供了两个版本的链接供您方便使用。 主要特点和功能: Gann 方块指标为您的交易环境提供了全套工具,使您能够基于几何图案和 Gann 的概念做出明智的决策。以下是主要特点: 平方 9 分析:   该指标可以绘制与平方 9 有关的各种元素,包括水平线、星形图案、网格、Gann 扇形等。这在您的图表上提供了 Gann 的几何概念的视觉表示。 Gann 方块:   该指标绘制了 Gann 方块 52、90 和 144,使您能够可视化和分析它们与价格走势的关系。 自由 Gann 星形图案:   该指标使您能够直接
CBT Quantum Maverick 高效的二元期权交易系统 CBT Quantum Maverick 是一款精心设计的高性能二元期权交易系统,专为追求精准、简单和纪律的交易者打造。无需自定义,该系统经过优化,可直接使用并产生高效结果。只需遵循信号操作,稍加练习即可掌握。 主要特点: 信号精准度: 基于当前K线生成下根K线交易信号,无频繁重绘。 市场多样性: 专为二元期权交易设计,兼容多种经纪商和资产类别,适应不同交易偏好。 兼容性: Deriv Synthetic Charts :适用于任何时间框架。 OTC Charts :来自如 Quotex、PocketOption、Binomo、Stockity、IQOption、Exnova、OlympTrade、Deriv、Binolla 和 Homebroker 的经纪商,可导入 MT5(一周内提供免费导入支持,之后需支付服务费用)。 外汇、加密货币和商品市场 :扩展资产利用。 高收益二元资产 :建议使用90%以上的高回报率资产。 额外优势: 全面的交易计划: 提供系统化和纪律性交易的分步支持计划。 高效时间利用: 每天仅需一
Imbalance DOM Pro
Thalles Nascimento De Carvalho
5 (1)
Imbalance DOM Pro:通过订单簿不平衡提升您的交易 您在MT5上有订单簿的访问权限吗?想将您的交易提升到一个新水平吗? 如果您是依靠订单流来做决策的交易员,Imbalance DOM Pro可以改变您的分析方式。专为短线交易员和剖析订单流的交易员设计,它能识别订单簿中的不平衡,揭示出宝贵的机会,让您能够快速精确地进行交易。 抓住小幅价格波动中的机会 Imbalance DOM Pro是那些希望捕捉细微价格波动的交易员的理想工具。凭借先进的计算,指标能解读订单簿中的不平衡,为快速的进出提供重要的见解。 重要提示:请确认MT5上是否提供订单簿的访问权限 在使用Imbalance DOM Pro之前,请确保您的经纪商提供MT5上的订单簿访问权限。该指标依赖这些实时数据,因为MT5不存储订单簿的历史数据。因此,Imbalance DOM Pro只能实时工作,提供市场上买卖订单的即时解读。 Imbalance DOM Pro的优势 通过特定颜色进行订单簿的高级分析 Imbalance DOM Pro通过颜色编码简化了订单流的解读: 绿色: 买单。
IVISTscalp5
Vadym Zhukovskyi
5 (6)
我们向您介绍iVISTscalp5指标,它不仅独特,而且在交易操作中也非常有效。该指标基于时间数据,是多年金融市场经验和深入分析的结果。iVISTscalp5指标是手动交易的优秀工具。便利性、简单性和可视化 - 所有的复杂性都隐藏在内部。我们将iVISTscalp5指标的设置和使用简化到了最大程度。该指标适用于MT5终端中您所拥有的所有金融工具。 操作时间为UTC+3的早上4点到晚上8点。 iVISTscalp5指标菜单(见截图1): History - 计算行情的周数 dT_min - 选择时间间隔的时间(分钟) TFline - 绘制水平成交量(时间帧) BARSline - 绘制水平成交量(条数) TFtrend1 - 绘制日线通道(时间帧) BARStrend1 - 绘制日线通道(条数) TFtrend2 - 绘制周线通道(时间帧) BARStrend2 - 绘制周线通道(条数) ALERT_TIMER - 设置闹钟 ALERT - 开启/关闭闹钟 Save - 开启/关闭将时间记录到文本文件。 图表上的红色和蓝色旗帜表示时间(VIST智能剃须系统的信号)。卖出信号为红旗,买入
MetaBands M5
Vahidreza Heidar Gholami
4.5 (2)
MetaBands使用强大且独特的算法绘制通道并检测趋势,以便为交易者提供进出交易的潜在点。它是一个通道指标和强大的趋势指标。它包括不同类型的通道,可以通过使用输入参数简单地合并以创建新通道。MetaBands使用所有类型的警报通知用户市场事件。 功能 支持大多数通道算法 强大的趋势检测算法 能够合并不同类型的通道 多时间帧和多货币(信号矩阵) 所有类型的警报功能(声音、屏幕闪烁、推送通知、电子邮件、弹出窗口、箭头) 它永远不会重绘 趋势检测 MetaBands使用在通道内振荡的蓝色线来检测趋势。当该线遇到通道的上界时,表明开始下跌趋势,当它遇到下界时,表明开始上涨趋势。如果蓝线接近中线,则市场处于整理期。 该指标使用独特的方法来检测趋势。一开始可能看起来有些复杂,但如果您观看视频教程,您就会意识到它是多么强大且易于使用。 入场和出场信号 当趋势变化或价格穿过上下通道时,MetaBands会立即通过不同的方法提醒交易者,这些方法可以在指标设置中启用。 信号矩阵 要监视来自不同时间框架的多个符号并在一个地方查看信号,请单击右上角按钮或按键盘上的M键以打开信号矩阵。该矩阵可以快速概览
WanaScalper
Isaac Wanasolo
1 (1)
A scalping indicator based on mathematical patterns, which on average gives signals with relatively small SL, and also occasionally helps to catch big moves in the markets (more information in the video) This indicator has three main types of notifications: The first type warns of a possible/upcoming signal on the next bar The second type indicates the presence of a ready signal to enter the market/open a position The third type is for SL and TP levels - you will be notified every time price re
FxaccurateLS
Shiv Raj Kumawat
WHY IS OUR FXACCCURATE LS MT5 THE PROFITABLE ? PROTECT YOUR CAPITAL WITH RISK MANAGEMENT Gives entry, stop and target levels from time to time. It finds Trading opportunities by analyzing what the price is doing during established trends. POWERFUL INDICATOR FOR A RELIABLE STRATEGIES We have made these indicators with a lot of years of hard work. It is made at a very advanced level. Established trends provide dozens of trading opportunities, but most trend indicators completely ignore them! The
Royal Wave Pro M5
Vahidreza Heidar Gholami
3.5 (4)
Royal Wave is a Trend-Power oscillator which has been programmed to locate and signal low-risk entry and exit zones. Its core algorithm statistically analyzes the market and generates trading signals for overbought, oversold and low volatile areas. By using a well-designed alerting system, this indicator makes it easier to make proper decisions regarding where to enter and where to exit trades. Features Trend-Power Algorithm Low risk Entry Zones and Exit Zones Predictions for Overbought and Over
PZ Day Trading MT5
PZ TRADING SLU
2.83 (6)
该指标仅使用价格行为分析和donchian渠道以锯齿形检测价格反转。它是专门为短期交易而设计的,根本不需要重新粉刷或补漆。对于精明的交易者来说,这是一个绝佳的工具,旨在增加他们的运作时间。 [ 安装指南 | 更新指南 | 故障排除 | 常见问题 | 所有产品 ] 极易交易 它在每个时间段都提供价值 实施自我分析统计 它实现了电子邮件/声音/视觉警报 基于可变长度的突破和拥挤区域,该指标仅使用价格行为来选择交易并对市场快速做出反应。 显示过去信号的潜在利润 该指标分析其自身的质量和性能 突围的损失突出显示并解决 该指标是不可重涂和不可重涂的 该指标将帮助盘中交易者不要错过单个价格反转。但是,并非所有价格反转都是一样的,也不是具有相同的可行质量。决定要突破哪些突破而忽略哪些取决于交易者的良好判断。 如何解释统计数据 该指标研究其自身信号的质量,并在图表上绘制相关信息。将分析每笔交易,并在图表的左上角显示总体历史结果,这使您可以针对任何给定的工具和时间范围自行优化指标参数。每个乐器和时间表都有其自己的最佳设置,您可以自己找到它们。 最大优惠交易:对于任何给定的交易,MFE都是最好的结
EXCLUSIVE! JUST  10 COPIES  AVAILABLE!   BONUS AUX VIP Club 2024 : Include EA CAP, CEP, LDH, PSC307 & AO4C to enhance the performance of this tool to its maximum potential  Click Here to Download Files   ( for users only ) FREE Trading Education Available Daily via Zoom --- For More Info or Instant Message Click link ---  https://t.me/abcdwave Transform your trading with the "Five Magic Bullets" Indicator, tailored for traders who embrace the power of Elliott Wave Chaos Theory.
作者的更多信息
Dynamic Forex28 Navigator
Bernhard Schweigert
5 (4)
Dynamic Forex28 Navigator - 下一代外汇交易工具。 当前 49% 折扣。 Dynamic Forex28 Navigator 是我们长期流行的指标的演变,将三种功能合二为一: 高级货币强度 28 指标 (695 条评论)+ 高级货币 IMPULSE 带警报 (520 条评论)+ CS28 组合信号(奖励)。 有关指标的详细信息 https://www.mql5.com/en/blogs/post/758844 下一代强度指标提供什么? 您喜欢的原始指标的一切,现在通过新功能和更高的精度进行了增强。 主要特点: 专有货币强度公式。  所有时间范围内的平滑和准确的强度线。 非常适合识别趋势和精确进入。 动态市场斐波那契水平(市场斐波那契)。  此指标独有的独特功能。 斐波那契应用于货币强度,而不是价格图表。 适应实时市场活动以获得准确的反转区域。 实时市场动量。  第 9 行显示市场是活跃还是被动。 对于定时交易至关重要。 全面的警报和显示。  每种货币最强的买入和卖出动量。 ​​28 对的双重动量买入和卖出。 超买/超卖警告外部范围和止损。 反转
Advanced Supply Demand
Bernhard Schweigert
4.91 (294)
现在优惠 33%! 任何新手或专业交易者的最佳解决方案! 该指标是一款独特、高质量、且价格合理的交易工具,因为我们已经整合了许多专有功能和新公式。 依据此更新,您将能够显示双重时间帧区域。 您不仅可以显示一个较高的时间帧,还可以同时显示图表时间帧,加上更高的时间帧:显示嵌套时区。 供需双方所有交易者都会喜欢它。 :) 重要信息披露 高级供需的最大潜力,请访问 https://www.mql5.com/zh/blogs/post/720245   想象您的交易如何得以改善,是因为您能够精准定位入场或目标位吗? 构建于新的底层算法,它可以更轻松地识别出买卖双方之间的潜在失衡。 这是因为它以图形方式展示供需最强劲区域,及其过去的表现(显示旧区域)。 这些功能旨在帮助您更轻松地发现最佳入场区域和价位。 现在您可以针对您的交易品种和时间帧来优化和编辑区域强度! 高级供需指标适用于所有产品和时间帧。 它是一个新的公式,非常新的功能是两个区域强度函数可由用户输入进行调整! 这在交易中是一大优势。 当您学习如何使用专有功能,例如带有价格游离最小 X 因子的区域强度时,您能够判断该区域强劲与否。 供需
Currency Strength Exotics
Bernhard Schweigert
4.87 (31)
目前8折优惠! 对任何新手或专家交易者来说都是最好的解决方案! 这个指标是专门用来显示任何符号的货币强度,如异国货币对、商品、指数或期货。它是同类产品中的第一个,任何符号都可以添加到第9行,以显示黄金、白银、石油、DAX、US30、MXN、TRY、CNH等的真实货币强度。这是一个独特的、高质量的、负担得起的交易工具,因为我们已经纳入了一些专有的功能和一个新的公式。想象一下,你的交易将如何改善,因为你能够准确地确定新趋势或剥头皮机会的触发点? 用户手册:点击这里   https://www.mql5.com/en/blogs/post/708876 它适用于所有时间框架。你将很快能够看到TREND! 根据新的基础算法设计,它使识别和确认潜在交易变得更加容易。这是因为它以图形方式显示了8种主要货币和一种符号的强弱。 该指标显示了8种主要货币(澳元加元瑞士法郎欧元英镑日元新西兰美元)的强弱线,再加上一个符号! 该指标显示了符号的真实价值。例如:对于XAUUSD(黄金):价格以美元报价。如果黄金在上涨,你怎么能知道是黄金的强势还是美元的弱势?只有当黄金走强时,我们才会进行交易。该指
Advanced Currency IMPULSE with ALERT
Bernhard Schweigert
4.9 (484)
目前31%的折扣!! 对任何新手或专家交易者来说都是最好的解决方案! 这个指标是一个独特的、高质量的、负担得起的交易工具,因为我们已经纳入了一些专有的功能和一个秘密的公式。只需一张图表,它就能给出所有28种货币对的警报。想象一下,你的交易将如何改善,因为你能够准确地确定新趋势或剥头皮机会的触发点 建立在新的基础算法上,它使识别和确认潜在交易变得更加容易。这是因为它以图形方式显示了一种货币的强势或弱势是否正在加速,并测量了这种加速的速度--把它想象成你汽车中的速度表。当你加速时,事情显然会发生得更快,这在外汇市场上也是一样的,即如果你配对的货币正在向相反的方向加速,你就会发现一个潜在的有利可图的交易。 货币动量的垂直线和箭头将指导你的交易! 动态的市场斐波那契23水平被用作警报触发器,将适应市场活动。如果冲动触及黄色触发线,您将在MetaTrader或您的电子邮件或推送警报中收到警报。然后你就知道作为一个交易员应该做什么。货币对和方向已经给出。只要点击警报按钮,就可以切换到该货币对或打开一个新的图表,以便进一步分析。警报级别可以通过用户输入来改变,可以选择3个敏感度级别。 尽
Advanced Currency Strength28 Indicator
Bernhard Schweigert
4.9 (652)
目前26%的折扣 任何新手或专家交易者的最佳解决方案! 这个指标是一个独特的、高质量的、可负担得起的交易工具,因为我们纳入了一些专有的功能和一个新的公式。只需一个图表,你就可以读出28个外汇对的货币强度!想象一下,你的交易将如何得到改善,因为你的交易是在你的手中进行的。想象一下,你的交易将如何改善,因为你能够准确地确定新趋势或剥头皮机会的触发点? 用户手册:点击这里  https://www.mql5.com/en/blogs/post/697384 这是第一本,原版的! 不要买一个毫无价值的崇拜者的克隆品。 特别的 子窗口中的箭头显示强劲的货币势头GAP将指导你的交易! 当基础货币或报价货币处于超卖/超买区域(外盘斐波那契水平)时,在个人图表的主窗口中出现警告信号。 当货币力量从外围区间回落时,回撤/反转警报。 十字星模式的特别警报 可选择多个时间框架,以快速查看趋势! 货币强度线在所有的时间框架中都非常平稳,当使用较高的时间框架来识别总体趋势,然后使用较短的时间框架来确定精确的入口时,效果非常好。你可以根据自己的意愿选择任何时间框架。每个时间框架都由其自身进行了优化。
GOLD Impulse with Alert
Bernhard Schweigert
4.6 (10)
这个指标是我们2个产品 Advanced Currency IMPULSE with ALERT  +   Currency Strength Exotics 的一个超级组合。 它适用于所有时间框架,并以图形方式显示8种主要货币和一种符号的强势或弱势冲动! 该指标专门用于显示任何符号的货币强度加速,如黄金、异国货币对、商品、指数或期货。这是它的第一个指标,任何符号都可以被添加到第9行,以显示黄金、白银、石油、DAX、US30、MXN、TRY、CNH等的真实货币强度加速(冲动或速度)。 建立在新的基础算法上,它使识别和确认潜在的交易更加容易。这是因为它以图形方式显示了一种货币的强势或弱势是否正在加速,并测量了这种加速的速度--把它想象成你汽车中的速度表。当你加速时,事情显然会发生得更快,这在外汇市场上也是一样的,即如果你配对的货币正在向相反的方向加速,你就会发现一个潜在的有利可图的交易。 动态市场斐波那契28水平被用作警报触发器,将适应市场活动。如果冲动击中黄色触发线,你将收到警报。然后你就知道作为一个交易员应该做什么。货币对和方向已经给出。只需点击警报按钮,就可以切换到该货
目前八折优惠! 对任何新手或专家交易者来说都是最好的解决方案! 这个仪表板软件适用于28种货币对。它基于我们的两个主要指标(高级货币强度28和高级货币冲动)。它对整个外汇市场提供了一个伟大的概述。它显示高级货币强度值,货币运动速度和28个外汇对在所有(9)时间段的信号。想象一下,当你可以使用图表上的单一指标观察整个市场,以确定趋势和或剥头皮的机会时,你的交易将得到改善 我们已经在这个指标中建立了一些功能,使你更容易识别强势和弱势货币,同时识别和确认潜在的交易。该指标以图形方式显示货币的强势或弱势是增加还是减少,以及它在所有时间段的表现。 增加的新功能是动态市场斐波那契水平,它适应当前的市场条件变化,这是一个已经在我们的高级货币强度28和高级货币冲动指标中使用的成熟的加分项。 在交易时,总是将弱势货币和强势货币配对,这个新指标将帮助你做到这一点。 用户手册:点击这里  https://www.mql5.com/en/blogs/post/708783 特点  显示每个时间段的ACS28和GAP-speed(冲动)的货币强度值。 列:颜色代码以7种颜色显示货币强度:强势
Supply and Demand Dashboard PRO
Bernhard Schweigert
4.8 (20)
目前八折优惠! 这个仪表板是一个非常强大的软件,可用于多个符号和多达9个时间段。 它是基于我们的主要指标(最佳评论:高级供应需求)。 Advanced Supply Demand 该仪表板提供了一个伟大的概述。它显示。   筛选后的供需值,包括区域强度评级。 区间内和区间外的点位距离。 它突出了嵌套的区域。 在所有(9个)时间段内,它对所选符号发出4种警报。 它是高度可配置的,以满足您的个人需求! 您的利益! 对每个交易者来说,最重要的问题是。 什么是入市的最佳水平? 在强大的供应/需求区域内或附近进入你的交易,以获得最佳的成功机会和风险/回报。 我的止损的最佳位置是哪里? 把你的止损放在强势供应/需求区的下方/上方是最安全的。 我的最佳盈利目标是什么? 你的退出策略和你的进入策略一样重要,了解更高的时间框架图可以帮助你。对于买入,使用下一个供应区作为目标,对于卖出,使用下一个需求区作为目标。在回撤到供应区或需求区时进场,以确保有足够的利润空间,达到更高的时间框架的供应和需求,将增加你的利润。 为什么我们要过滤强区和弱区? 不平衡性越大,价格的变动就
目前有26%的折扣!! 这个指标是我们两个主要指标( Advanced Currency Strength 28   &  Advanced Currency IMPULSE with ALERT )的一个超级组合。它显示了28个外汇对的TICK-UNITS货币强度值和警报信号。可以使用11种不同的Tick-Units。它们是1、2、3、4、5、6、10、12、15、20和30秒。子窗口中的Tick-Unit栏将被显示并向左移动,当在一秒钟的定时器中至少有一个Tick。 只用一个图表,你就可以剥28个外汇货币对的头皮!想象一下,你的剥头皮将如何提高。想象一下,你的剥头皮将如何改善,因为你能够准确地确定剥头皮机会的触发点? 这是市场上第一个在比1分钟更短的时间内工作的货币强度指标! 它是为那些希望快速进出并从市场中切出小点数的快速剥头皮者准备的。 用户手册:点击这里 https://www.mql5.com/en/blogs/post/727178 特点。 为28个货币对提供嘀嗒单位的卖出/买入警报,有一个按钮可以快速打开目标图表。 在3种敏感模式中选择一种(慢-中-快
Advanced Accumulated Currency Volume
Bernhard Schweigert
4.54 (48)
目前8折优惠! 对任何新手或专家交易者来说都是最好的解决方案! 这个指标是一个经济实惠的交易工具,因为我们结合了一些专有功能和新的公式。 高级累积货币量指标专门针对主要的28个外汇对,并在所有的时间框架内工作。它是一个新的公式,在一个图表上提取澳元、加元、瑞士法郎、欧元、英镑、日元、新西兰元和美元的所有货币量(C-Volume)。这在交易中是一个很大的优势。成交量交易者会知道如何使用它。如果你是新手,那么学习如何阅读极端值,并将其加入你的交易武库。 把C-Volume看作是一个盾牌,而不是一把枪。 在主图上会显示一个警告标志,警告你进入错误的交易。 这不是常用的简单的交易量。外汇市场被扫描,每个货币的交易量被提取并累积到C-Volume。我们现在可以看到哪些货币有最高或最低的交易量。我们可以在一张图表上看到所有28个外汇对的情况。如果欧元有一个强大的峰值,检查欧元对的可能交易。如果英镑有一个强大的峰值,那么检查英镑对。 建立在新的基础算法上,它使识别潜在的转折点更加容易。这是因为它以图形方式显示货币的C-Volume峰值。这些功能的设计是为了帮助并使你远离不良交易,指导
Advanced Currency Strength28 MT5
Bernhard Schweigert
5 (2)
任何新手或专家交易者的最佳解决方案! 这个指标是一个独特的、高质量的、可负担得起的交易工具,因为我们纳入了一些专有的功能和一个新的公式。只需一个图表,你就可以读出28个外汇对的货币强度!想象一下,你的交易将如何得到改善,因为你的交易是在你的手中进行的。想象一下,你的交易将如何改善,因为你能够准确地确定新趋势或剥头皮机会的触发点? 用户手册:点击这里  https://www.mql5.com/en/blogs/post/697384 这是第一本,原版的! 不要买一个毫无价值的崇拜者的克隆品。 特别的 子窗口中的箭头显示强劲的货币势头GAP将指导你的交易! 当基础货币或报价货币处于超卖/超买区域(外盘斐波那契水平)时,在个人图表的主窗口中出现警告信号。 当货币力量从外围区间回落时,回撤/反转警报。 十字星模式的特别警报 可选择多个时间框架,以快速查看趋势! 货币强度线在所有的时间框架中都非常平稳,当使用较高的时间框架来识别总体趋势,然后使用较短的时间框架来确定精确的入口时,效果非常好。你可以根据自己的意愿选择任何时间框架。每个时间框架都由其自身进行了优化。 建立在新的基础算法
My Trades in Pips
Bernhard Schweigert
4.81 (16)
一个你不希望错过的交易工具。该指标在图表中显示所有的交易/交易,以及它所连接的符号。它打印出盈利或亏损的点数。根据选择,它通过子窗口打印一条垂直线,以便更好地进行分析。 也可以在这里查看专业版。我的交易历史专业版 https://www.mql5.com/en/market/product/50206 此外,它还增加了关于存款货币交易的总结果和总点数的信息。 你可以选择只显示当天的交易,或只显示一定数量条内的交易。 它可以显示有指定魔数的交易。如果该值被设置为0,指标将显示所有交易。如果您指定了一个专家顾问的魔数,它将只显示该专家顾问的交易。鼠标放在入口处的箭头会显示订单号,评论和魔力号码。 该指标主要与我的其他专门的货币强度指标之一一起使用。 https://www.mql5.com/en/blogs/post/679077 指标参数 ===指标设置 显示垂直线(线穿过子窗口) 显示总利润(利润或损失,包括佣金和掉期)。 显示总点数 只显示今天 在条形图中显示(0=全部)(限制条形图的数量,0将显示全部)。 在角落里显示总结果(改变结果的角落) 魔术数字过滤器
FREE
My Trade History PRO
Bernhard Schweigert
5 (3)
目前有20%的折扣!! 对任何新手或专家级交易者来说都是最好的解决方案! 回顾你的交易是成功交易者的第一步。 成功的交易者都有定期回顾其交易业绩的习惯。 这个工具将帮助你做到这一点。 有了这个工具来跟踪你的交易,审查过程将是最有效的。 分析你的手动交易或你的EA的交易。 使用3个一般视图。要在两者之间切换,只需点击按钮。 关闭的交易 开放交易 平仓+开仓交易 每个符号的所有交易都将被列出。要转到另一个符号,只需点击符号名称按钮。 对新开张和关闭的交易使用警报。这对观察你的未平仓交易非常有用。它可能是由EA、信号或手动启动的。 要切换利润或PIPs的结果,只需点击按钮。 利润 PIPs 然后切换3种分析类型。只需点击该按钮。 所有符号模式 1-符号模式 1-交易模式 在使用所有符号和单一符号模式时,将列出其特殊的分析结果。 在使用1-交易模式时,点击后退/下一个按钮,将图表移动到每个交易条目,它将列出该特定交易的特殊交易分析。 返回 下一个 输入参数 ===主要设置 只获取今天|快速检查今天的交易。 get back days (0=all,
对任何新手或专家交易者来说都是最好的解决方案! 这个指标是一个独特的、高质量的、负担得起的交易工具,因为我们已经纳入了一些专有的功能和一个秘密的公式。只需一张图表,它就能给出所有28种货币对的警报。想象一下,你的交易将如何改善,因为你能够准确地确定新趋势或剥头皮机会的触发点 建立在新的基础算法上,它使识别和确认潜在交易变得更加容易。这是因为它以图形方式显示了一种货币的强势或弱势是否正在加速,并测量了这种加速的速度--把它想象成你汽车中的速度表。当你加速时,事情显然会发生得更快,这在外汇市场上也是一样的,即如果你配对的货币正在向相反的方向加速,你就会发现一个潜在的有利可图的交易。 货币动量的垂直线和箭头将指导你的交易! 动态的市场斐波那契23水平被用作警报触发器,将适应市场活动。如果冲动触及黄色触发线,您将在MetaTrader或您的电子邮件或推送警报中收到警报。然后你就知道作为一个交易员应该做什么。货币对和方向已经给出。只要点击警报按钮,就可以切换到该货币对或打开一个新的图表,以便进一步分析。警报级别可以通过用户输入来改变,可以选择3个敏感度级别。 尽早获得新趋势的初始化触发
筛选:
Ely Alsedy
5880
Ely Alsedy 2024.03.15 09:56 
 

it's a great tool to use for assessing the market zones and make a decision also very good to spot fake outs i love to use it with Demark channel or another channel indicator the support and the author gets a THUMBS UP from me

Claudio Jones
167
Claudio Jones 2024.01.28 21:50 
 

I bought it today at first very promising, light and well built indicator. In the backtest, the reversal arrows work very well in conjunction with the alerts. Everything working perfectly.

update 27/06/24 - without a doubt it remains an excellent indicator.

great profits over this period, I'm on an insane streak. Thanks Bernhard!!!

Heyneke
55
Heyneke 2023.11.09 20:25 
 

Insanely accurate indicator ! Took the time to study the logic and settings behind the indicator. Strongly doubt you’ll find better on the market. Thanks a mil

Alexander Berger
313
Alexander Berger 2023.11.05 15:58 
 

用户没有留下任何评级信息

Dedre Du Plessis
245
Dedre Du Plessis 2023.03.14 11:22 
 

This is by far the best supply and demand indicator I have used. It takes some time to test and find the settings that will work best with your own trading style, but once you have it, it is gold. Everyone should remember, this is an indicator, it will INDICATE, but you still need to put in your own work and make sure that the zones fit your trading rules. Thank you for a great indicator, Bernhard.

[删除] 2022.10.11 13:13 
 

用户没有留下任何评级信息

Bernhard Schweigert
83124
来自开发人员的回复 Bernhard Schweigert 2023.11.05 17:46
A new version of all MT5 products was released this week. A free update is available to you.
Md Jewel Khan
243
Md Jewel Khan 2022.03.05 01:21 
 

Main issue, it's an eye wash and take your money. 5 activations only when you set up windows, then each time same pc same account gone 1 Activision. After that, they said buy again and owner big drama actor. They can't help because when you buy they get money again. Chart higher timeframe resistant and pvt nothing work. it's just never 1 or 3 candle then comeback and broken as always. Unless to waste your money and don't buy. Same type out markate some software. Here most feedback free. Owner also send email write a good review then he will discount. He is a big cheater.

Bernhard Schweigert
83124
来自开发人员的回复 Bernhard Schweigert 2022.03.05 09:13
You must have me confused with someone else. Your accusations are not true. This is how all mql5 products work. Therefore write to Metaquotes, not to me.
The MQL5 license gives you the possibility to use the indicator for all (unlimited) MT4 accounts on your computer. For this you need only 1 activation. It is practical and simple.
About the break of zones: yes zones break, this is the market, especially when there is a strong trend as we have it now with the Ukraine crisis. Why not use the break alarm in this case?
tarasovkc
80
tarasovkc 2022.02.09 12:46 
 

Awesome

Bernhard Schweigert
83124
来自开发人员的回复 Bernhard Schweigert 2022.02.09 17:16
Thanks for the review! 👍
Frank Paetsch
7379
Frank Paetsch 2022.01.24 10:51 
 

Premium Indicator

Bernhard Schweigert
83124
来自开发人员的回复 Bernhard Schweigert 2022.02.09 17:16
Thanks for the feedback! 🙏👍
Chukwuma Okoye
1015
Chukwuma Okoye 2021.12.11 09:23 
 

用户没有留下任何评级信息

Bernhard Schweigert
83124
来自开发人员的回复 Bernhard Schweigert 2022.01.24 10:53
Thanks for the review! 👍
Narcisse DEDELISSA
44
Narcisse DEDELISSA 2021.07.29 20:41 
 

J’aime bien cet indicateur, ça me trace automatiquement les zones Dynamiques, je n’ai plus à louper une zone, et ceci dans tous Timeframe. C’est cool!!!

brightenmutswa
30
brightenmutswa 2021.06.30 16:06 
 

i need help. purchased the indicator but i have a problem when i install it...it says installation failed..please help what should i do?

Bernhard Schweigert
83124
来自开发人员的回复 Bernhard Schweigert 2021.06.30 16:21
I will send you a Personal Message. Please check your MQL5 inbox.
S070
39
S070 2021.02.17 22:38 
 

Great indicator! Works very well. Recommend it to every trader. You buy value for your money.

G4U FMD
785
G4U FMD 2020.12.20 18:51 
 

This a great indicator if your strategy is based on Supply and Demand level. Bernhard is very helpful to advisor programming, which allows to create, test and finally get a great tool for trading. Отличный индикатор для стратегии торговли по уровням. Использую в реальной торговле с помощью советника, написанного на базе этого индикатора.

elvisgonya
134
elvisgonya 2020.11.04 11:58 
 

Best A&D, already recovered the money I spent. continue doing great you will go far

CaesarX
339
CaesarX 2020.09.23 12:21 
 

Perfect for setting TP and floating SL's by, take a bit of time to fully understand how supply and demand areas work, fake break outs etc but this will soon be an integral tool in your arsenal that you won't be able to go without.

Ezzy28
42
Ezzy28 2019.11.17 11:24 
 

Best supply and demand indicator ever

Ositadinma Onyeugwo
232
Ositadinma Onyeugwo 2019.02.23 15:56 
 

This is a great tool. Useful for TP and SL levels. Combined with the other indicators by Bernhard, that's a winning strategy.

回复评论
版本 7.0 2024.09.27
Version 7.0 Update Released!

Top-Rated Supply and Demand Zone Indicator on the Market

We've introduced several key improvements, fully optimized for the latest MetaTrader version. This update also addresses an issue where old zones were sometimes drawn twice, leading to duplication.

Stay ahead of the market—update now! It's free and only takes a few clicks.
Keep your edge in trading!
版本 6.9 2024.03.08
We've just released an exciting update for our indicator, packed with enhancements that take your trading to the next level.

Upgrading your indicator is a smart move. It ensures you're leveraging the latest features, giving you a competitive edge in the market. Don't miss out!

Should you have questions or need help with the update, our team is here for you. Reach out anytime; we're committed to your success.

www.CurrencyStrength28.com
版本 5.8 2023.03.03
We are proud to announce that our Supply and Demand Zone Indicator continues to be the highest rated tool of its kind in the market. Our team has worked hard to develop and refine this powerful tool, and we believe it will help you identify profitable trading opportunities with greater accuracy.
With the recent release of the new Metatrader version, we have made various improvements to ensure that our software continues to integrate seamlessly with this popular trading platform. These changes include performance enhancements, so you can expect even smoother and more reliable performance from our indicators.
版本 5.3 2022.10.11
Added more improvements.
Updating is recommended.
Various improvements for new Metatrader version.
版本 4.3 2021.11.24
Various improvements for new Metatrader version.
Another bridge for EA import has been added.
版本 3.5 2020.12.01
MAJOR UPDATE 2020 SERIES
==================

The new update brings many new features:
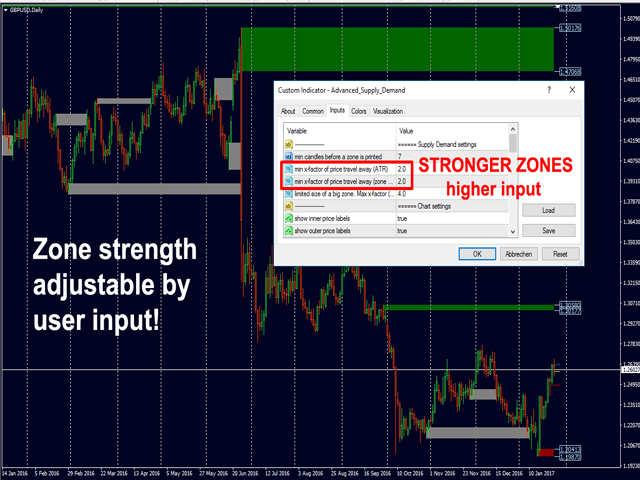
1) MODIFICATION FOR ZONE SIZE (optional)

Some traders of supply and demand zones asked for a new function. It was added optionally: Including a wick for the width of the supply and demand zones.

New input:
+ Include wick 1 for the zone size
By default, the function is not used. To use the function, you must set the new input = true (the selection is also copied to the higher time frame).
Since the zones will be wider, some zones could be filtered. You may want to use lower XY factors.

2) Some traders of supply and demand zones requested a new function. It was added optionally: Draw supply and demand zones only at major highs and lows.

New input:
+ use only major highs and lows
By default, the function is not used. To use the function, you must set the new input = true. (The choice will be copied to the higher timeframe as well.
To show all zones at highs and lows you might want to set all XY-factors = 1.0, but it can be combined.)

==================

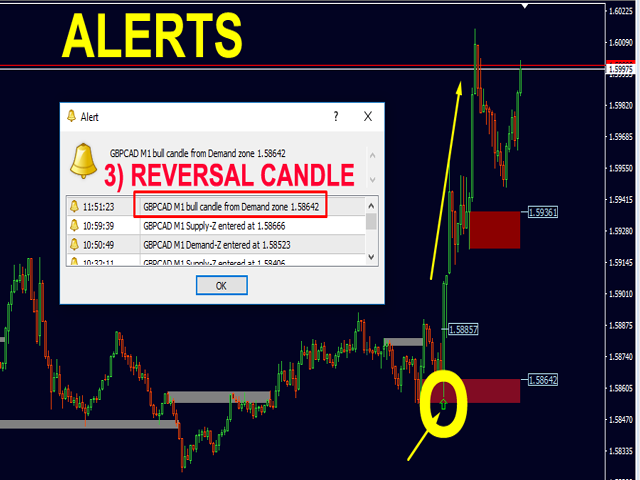
3) Added optional: Supply and Demand zones with ENGULFING BARS pattern at the beginning of the zone.
Use reversal candle color for bar 1 or bar 2 (the one before). Use either ones or both.
Use true engulfing pattern for above mentioned bars. (Must choose above.)

By default the use is false. To use the function you must set the new inputs = true.

New inputs:
==== Candle pattern
+ use reversal candle color bar 1
+ use reversal candle color bar 2 (both or either)
+ use true engulfing pattern (choose above)
版本 3.3 2020.11.17
Various improvements.
版本 3.2 2020.08.21
Various improvements.
版本 3.1 2020.08.18
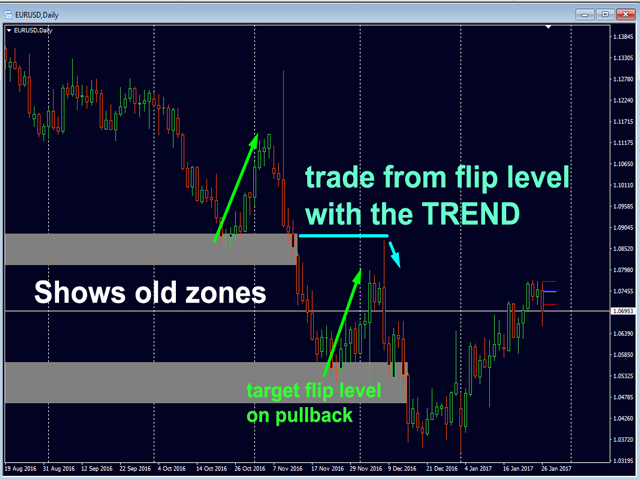
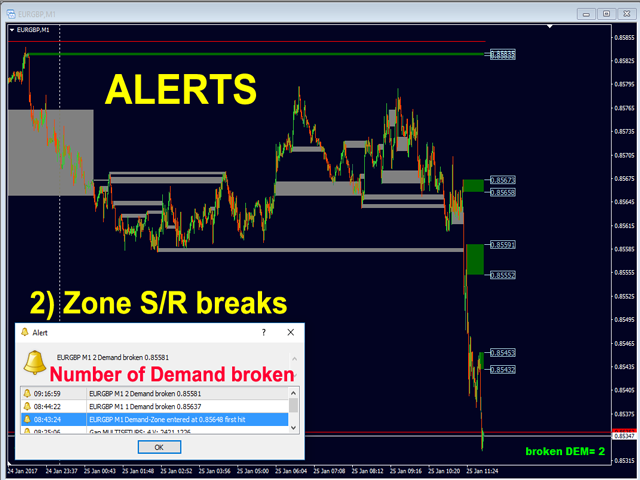
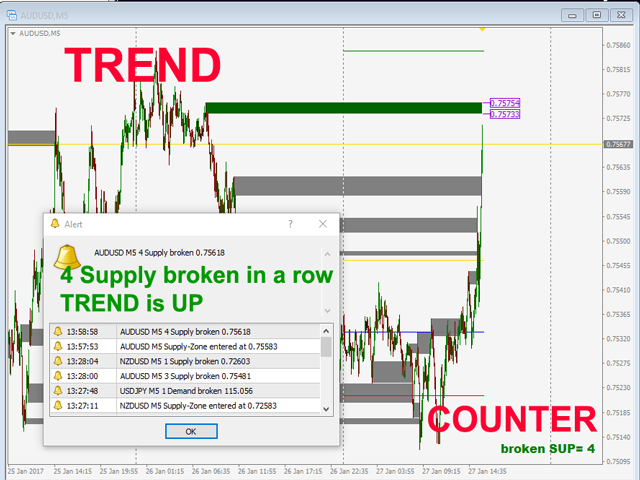
Fixed an issue with show old zones and number of broken Sup/Dem in a row.
版本 3.0 2020.02.12
Added zone size info in point.
It will show in the right corner of the rectangles. The size of the higher timeframe is shifted a few bars to the left.

New inputs:
=== Chart settings
+ show zone size (point)
+ show zone size MTF (point)

associated inputs:
+ color price labels
=== other settings
+ font size zone
+ Label font 1
版本 2.90 2019.10.20
update according to last MT4 version 2.90

1) A new alert for a fake (or false) breakout has been added with several variables:
new inputs:
==== FBO Alert settings
+ Alert Fake Breakout (FBO)
+ FBO min bar Size Point
+ FBO bar closes back % (20-90)
+ FBO pattern bar count (1-3)

2) For old zones a new candle limit was added. If there is a strong trend, zones with only 2000 bars lookback may not be within range. Therefore, this limit has been increased to 5000. But so far we don't have to draw old zones. Therefore, a new limit has been added for old zones with 1000 bars.
new input:
+ Show Bars back for old zones

3) Now you can edit the size for arrow as requested by trader.
new input:
+ reverse candle arrow size (1 to 5)

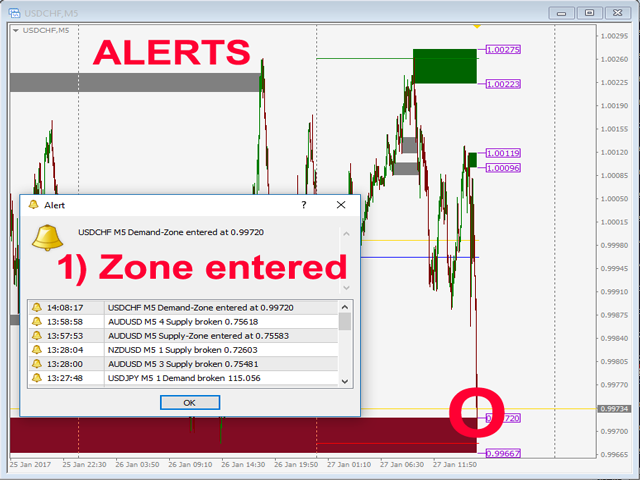
4) Added room in points for HIT-alert. Now the trader can receive an earlier alert when price is NEAR a zone. Then he can take action or watch. This input should be applied according to the symbol and timeframe. The trader can make it bigger to suit his needs. The default value is 5 points. (10 point = 1 pip.)
new input:
+ room in points for HIT-alert
版本 2.40 2018.12.10
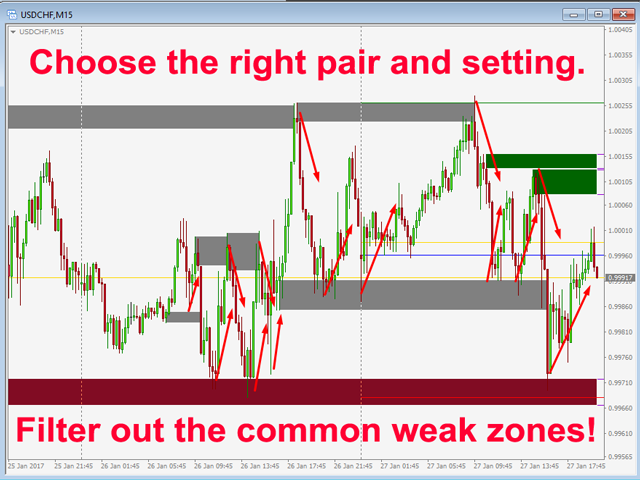
Optimized XY-filter for higher timeframe MTF.
To make sure the higher timeframe filters out weak S/D zones the same way as the lower timeframe (chart) does.
Also you can setup different values for each timeframe.
Default values are now set to:
+ min X-factor of price travel away (ATR) = 1.4
+ min Y-factor of price travel away (zone size) = 2
版本 2.30 2018.11.05
New features added!

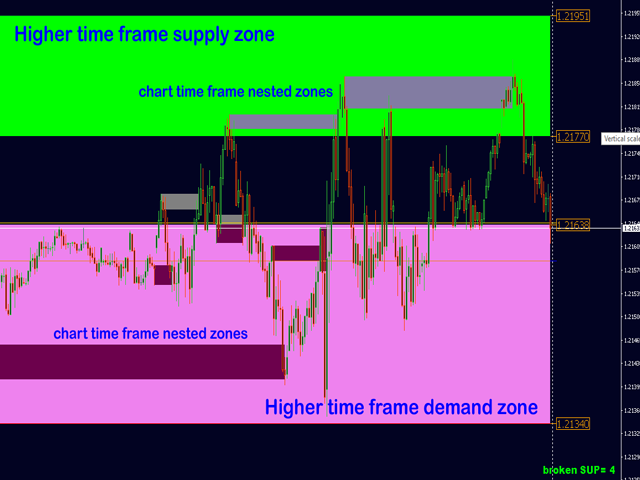
Added an optional filter to alert only nested zones. (The lower timeframe zone must be within a higher timeframe zone.)
It applies to all 3 actual alerts (hit - reverse - break).
If turned off the alerts will still tell if the alerted zone was nested or not.
New input:
+ alert only NESTED zones! (within MTF)

Added an optional pause in seconds for less CPU use. (Set to 0 to turn it off) At least on each new candle new zones will be checked.
New input:
+ pause runs in seconds to next update (for less CPU use) (0=not)
版本 2.10 2018.10.02
Added XY-filter for higher timeframe.
If you want the higher timeframe to show like before set XY-filter MTF = 1.0

New input parameters:
==== MTF settings
+ min HTF!-candles before a zone is printed
+ min X-factor of price travel away (ATR) MTF
+ min Y-factor of price travel away (zone size) MTF

Added pre-name for objects. In case you want to use the indicator twice on a chart, enter here a letter for the 2nd.

New input parameters:
==== other settings
+ prename for additional objects
版本 2.0 2018.09.24
Final upgrade with faster calculations.

+ added "usePIN" for developments (Global variables)
Gives access to all 5 supply and demand zones (outer price, inner price, is used or not, timeframe, symbol).
版本 1.20 2018.09.23
Optimized the main function and made equations faster.