Double Parabolic MTF Histo
- 指标
- Pavel Zamoshnikov
- 版本: 1.71
- 更新: 11 六月 2024
- 激活: 10
Parabolic SAR is one of the most popular indicators allowing you to determine in a timely manner the trend reversal, get an early entry point and accurately define the place of profit taking.
Parabolic SAR is very efficient in case of a trendy market but often gives false signals during a flat. In order to sort such signals out, it is possible to use the same indicator on higher timeframes. This eliminates the main drawback of the indicator during a flat, while retaining its advantage of early entry in the direction of a trend.
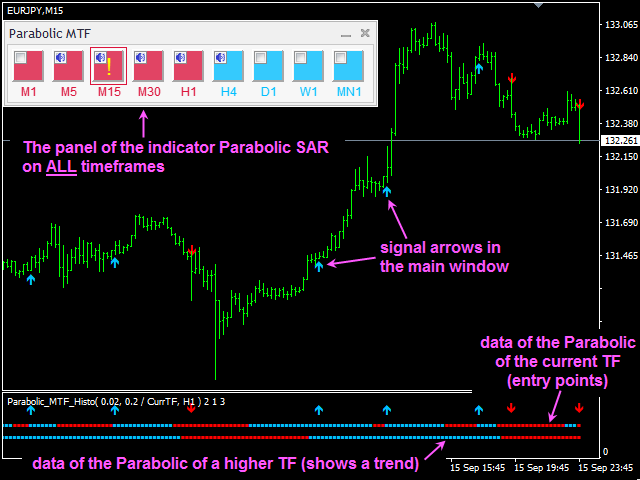
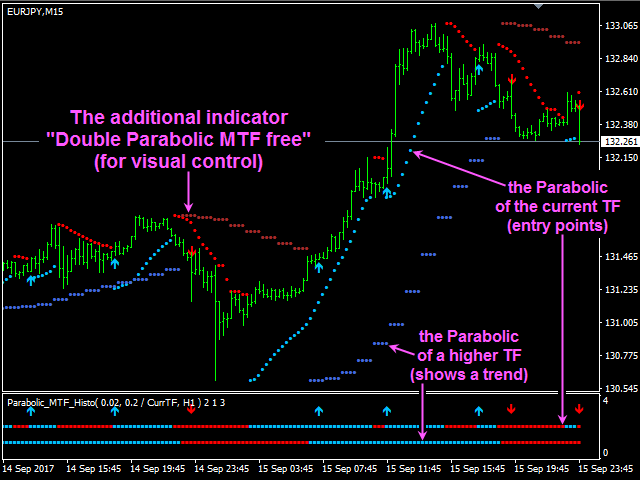
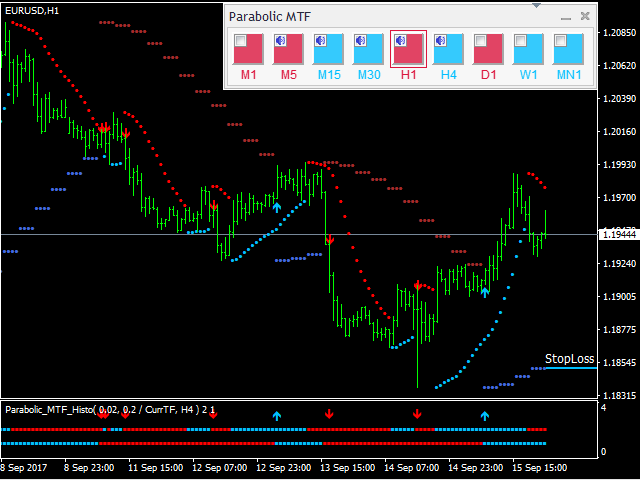
Double Parabolic MTF Histo implements this idea and combines two timeframes on a single Parabolic chart. The higher timeframe Parabolic defines the trend, while the lower timeframe one searches for the market entry point in trend direction.
Features
- Sorting out most flat movements - a signal is provided only if the directions of Parabolics from two timeframes coincide.
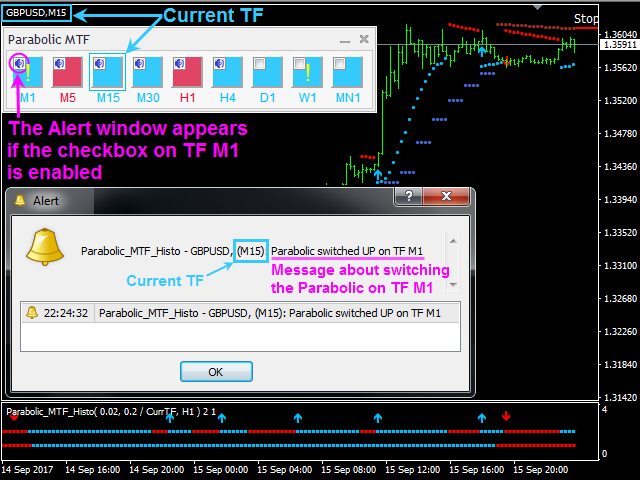
- Graphical panel of the Parabolic SAR indicator on ALLtimeframes. If Parabolic switches its direction on some timeframe, an exclamation mark is displayed on the panel, accompanied by a text message and audio signal. The messages can be customized separately for each timeframe using the corresponding check boxes.
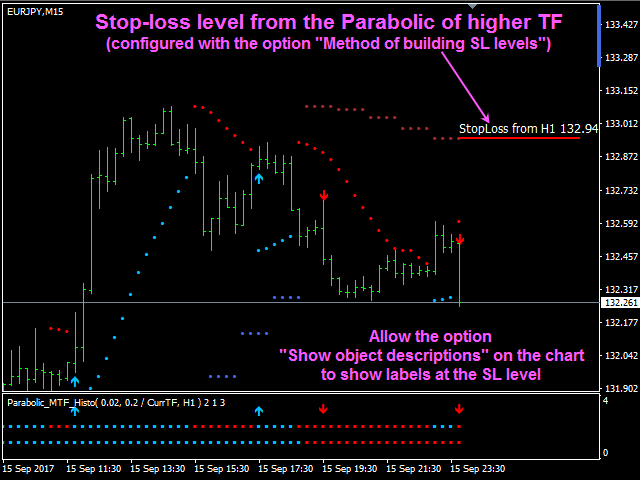
- The graphical display of a stop level that shifts by Parabolic 1 or 2 (specified in the settings).
- The current stop level is written to the global terminal variable (positive value for BUY, negative one for SELL)
(needed for EAs based on Double Parabolic MTF Histo). - Information on a signal is displayed in a message box with an audio alert. It also supports sending messages to email and push-messages to mobile devices.
- The indicator is located in a separate window, so as not to overload the main chart window. Signal arrows can also be displayed in the main window.
Parameters
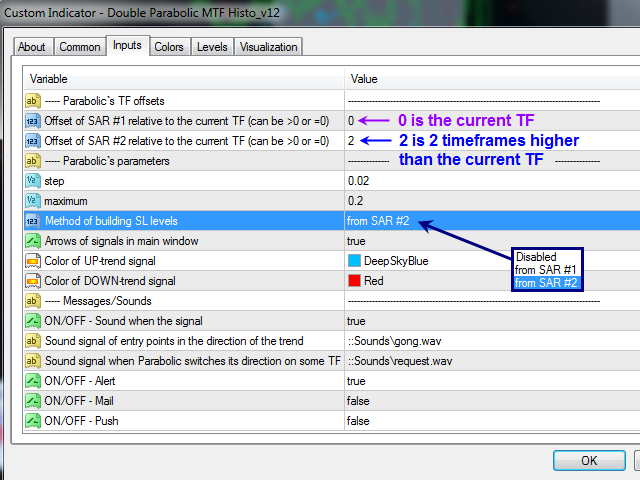
----- Parabolic`s TF offsets block - shift of the Parabolics' timeframe relative to the current one. The value can be greater or equal to 0. 1 means higher by 1, 2 - higher by 2 etc. For example, when the current period is M5, if you set the parameter to 1, the indicator will display Parabolic data on M15, and if you set it to 2, the indicator will display Parabolic data on M30:
- Offset of SAR #1 relative to the current TF (can be >0 or =0) - shift of the Parabolic 1 timeframe (by default, 0 is the current timeframe)
- Offset of SAR #2 relative to the current TF (can be >0 or =0) - shift of the Parabolic 2 timeframe (by default, 2 - 2 timeframes higher than the current one)
----- Parabolic`s parameters block - standard parameters of Parabolic SAR:
- step - price change step
- maximum - price change maximum
- Method of building SL levels - plotting Stop Loss levels:
- Disabled - SL levels disabled
- from SAR #1 - plotting by Parabolic 1 (default is the current timeframe)
- from SAR #2 - plotting by Parabolic 2 (by default, 2 timeframes higher than the current one)
- Arrows of signals in main window - enable signal arrows in the main window
- Arrow Size - size of the signal arrows in the main window
- Color of UP/DOWN trend signal - signal arrow buy/sell colors
- Show Graph Panel - display the graphical panel with data from other timeframes. Set False if you use indicator signals in the Expert Advisor or you do not need signals from other timeframes
----- Messages/Sounds ----- (Notifications and sound settings):
- ON/OFF - Sound when the signal - enable/disable sound alerts
- Sound signal of entry points in the direction of the trend - name of the audio file for market entry signals (signals are generated on closed bars)
- Sound signal when Parabolic switches its direction on some TF - name of the sound file for the signal when the Parabolic changes on a different timeframe
- ON/OFF - Alert - enable/disable messages in the terminal when signals occur
- ON/OFF - Mail - enable/disable sending emails
- ON/OFF - Push - enable/disable sending push notifications to mobile devices.


















I vote 6* for this indicator.