Winshots 3 multi timeframe MAs
- 指标
- Pawel Michalowski
- 版本: 210.122
目的:
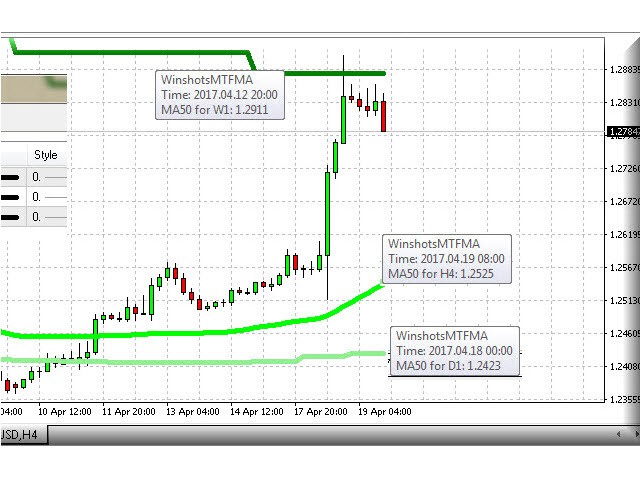
该指标的功能是在主要的MT4价格图表上绘制3条移动平均线。
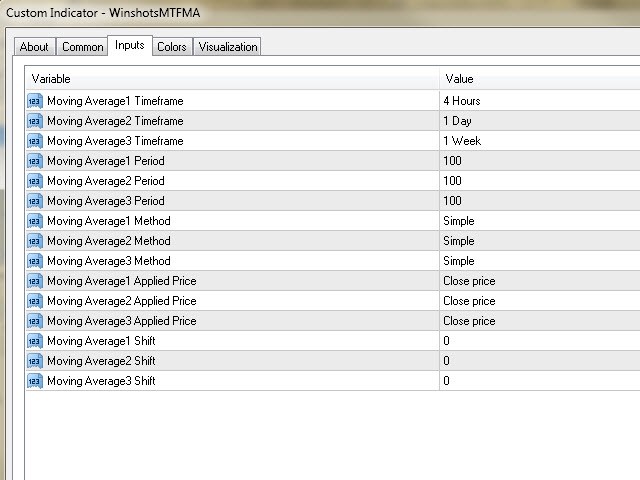
MA来自用户指定的3个不同的时间范围,与当前显示的图表无关。
当您在不同的时间范围内切换图表视图时,3个MA将继续显示属性中指定的时间范围的MA线。
例:
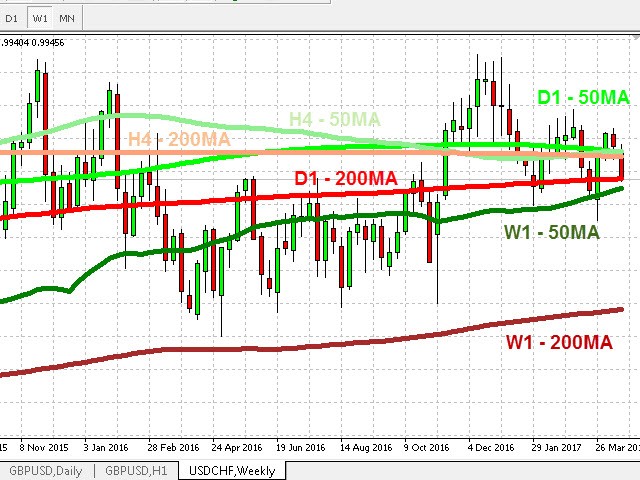
默认设置为H4,D1和W1时间帧绘制了三个50条的MA。 在M5 / M15的日内交易期间,默认设置(H4,D1,W1的MA50)可以帮助您发现较高时间范围的“硬”支撑/阻力。
好处:
始终可以在3个不同的时间范围内对所有三个MA进行可视访问,可以更好地指导您进行交易。
目的:
该指标的功能是在主要的MT4价格图表上绘制3条移动平均线。
MA来自用户指定的3个不同的时间范围,与当前显示的图表无关。
当您在不同的时间范围内切换图表视图时,3个MA将继续显示属性中指定的时间范围的MA线。
例:
默认设置为H4,D1和W1时间帧绘制了三个50条的MA。 在M5 / M15的日内交易期间,默认设置(H4,D1,W1的MA50)可以帮助您发现较高时间范围的“硬”支撑/阻力。
好处:
始终可以在3个不同的时间范围内对所有三个MA进行可视访问,可以更好地指导您进行交易。
bad