Gartley Projections D
- 指标
- Oleksandr Medviediev
- 版本: 3.53
- 更新: 30 八月 2017
- 激活: 20
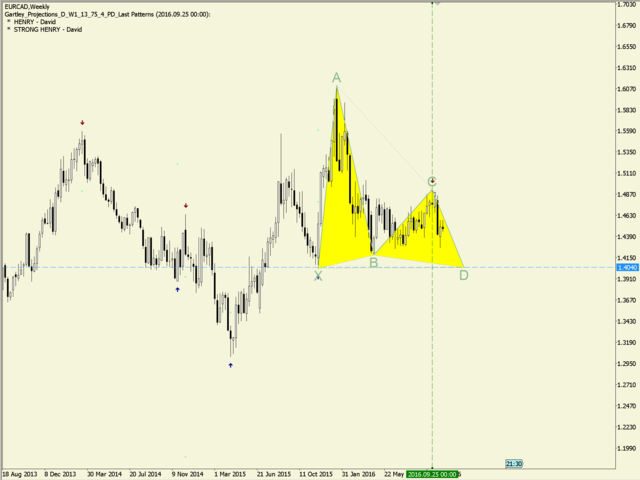
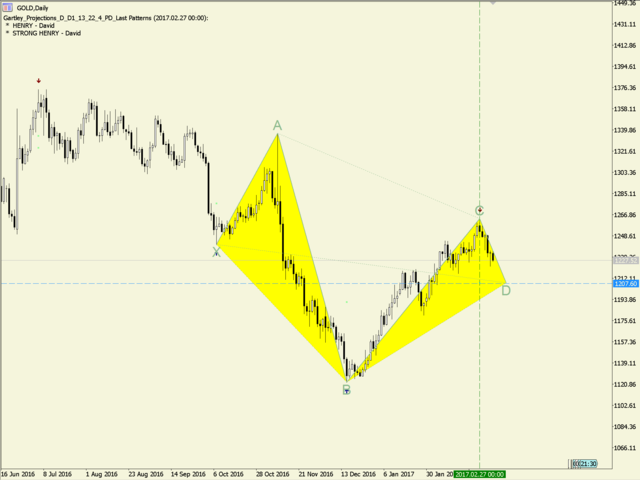
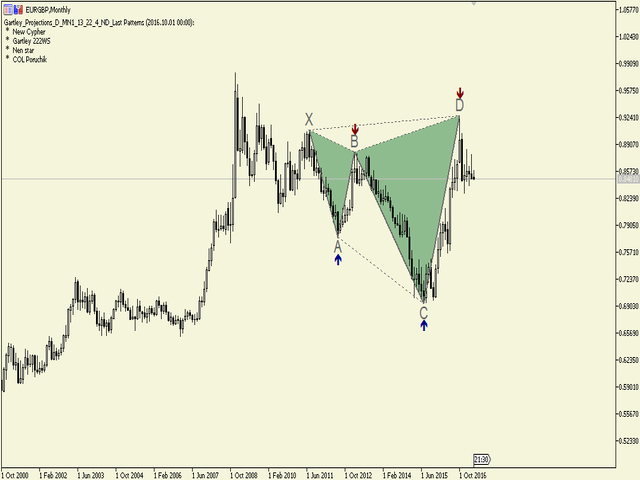
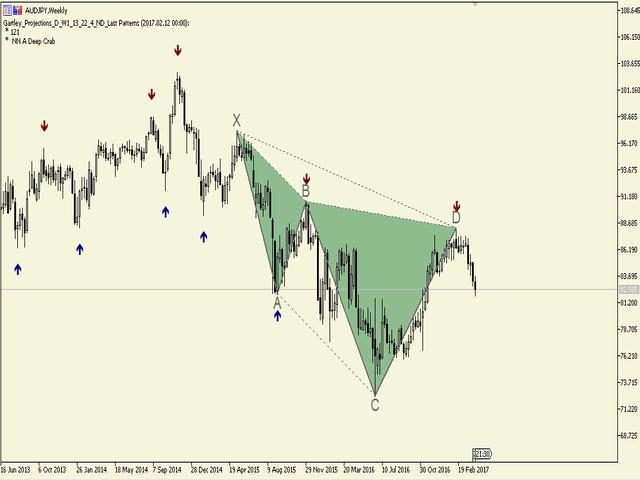
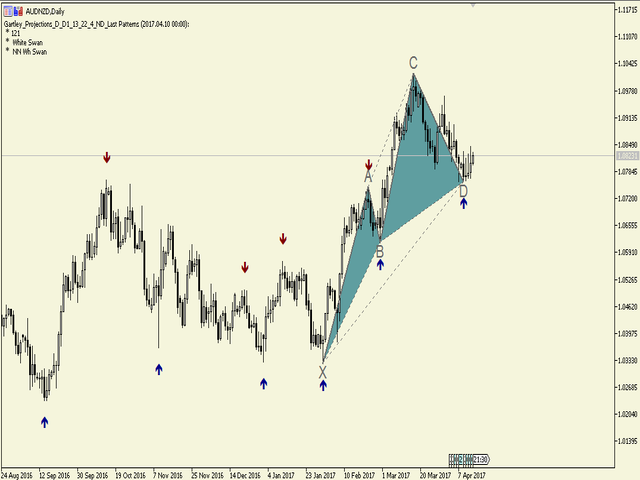
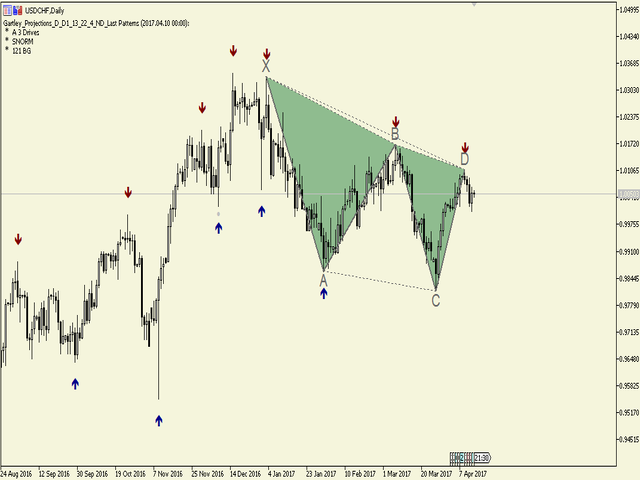
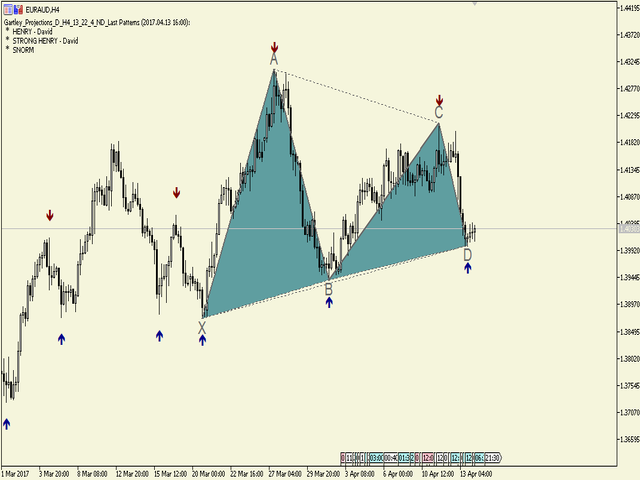
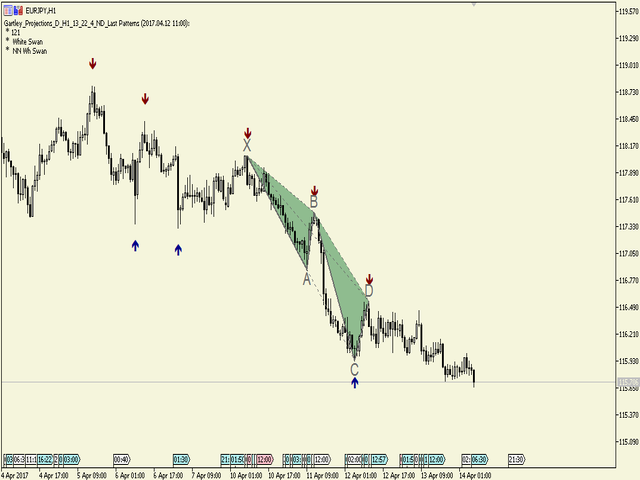
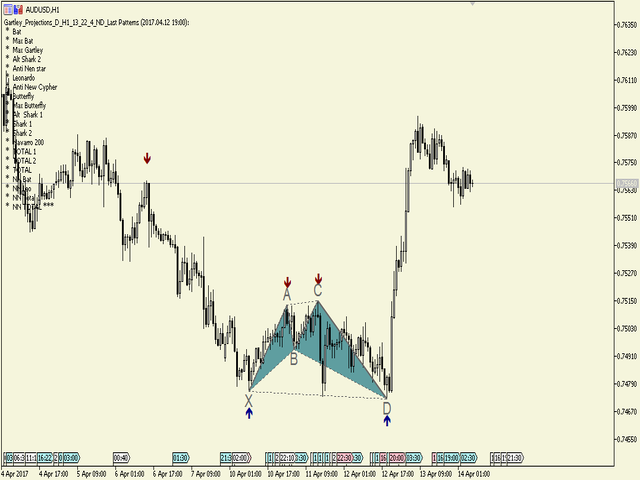
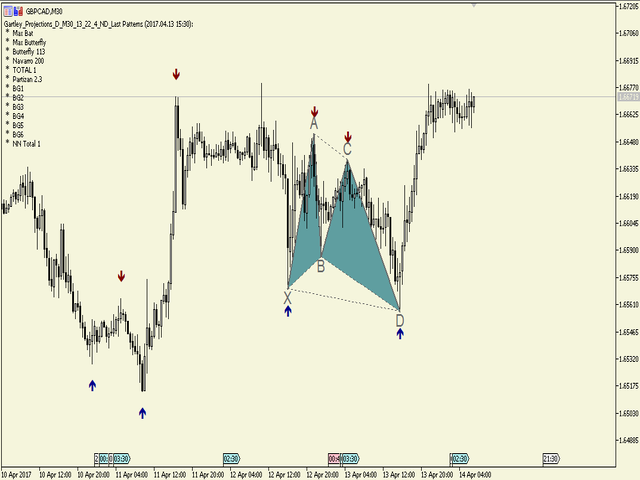
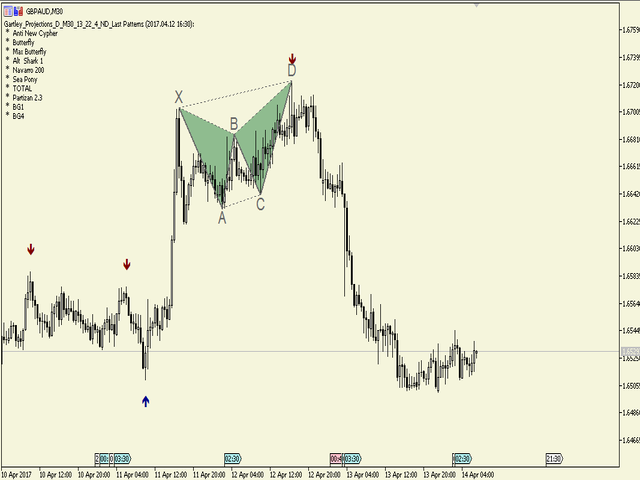
该指标根据H.M.Gartley的发展(《股票市场利润》,1935年)识别和确认谐波模式(XABCD)。
它将D点投影为透视投影中的一个点(在设置中指定ProjectionD_Mode = true)。
不会重绘。当工作时间段的柱形图关闭时,如果已识别的模式点在Patterns_Fractal_Bars柱中未移动,则在图表上出现一个箭头(指向预期价格运动的方向)。从此刻起,箭头将永久保留在图表上。
注意:连续出现2-3个或更多箭头 - 这是市场条件的变化,而不是重绘。
总共有85种模式(包括Gartley-222和Gartley-222WS,完整列表可在评论部分的Google Drive链接中找到)。在所有已识别的模式中,只有最新识别的模式填充了单一颜色。
参数
DrawPatterns(true/false)- 以实心颜色绘制模式
ProjectionD_Mode(true/false)- 定义D点作为透视投影模式
Patterns_Fractal_Bars - 在认定为形成分形的情况下,最新识别的模式点必须保持固定的工作时间段柱的数量(图表上会出现箭头)
Patterns_Deviation - 模式中侧面比例的允许百分比偏差(允许值范围)
Patterns_XA_MinLength_Bars - 初始段XA上允许的最小柱数量
Patterns_XA_MinHeight_Points - 初始段XA的最小尺寸(点数)
ZigZag_Depth - ZigZag指标参数
ZigZag_Deviation - ZigZag指标参数
ZigZag_Backstep - ZigZag指标参数
ShowInfo(true/false)- 在图表的左侧显示识别的模式列表
PrintInfo(true/false)- 将信息打印到日志
龙马精品,神效可靠,传世利益,显然立足


Also a verry good indicator