Gartley Projection D
- 指标
- Oleksandr Medviediev
- 版本: 3.23
- 更新: 22 八月 2017
- 激活: 20
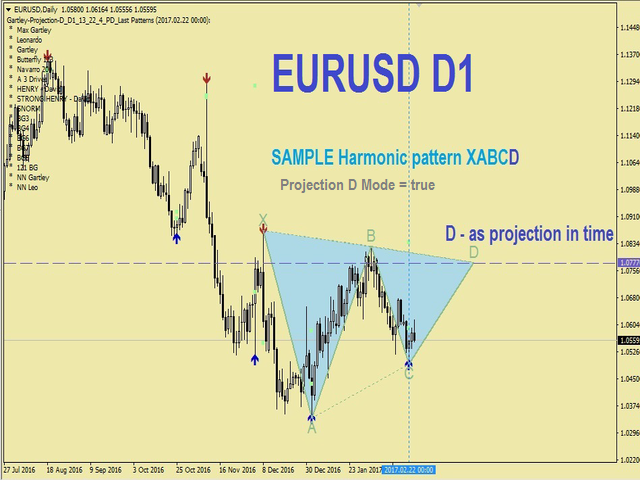
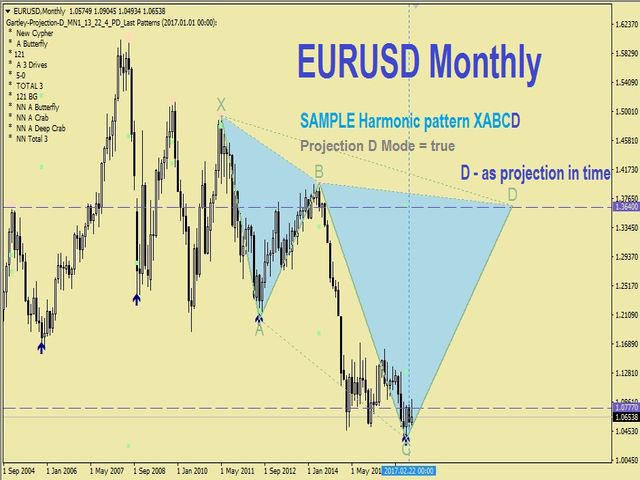
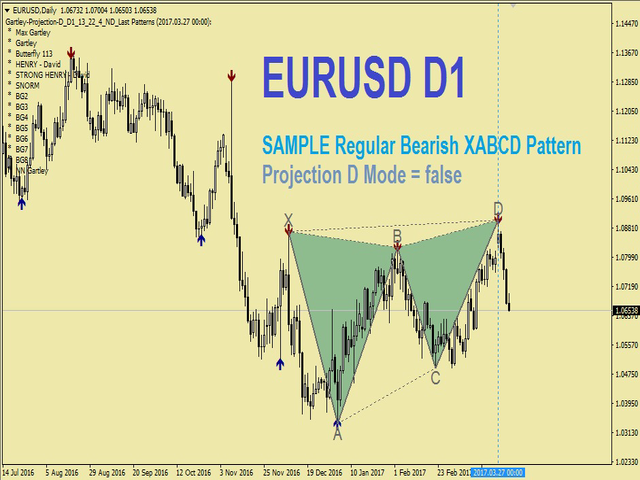
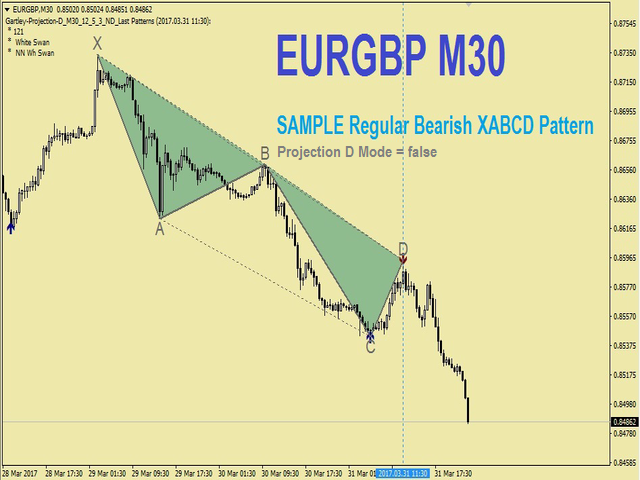
该指标根据H.M.Gartley的发展(《股票市场利润》,1935年)识别和确认谐波模式(XABCD)。
它将D点投影为透视投影中的一个点(在设置中指定ProjectionD_Mode = true)。
不会重绘。当工作时间段的柱形图关闭时,如果已识别的模式点在Patterns_Fractal_Bars柱中未移动,则在图表上出现一个箭头(指向预期价格运动的方向)。从此刻起,箭头将永久保留在图表上。
注意:连续出现2-3个或更多箭头 - 这是市场条件的变化,而不是重绘。
总共有85种模式(包括Gartley-222和Gartley-222WS,完整列表可在评论部分的Google Drive链接中找到)。在所有已识别的模式中,只有最新识别的模式填充了单一颜色。
参数
DrawPatterns(true/false)- 以实心颜色绘制模式
ProjectionD_Mode(true/false)- 定义D点作为透视投影模式
Patterns_Fractal_Bars - 在认定为形成分形的情况下,最新识别的模式点必须保持固定的工作时间段柱的数量(图表上会出现箭头)
Patterns_Deviation - 模式中侧面比例的允许百分比偏差(允许值范围)
Patterns_XA_MinLength_Bars - 初始段XA上允许的最小柱数量
Patterns_XA_MinHeight_Points - 初始段XA的最小尺寸(点数)
ZigZag_Depth - ZigZag指标参数
ZigZag_Deviation - ZigZag指标参数
ZigZag_Backstep - ZigZag指标参数
ShowInfo(true/false)- 在图表的左侧显示识别的模式列表
PrintInfo(true/false)- 将信息打印到日志
龙马精品,神效可靠,传世利益,显然立足


Updated review: I rented this indicator awhile back but came back to started using it once again because if you really study these patterns use both True and False settings it will allow you to see the whole picture of the particular pair you're trading.........This is just the way i like to use it following the False setting to trade but also using the True setting to be able to calculate my exit area to take profit at........Simply the best out there recommend is 1,000%!!! Thanks for your hard work on this huge winner, Oleksandr!!
Awesome Indicator, Great Work!! Truly no repainting arrows plus nice Gartley patterns respecting prices as far as I can see I can't wait to use it long term but short term I've had it already had a couple of winners following longer 1h,4h time frames THANKS!